
The financial information included in this document is based on IFRS, as explained in General information to the Consolidated financial statements, unless otherwise indicated.
This document contains certain forward-looking statements. By their nature, these statements involve risk and uncertainty. For more information, please refer to Forward-looking statements and other information.
References to the company, to Philips or the (Philips) Group or group, relate to Koninklijke Philips N.V. and its subsidiaries, as the context requires. Royal Philips refers to Koninklijke Philips N.V.
This document comprises regulated information within the meaning of the Dutch Financial Markets Supervision Act (Wet op het financieel toezicht).
The chapters Group financial statements and Company financial statements contain the statutory financial statements of the company. Under 'Management report' in section References to the content of this Annual Report we set out which parts of this Annual Report form the Management report within the meaning of Section 2:391 of the Dutch Civil Code.
Due to rounding, amounts may not add up precisely to the totals provided in this report.
The challenges of a world in turmoil amplify the sense of urgency I feel to make sure Philips delivers on its purpose and becomes an even stronger force for good, so people everywhere can look after their health and well-being and access the care they need, with us focusing on where we can help, from the hospital to the home.
In January 2023, we announced our multi-year plan to create value with sustainable impact. Throughout the year, Philips teams around the world worked relentlessly, in a volatile environment, to deliver on the first phase of that plan, laying a strong foundation for sustained future success.
Our products and services reached 1.9 billion people in 2023, including 221 million in underserved communities – taking us closer to our goal of improving 2.5 billion lives per year by 2030, including 400 million in underserved communities.
Our improved operational performance was driven by significant progress on the three pillars of our plan to create value for all our stakeholders: 1) focused organic growth; 2) scalable people- and patient-centric innovation; and 3) focus on execution to enhance patient safety and quality, strengthen our supply chain reliability, and establish a simplified, agile operating model.
We achieved our raised 2023 outlook with strong sales growth, improved profitability, and strong cash flow, despite the uncertainties brought about by an increasingly turbulent geopolitical environment. While the order book remains strong in absolute terms, order intake was down, for which the necessary improvement actions are under way. There is still a lot of work to be done, but 2023 represents a good start, and it reinforces our confidence in delivering on our three-year plan.
Resolving the consequences of the Respironics recall for our patients and customers is a key focus area, and I apologize for the distress caused. Globally, over 99% of the sleep therapy device registrations that are complete and actionable have been remediated, while the remediation of the ventilator devices remains ongoing.
We are fully committed to complying with the terms of the consent decree agreed with the US Department of Justice (DOJ), representing the US Food and Drug Administration (FDA), which primarily focuses on Philips Respironics in the US. The proposed consent decree will provide Philips Respironics with a roadmap of defined actions, milestones, and deliverables to demonstrate compliance with regulatory requirements and to restore the business. Further details will become available once the consent decree has been finalized and submitted to the relevant US court for approval.
As well as implementing all measures agreed with the FDA and DOJ in connection with the Respironics recall, we will continue to rebuild relations with the FDA and other national regulators. In October, Philips Respironics received preliminary court approval for the class action settlement that would resolve all or nearly all private economic loss claims in the US related to the recall. The settlement does not include or constitute any admission of liability, wrongdoing, or fault by any of the Philips parties. The previously disclosed litigation, including the personal injury and medical monitoring claims, and investigation by the DOJ related to the Respironics recall are ongoing.
With patient safety and quality the number one priority, oversight now resides at Executive Committee level, and we have a new organization in place, with stronger processes and more effective early warning systems in the businesses. We are pro-actively addressing quality improvements and first-time-right design. One of the most inspiring events of the year took place in October – a company-wide Timeout for Patient Safety and Quality. All 70,000 employees came together in their teams to discuss how we are moving forward on patient safety and quality, and how to take it further.
In our drive to create more reliable and resilient supply chains, we have significantly reduced our high-risk components and our inventories, and the actions we have taken continued to have a positive impact on our sales and service levels. We continue to strengthen further through regionalization of the supply base and manufacturing capability to better respond to local requirements with a shorter value chain.
We also started the shift to our new, simplified operating model – with end-to-end businesses supported by a leaner enterprise layer, strong regions and a reinvigorated impact culture – and completed the realignment of workforce roles and reporting lines. This included the difficult but necessary reduction of approximately 8,000 roles to date, out of the planned reduction of 10,000 roles by 2025.
Reflecting our changing culture of people- and patient-centricity, accountability and impact, our Executive Committee was strengthened with the arrival of four new members in 2023, each bringing valuable experience and skills to the work of our leadership team. We also welcome the decision by Exor to take a 15% minority stake in our company – a sign of confidence in our plan, our people, and our future. And we marked the 100th anniversary of Philips in China, a remarkable achievement.
Today, millions of people around the world have little or no access to basic healthcare, and climate change is impacting both environmental and human health. Healthcare is simply not working as it needs to. There are not enough doctors and nurses to address the growing demand for care. In parallel, rising costs are stretching financial budgets to the limit.
That’s why we are advocating for systemic change, driven by all ecosystem players, that addresses technology, clinical practice, financing and regulation as a whole. Change that delivers better, more productive healthcare that works for everyone. Without this change, communities all around the world will increasingly face challenges to get the care they need.
Focusing our efforts on where we can make a difference, we want to help more healthcare providers help more patients, in a sustainable way, and empower more people to take care of their health and well-being – by applying our combined capabilities in innovation, design and sustainability.
There is a lot of work to be done, but we see the potential for a future where health systems run smoothly, efficiently and sustainably, with doctors and nurses seeing the patient at the right time and at the right point of care. Where they can be confident that the right choice is also the easy choice, with simpler workflows enabling them to give patients the best care and best experience.
With real-time and predictive insights supporting collaboration across the patient journey. And AI being used in a responsible manner to optimize workflows and improve efficiency, so that clinical staff get the time and space to focus on what matters and what they do best: caring for their patients.
We see a future where it is also easier for people everywhere to look after their health and well-being. For example, with solutions helping more parents and babies in the first 1,000 days and supporting the connection between good oral care and good overall health.
Recognizing that human health and environmental health go hand in hand, we are collaborating with our customers and suppliers to decarbonize healthcare and so create a more sustainable and resilient industry.
While realistic about the challenging economic environment, geopolitical risks, and uncertainties around ongoing litigation, I am confident we will continue to deliver on our multi-year plan to create value with sustainable impact – helping consumers lead healthy lives and healthcare providers deliver efficient, high-quality care to patients in a sustainable way. Based on our ongoing actions to enhance execution – driving patient safety and quality, increasing supply chain reliability, and further simplifying how we work – we expect further performance improvement in 2024.
Against this background, and reflecting the importance we attach to dividend stability, we propose to maintain the dividend at EUR 0.85 per share, to be distributed fully in shares.
On behalf of the Executive Committee, I would like to thank our consumers, our customers and their patients, our suppliers and ecosystem partners for their support, and the Supervisory Board for their support and guidance. I also want to express my deep gratitude to our employees for their dedication to improving people’s lives and our company’s performance, and to our shareholders and other stakeholders for their continued support.
As I look ahead, I am realistic about the challenges we face, optimistic about building on the momentum we have created, and excited about delivering on our purpose – for the benefit of patients, customers and consumers the world over.
Roy Jakobs
Chief Executive Officer
Royal Philips has a two-tier board structure consisting of a Board of Management and a Supervisory Board, each of which is accountable to the General Meeting of Shareholders for the fulfillment of its respective duties. The Board of Management is entrusted with the management of the company. The other members of the Executive Committee have been appointed to support the Board of Management in the fulfilment of its managerial duties. Please also refer to Board of Management and Executive Committee within the chapter Corporate governance.
Roy Jakobs joined Philips in 2010 and has held various global leadership positions across the company, starting as Chief Marketing & Strategy Officer for Philips Lighting. In 2012, he became Market Leader for Philips Middle East & Turkey, leading the Healthcare, Consumer, and Lighting businesses out of Dubai. Subsequently, he became Business Leader of Domestic Appliances, based in Shanghai, in 2015. In 2018, Roy joined the Executive Committee as Chief Business Leader of the Personal Health businesses and in early 2020 he started as Chief Business Leader of Connected Care. Prior to his career at Philips, he held various management positions at Royal Dutch Shell and Reed Elsevier.
Born 1961, Indian
Executive Vice President
Member of the Board of Management (since December 2015)
Chief Financial Officer
Abhijit Bhattacharya first joined Philips in 1987 and has held multiple senior leadership positions across various businesses and functions in Europe, Asia Pacific and the US. Between 2010 – 2014, he was the Head of Investor Relations of Philips, and subsequently, CFO of Philips Healthcare, Philips’ largest sector at the time. Prior to 2010, Abhijit was Head of Operations & Quality at ST-Ericsson, the joint venture of ST Microelectronics and Ericsson, and he was CFO of NXP’s largest business group.
Born 1973, Dutch
Executive Vice President
Member of the Board of Management (since November 2017)
Chief ESG & Legal Officer
Marnix van Ginneken joined Philips in 2007 and became Head of Group Legal in 2010. In 2014, Marnix became Chief Legal Officer of Royal Philips and Member of the Executive Committee. In 2017 he was appointed to the Board of Management. He is responsible for driving ESG efforts across the company, including Sustainability. He is also responsible for Legal, Intellectual Property & Standards and Government & Public affairs. Since January 1, 2024 he is Chairman of the Board of the Philips Foundation. In 2011, he was appointed Professor of International Corporate Governance at the Erasmus School of Law in Rotterdam. Before joining Philips, Marnix worked for Akzo Nobel and as an attorney in a private practice.
This page reflects the composition of the Executive Committee as per December 31, 2023. For a current overview of the Executive Committee members, see also https://www.philips.com/a-w/about/executive-committee.html

Significant opportunities to drive impact – helping healthcare providers help more patients, in a sustainable way, and empowering more people to take care of their health and well-being
Patient safety and quality at the heart of innovation design
Strong customer interest in AI-enabled health technology innovations across our portfolio
Personal health innovations supported by online expansion, retail partnerships, and scaling of new business models
Respironics recall: remediation of sleep devices almost complete, remediation of ventilator devices ongoing
Today, most healthcare systems are struggling to keep up with the ever-rising need for, and cost of, healthcare, while systemic staff shortages and financial resource constraints increase the pressure. Climate change is impacting both environmental and human health, compounding the stress on our healthcare systems and influencing consumer behavior. At the same time, in both the hospital and the home, emerging technologies and AI are affecting our lives like never before.
At Philips, our purpose is to improve people’s health and well-being through meaningful innovation. As such, we see huge opportunities to make a difference through innovation, design, and sustainability – partnering with our healthcare customers to increase productivity and deliver better care for more people through our innovation platforms of monitoring, imaging, interventional and enterprise informatics. And empowering more people to take care of their health and well-being through our personal health propositions.
As a health technology company, Philips is committed to driving progressive value creation through a strategy of focused organic growth, scalable patient- and people-centric innovation, and focus on reliable execution.
Philips has significant strengths to build on. We have a portfolio of patient- and people-centric innovations in hardware, software, AI and services, supporting care in the hospital and in the home. And we are the preferred strategic and innovation partner for many customers across the globe.
We operate in growing market segments, where attractive margins provide a foundation for sustainable value creation. To deliver on our strategy, we make clear portfolio choices. We are concentrating our resources on areas where we have strong positions and can accelerate growth and expand margins more quickly – Image Guided Therapy, Monitoring, Ultrasound, and Personal Health. In doing so, we will focus to support clinical workflows in areas where we have domain leadership, such as cardiology, and that build on our deep strength in the Intensive Care Unit (ICU) and Cath Lab.
In Diagnostic Imaging, our goal is to help healthcare providers who need to do more with less. We will do so by leveraging our differentiating, AI-enabled innovations to increase their imaging workflow productivity, departmental efficiency and financial sustainability and, by doing so, improve our margins and drive uptake of our services supporting care pathways.
We help our customers to unlock actionable insights from pools of medical imaging data, vital signs (patient monitoring) data and insights generated with the support of artificial intelligence (AI) to optimize care delivery across the patient journey. With the scaling of our end-to-end multi-vendor Enterprise Informatics business, we aim to grow our platforms such as radiology, pathology and remote care delivery across health systems and care settings, while building long-term customer relationships, generating recurring revenue and enabling the hardware business to maintain a competitive advantage.
Additionally, we remain committed to rebuilding our position in Sleep & Respiratory Care while continuing to resolve the effects of the Respironics recall.
At Philips, we’ve been innovating to improve lives for over 130 years. People’s needs are at the very heart of how we innovate and design for sustainable impact with a ‘safety and quality first’ mindset.
Innovation is our core strength and will continue to be our core differentiator. Recent industry trends have accelerated the adoption of technology within healthcare. We are embracing these trends and shifting our innovation to a more patient- and people-centric model closer to our customers. This starts with asking: What do people – in our case, patients and clinicians, nurses and technicians, consumers – really need? And how can we best support healthcare professionals with their workflow?
In our businesses, we are focusing our efforts and resources on fewer projects offering greater scale and impact on patient outcomes and care providers’ clinical, operational and sustainability challenges. We do this by balancing new, breakthrough innovations and continuous optimized lifecycle management, through upgrades and services, of Philips products and systems already deployed in care settings. We bring together expertise across the product lifecycle, from research through serviceability, to ensure our innovations drive maximum impact for our customers and consumers – delivering a superior experience and value, with minimum environmental impact.
Enabled by a culture of patient- and people-centricity, accountability and impact, supported by strong health technology capabilities, we see effective execution as the key value driver of our plan and a key driver for change. We are focusing on:
First, patient safety and quality is at the heart of everything we do. We have stepped up accountability for patient safety and quality, for example, by elevating oversight to the Executive Committee and creating a new organization, with stronger processes and more effective early warning systems in the businesses, as well as giving all employees dedicated patient safety and quality objectives. We are investing in systems, capabilities and training to facilitate identification of potential patient safety or quality issues. And we are taking the learnings from the Respironics recall to improve our ability to correctly assess patient safety and provide quality of the highest standard across Philips and in delivery to patients, customers and consumers.
Second, we are re-shaping our supply chain set-up so we can ensure reliable delivery of products and services and deliver our order book. We have moved away from being organized around central functions to a structure where we align procurement and supply chain to our businesses. A more regionalized structure combined with dual sourcing that can work effectively even when volatile conditions emerge in different parts of the world. We are pruning our product portfolio, which includes a long tail of smaller product lines and older generations of our products. We also have a dedicated team redesigning products and components to increase our resilience to more volatile demand.
Finally, we are implementing our simplified operating model to enable us to better serve patients, customers and consumers, as well as ensuring that our cost of organization remains competitive in an inflationary and cost-driven environment, and that we are more agile in responding to changes in the market. Prime accountability has been assigned to the businesses, supported by lean Functions and Regions following tailored models, all guided by fewer KPIs and more focused targets.
Building on our strong heritage in environmental sustainability and social impact, we have operationalized our purpose by adopting a fully integrated approach to doing business responsibly and sustainably. We are partnering with stakeholders to drive environmental, social and governance (ESG) priorities and make a global impact. For example:
With our global reach, market leadership positions, deep clinical and technological insights, and patient- and people-focused innovation, we believe Philips is well positioned to help deliver real change across healthcare. Fueled by our purpose and supported by a reinvigorated culture of accountability and empowerment, as well as strengthened health technology capabilities, we aim to progressively create value with sustainable impact.
The overview below is based on the International Integrated Reporting Council framework and includes resource inputs, value outcomes and societal impact across various financial and Environmental, Social and Governance (ESG) dimensions.
We identify the Environmental, Social and Governance topics which we believe have the greatest impact on our business and the greatest level of concern to stakeholders along our value chain, for instance patient safety and quality. We do this through a multi-stakeholder process. Please refer to Working with stakeholders and advocacy for more information. Assessing these topics enables us to prioritize and focus upon the most material topics and effectively address these in our policies, programs, targets and actions. We do this with reference to the GRI standard and identify and assess impacts on an ongoing basis, for example through discussions with our customers, suppliers, investors, employees, peer companies, social partners, regulators, NGOs, and academics. We also conduct a benchmark exercise, carry out trend analysis and run media searches to provide input for our materiality analysis. GRI has not yet published a sector standard for the healthcare industry. Philips’ impact on society at large is covered through our Lives Improved metric and the Environmental Profit & Loss account, as well as a number of other KPIs addressed in Environmental, Social and Governance. The result of our impact materiality assessment you will find below.
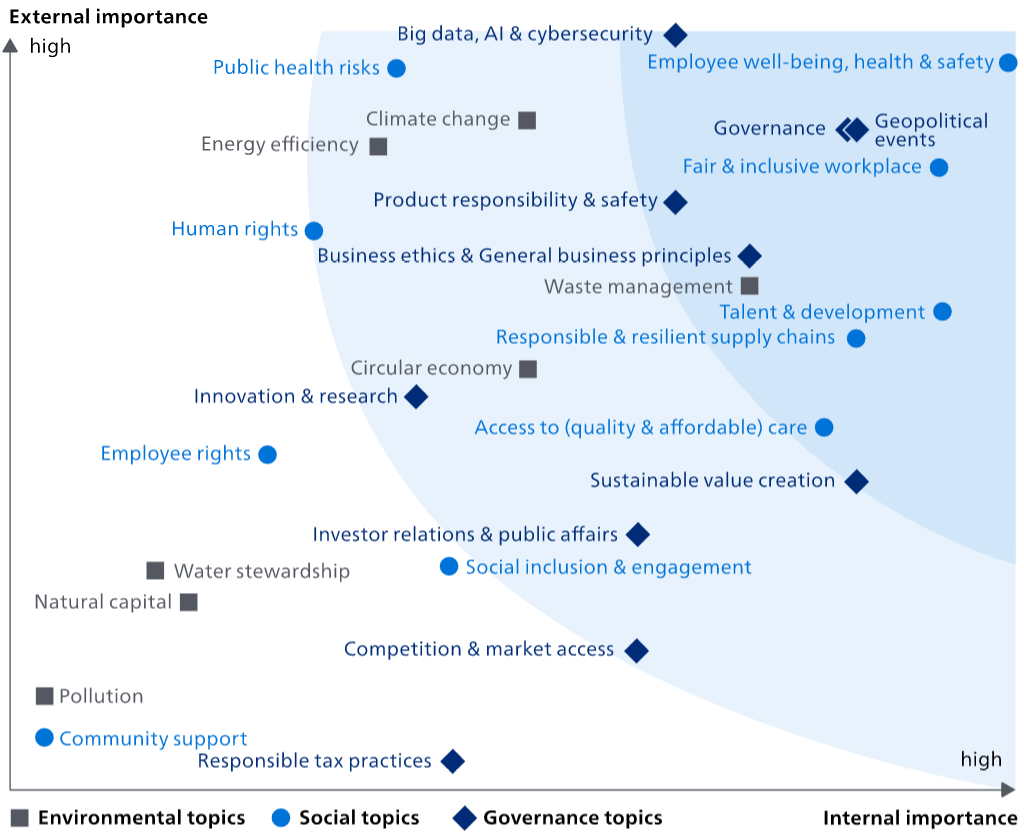
Similar to 2022, we used an evidence-based approach to materiality assessment, powered by a third-party AI-based application. The application allows automated sifting and analysis of millions of data points from publicly available sources, including corporate reports, mandatory regulations and voluntary initiatives, as well as news. With this data-driven approach to materiality assessment we have incorporated a wider range of data and stakeholders than was ever possible before and managed to get an evidence-based perspective on regulatory, strategic and reputational risks and opportunities. Topics were prioritized through a survey sent to a large and diverse set of internal and external stakeholders, combined with input from the application.
On both external and internal importance axis, the most significant increases compared to 2022 were Waste management and Social inclusion & engagement. Innovation & research went down on both axes. On the internal importance axis, there was a significant decrease on Pollution.
After completing the regular impact materiality assessment, we completed a preliminary 'double materiality' assessment, in preparation for the upcoming requirements of the EU Corporate Sustainability Reporting Directive (CSRD). The double materiality assessment addresses both financial materiality (the impact of society on Philips) as well as impact materiality (the impact of Philips on society): we only included the high and medium material topics from impact materiality and/or financial materiality. The data sources used for the financial materiality include corporate reports, mandatory regulations with sanctions, voluntary initiatives by e.g. central banks, and Sustainability Accounting Standards Board (SASB) accounting metrics. For impact materiality, we included sustainability data from corporate reports or sustainability reports, coverage in the news and voluntary initiatives and regulation. We calibrated the financial and impact materiality with a team of internal experts from Enterprise Risk Management, Group Control, Internal Audit, Insurance and Risk Management and Sustainability and aligned with our Enterprise Risk Management assessment. After this calibration the financial impact of Product responsibility & safety, Geopolitical events, and Big data, AI & Cybersecurity were increased. The results of the double materiality analysis are depicted below.
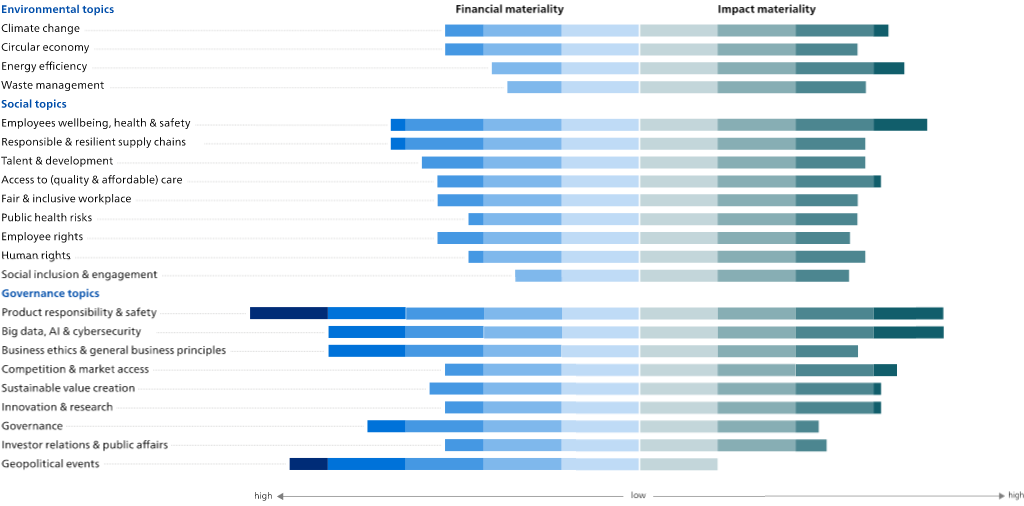
From the financial materiality assessment, the topics that ranked highest were: (1) Product responsibility & safety, (2) Geopolitical events, and (3) Big data, AI & Cybersecurity, as well as Business ethics & General business principles.
From the impact materiality assessment, the topics that ranked the highest were: (1) from the Environmental topics, Climate change, and Energy efficiency; (2) from the Social topics, Employee well-being, health & safety, and Access to (quality & affordable) care; and (3) from the Governance topics, Big data, AI & Cybersecurity, and Competition & market access. These topics are all covered in more detail in the Annual Report 2023 and monitored regularly.
The outcome of the double materiality assessment did not result in any significant changes in the material topics identified from impact materiality.
The results of our materiality assessment have been reviewed and approved by the Philips Board of Management and will be used to prepare for the upcoming EU legislation.
For more information on materiality, refer to Material topics and our focus.
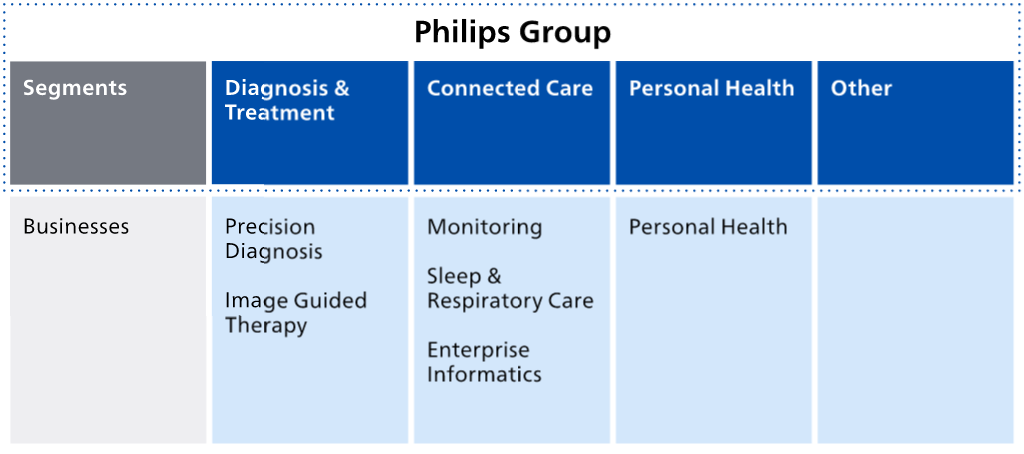
Koninklijke Philips N.V. (Royal Philips) is the parent company of the Philips Group. As announced on January 30, 2023, Philips has changed its operating model to end-to-end businesses with single accountability in order to make the company more agile in its drive to create value with sustainable impact. The segments Diagnosis & Treatment, Connected Care and Personal Health are each responsible for the management of their business activity worldwide, and are made up of the six businesses shown below. Additionally, Royal Philips identifies the segment Other.
Philips Group
Total sales by reportable segment
| 2023 | |
|---|---|
| Diagnosis & Treatment | 49% |
| Connected Care | 28% |
| Personal Health | 20% |
| Other | 3% |
Our Diagnosis & Treatment businesses create value through their portfolio of innovative AI-enabled solutions that support precision diagnosis and minimally invasive treatment in therapeutic areas such as cardiology, peripheral vascular, neurology, surgery, and oncology. With these solutions, we enable our customers to realize better health outcomes, improved patient and staff experience, and lower cost of care.
Serving diagnostic imaging markets globally, our goal is to improve customer performance in the radiology/imaging workflow. We see significant opportunity to enable precision diagnosis while at the same time supporting adjacent needs for care orchestration across care pathways and increasing departmental productivity. We do this through smart diagnostic systems, connected workflow solutions, and integrated AI-supported diagnostics and pathway informatics. These drive enterprise-wide operational efficiency and help clinicians to provide an early and definitive diagnosis, enabling them to select tailored care pathways with predictable outcomes for every patient, both inside and outside the hospital.
We also provide integrated solutions combining imaging systems, diagnostic monitoring data and therapeutic devices, which optimize interventional procedures to deliver more effective treatment, better outcomes and higher productivity. Building upon our leading-edge Azurion system, we continue to innovate, optimizing clinical and operational lab performance through advances in workflow and integration for routine procedures, and expanding the role of image-guided interventions to treat new groups of patients such as those with complex diseases including various cardiovascular conditions, stroke and lung cancer. We are also innovating the way we engage with our customers, using new business models across different care settings, including out-of-hospital settings such as office-based labs and ambulatory surgical centers, which offer clear clinical, financial and operational benefits.
In 2023, the Diagnosis & Treatment segment consisted of the following businesses:
Diagnosis & Treatment
Total sales by business
| 2023 | |
|---|---|
| Precision Diagnosis 1) | 61% |
| Image Guided Therapy | 39% |
Revenue is predominantly earned through the sale of products, leasing, customer services fees, recurring per-procedure fees for disposable devices, and software license fees. For certain offerings, per-study fees or outcome-based fees are earned over the contract term.
Sales channels are a mix of a direct sales force, especially in the larger markets, third-party distributors and an online sales portal. This varies by product, market and price segment. Our sales organizations have an intimate knowledge of technologies and clinical applications, as well as the solutions necessary to solve problems for our customers.
Sales at Philips’ Diagnosis & Treatment businesses are generally higher in the second half of the year, largely due to the timing of customer spending patterns.
At year-end 2023, Diagnosis & Treatment had 28,397 employees worldwide.
At RSNA23, Philips announced a raft of new innovations, including next-generation EPIQ Elite 10.0 and Affiniti ultrasound systems that increase diagnostic confidence and workflow efficiency, BlueSeal MRI Mobile, the world’s first and only mobile MRI system with helium-free operations, and new AI-enabled cloud solutions that enhance radiology efficiency and clinical confidence.
Philips launched its new MR 7700 3.0T system, which features an enhanced gradient system designed to deliver outstanding imaging results and speed to support confident diagnosis for every patient.
Five top hospitals in Shanghai, with a total of more than 10,000 beds, installed Philips’ advanced Spectral CT 7500 imaging system, helping physicians deliver first-time-right diagnosis through fast, low-dose X-ray scans.
Philips further expanded its ultrasound portfolio with the launch of the Ultrasound Compact 5500 CV, which delivers cart-based premium image quality in ultrasound exams for cardiology and vascular patients at the bedside.
Philips IntraSight Mobile received approval from the Chinese regulatory authority, paving the way for its commercial introduction in the Chinese market. IntraSight Mobile combines imaging and physiology applications on a mobile system for peripheral and coronary artery disease therapy.
Philips expanded its image-guided therapy portfolio with the launch of Philips Zenition 10, which provides a cost-effective imaging solution to guide high-volume routine surgery, as well as complex orthopedic and trauma procedures. Philips also launched the Zenition 30 Image Guided Therapy Mobile C-arm. Its workflow-enhancing features and excellent image quality enable surgeons to deliver enhanced care to more patients, helping alleviate the staff shortages faced by many hospitals.
Through the WE-TRUST study, Philips is driving innovation in stroke treatment. The trial examines the impact of the direct-to-angio treatment pathway on clinical outcomes, facilitated by a helical scan in the angio suite developed by Philips to reduce time to treatment. With 16 leading stroke centers and hospitals around the world involved in the trial and 100 patients enrolled, the WE-TRUST study has already achieved the scale and momentum needed to deliver a reliable evidence base on the potential benefits of the Direct to Angio Suite pathway for patients suspected of having a large vessel occlusion (LVO) ischemic stroke – a treatment pathway that focuses squarely on addressing the fact that the faster a patient is treated, the more likely they are to recover. Another significant milestone was the publication of health economics analysis results in the Journal of NeuroInterventional Surgery, demonstrating that this new stroke care pathway can save over USD 3,000 per patient.
With technology constantly advancing and becoming increasingly pervasive in healthcare, the Connected Care businesses aim to connect and elevate care for all. Philips connects patients and caregivers across care settings, delivering clinical, operational and therapeutic solutions that help our customers deliver better health outcomes, improve the patient and staff experience, and lower the cost of care across care settings. In 2023, the global economic situation continued to put additional pressure on customer budgets and worsened trends such as staff shortages, as well as increasing the need for solutions that enable more effective, sustainable and convenient care in hospital, clinics and the home – especially enabled by strong informatics and AI.
The Sleep & Respiratory Care business in particular continued to face multiple operational and regulatory challenges in 2023, but action has been taken to improve the ability of the Sleep & Respiratory Care organization to correctly assess potential patient safety or quality issues. Philips has reaffirmed its core activities, which put patient safety front and center in everything we do, and we believe that the implementation of a new simplified organization, which for Sleep & Respiratory Care began in 2022, will help to achieve this, as well as to improve productivity and increase agility. In the course of the year, Sleep & Respiratory Care gradually returned to the market for sleep therapy devices outside the US. For information about the Respironics recall and related remediation effort, please refer to Quality & Regulatory and patient safety.
With clinical depth and discovery, Philips Connected Care technologies help to cultivate a more accurate and complete view of the patient that drives better health and care. The combination of advanced technological solutions and a co-creation approach allows Philips to be an effective partner to its customers in their digital transformation, both across the enterprise and at the level of the individual clinician, nurse and patient. We help our customers to unlock actionable insights from pools of medical imaging data, patient monitoring data, and through the use of advanced AI, to improve outcomes and drive productivity.
Philips’ open, interoperable platforms aggregate and leverage information from clinical devices, patient and historical data to support care providers in patient engagement, diagnostics, and patient monitoring in the hospital, ambulatory and home settings.
In 2023, the Connected Care segment consisted of the following businesses:
Connected Care
Total sales by business
| 2023 | |
|---|---|
| Monitoring | 60% |
| Sleep & Respiratory Care | 17% |
| Enterprise Informatics | 23% |
In most of the Connected Care businesses, revenue is earned through the sale of products and solutions, as well as services and software licenses. Where bundled offerings result in solutions for our customers, or offerings are based on the number of people being monitored, we see more usage-based earnings models. In the area of patient care management (Ambulatory Monitoring & Diagnostics business unit and Sleep & Respiratory Care business), revenue is generated through clinical services, product sales and through rental models, whereby revenue is generated over time.
Sales channels include a mix of a direct sales force, partly paired with an online sales portal and distributors (varying by product, market and price segment). Sales are mostly driven by a direct sales force with an intimate knowledge of clinical settings and patient-specific diagnosis and treatment. Philips collaborates with customers and partners to co-create solutions, drive commercial innovation and adapt to new models such as monitoring-as-a-service and software-as-a-service.
Sales at Philips’ Connected Care businesses are generally higher in the second half of the year, largely due to customer spending patterns. However, the Philips Respironics voluntary recall notification in the Sleep & Respiratory Care business in June 2021 (as further discussed in Quality & Regulatory and patient safety) continued to have a negative impact on sales throughout 2023.
At year-end 2023, Connected Care had 17,549 employees worldwide.
Philips signed a 10-year, EUR 100 million Enterprise Monitoring as a Service agreement with one of the largest health systems in the US, covering 20 hospitals with over 3,000 beds. The agreement provides the health system with constant access to the latest technology, including software and services, while lowering initial investments.
Philips and NYU Langone Health announced an 8-year strategic partnership valued up to USD 115 million and aimed at enhancing patient care through further innovation. The partnership includes digital pathology, clinical informatics, and innovative AI-enabled diagnostics, with an Enterprise Monitoring as a Service model. With these new technologies, NYU Langone clinicians can collaborate in real time, sharing pathology, imaging studies or patient data to support diagnostic confidence and tailor individualized care plans.
Highlighting the strength of its comprehensive patient monitoring offering, Philips announced a multi-year partnership with Northwell Health to standardize and centralize patient monitoring across the hospital, allowing caregivers to see what is happening at each bedside.
Philips announced new interoperability capabilities that offer a comprehensive view of patient health for improved monitoring and care coordination. This is realized through the interoperability of Philips Capsule Medical Device Information Platform (MDIP) with Philips Patient Information Center iX (PIC iX) with streaming, vendor-neutral data that supports care delivery and collaboration.
Philips introduced the cloud-based Philips HealthSuite Imaging PACS on Amazon Web Services. This cloud-based enterprise imaging solution, which includes advanced AI-enabled applications, has been designed to enhance image access speed, reliability, and data orchestration for clinicians across the imaging workflow, while reducing costs for healthcare organizations.
Philips launched its ambulatory monitoring offering in Japan, combining Philips ePatch Holter monitors with ECG analysis through AI and advanced algorithms. This innovative approach aims to reduce clinician workload and improve the patient experience.
Our Personal Health business plays an important role in enabling healthy individual care routines with technology and solutions that support people’s long-term health and well-being.
We aim to drive profitable growth through a focus on innovation across three key areas:
The Personal Health segment consists of the Personal Health business, which comprises the following business units:
Personal Health
Total sales by business
| 2023 | |
|---|---|
| Personal Health 1) | 100% |
Through our Personal Health business, we offer a broad range of solutions in various consumer price segments to support people in proactively managing their health and well-being. Depending on the market, we offer an additional portfolio of locally relevant innovations and adjust our range to increase accessibility. A notable aspect of our commercial strategy is driving increased direct-to-consumer relationships and sales through our consumer communities and online store. About half of our Personal Health sales worldwide now take place online.
We are leveraging connectivity to offer new business models, partnering with other players in the health ecosystem, e.g. insurance companies and healthcare professionals, with the goal of extending opportunities for people to live healthily and prevent or manage disease. We are engaging consumers in their health journey in new and impactful ways through social media and digital innovation.
In Personal Health, improving lives also means caring for the world, with a key focus on environmental sustainability. For example, in 2023 we launched an initiative in Germany, Philips Refurb Editions, to give products a second life, with the same two-year guarantee as a new product. This is part of Personal Health’s commitment to driving a more circular economy, and we believe we need to keep finding innovative ways to support consumers with greater choices to live sustainably.
We also offer mobile solutions to support parents and parents-to-be for a more informed, more connected and healthier journey to parenthood. The Pregnancy+ app and Baby+ app offer parents supportive content at every stage of their first 1,000-day journey. Pregnancy+ also offers state-of-the-art, photo-realistic and interactive 3D fetal models to make the experience even more exciting, with new, personalized content for each day of the pregnancy. The Philips Pregnancy+ app was ranked among the best pregnancy apps of 2023 by Forbes*). It has more than 1.5 million daily active users and is available in 22 languages.
The revenue model is mainly based on product sale at the point in time the products are delivered to retailers and online platforms. We continue to increase revenue model diversity by expanding our new business models, including direct-to-consumer, subscriptions, try-and-buy offerings and services.
The Personal Health business experiences seasonality, with higher sales around key national and international events and holidays.
At year-end 2023, Personal Health employed 9,085 people worldwide.
Philips successfully launched the Sonicare DiamondClean 7900 Series electric toothbrush in China on major online shopping channels Alibaba and JD.com. Highlighting increasing customer demand, it claimed the number-one position in the high-end toothbrush category on Alibaba’s Tmall.
In partnership with JD.com, Philips launched the premium 7 Series Shaver in China, debuting as the #1 shaver on this major online shopping channel. Additionally, Philips’ DiamondClean 9000 premium electric toothbrush has become the best-selling high-end oral healthcare product on Alibaba.
To improve oral care habits among children, Philips introduced Sonicare for Kids 'Design a Pet Edition' with an entry price point designed to give more parents access to an electric toothbrush for their children.
Philips OneBlade packaging was named the 2023 Red Dot Communication Design Best of the Best in recognition of its paper-based model, illustrating how the use of less material, fewer parts, and less volume can go hand in hand with iconic presence and the best user experience.
Philips launched its 'Better than New' campaign in Germany, repositioning refurbished innovations and underscoring the company's commitment to circularity and sustainability. The campaign led to a significant year-on-year increase in sales revenue of refurbished Lumea and refurbished shaving products.
Philips announced Babybell Maternal & Child Supplies as the exclusive distributor for Philips Avent OneFeeding in China; the partnership aims to accelerate growth of the Philips Avent brand in the Chinese maternal health industry. The partnership combines the power of Philips’ latest innovations with Babybell's rich understanding of the local market and robust retail network to deliver on a faster innovation pace and expand market share.
In our external reporting on Other we report on the items Innovation & Strategy, IP Royalties, Central costs, and other small items. At year-end 2023, 14,626 people worldwide were working in these areas.
At Philips, we have set up our innovation teams to be as close to our customers and consumers as possible. The majority of our Research & Development (R&D) experts work in one of our business units, which allows them to directly hear customer and consumer needs and work closely with other stakeholders to turn innovations into actual products. Innovation at Philips is organized to encourage innovation anywhere along the value chain and not just at the product ideation stage.
The remaining R&D experts are part of our central Innovation & Strategy organization. The main job of these experts is to focus on industry-shifting ideas that advance a core product to fulfill the needs of a broad new customer segment. Innovation & Strategy focuses on enabling and accelerating innovation across our business units in different ways:
Strategy supports the business units in shaping their strategy to create a competitive advantage. The Enterprise Strategy team focuses on overall corporate strategy, and the Market Analysis & Forecasting team analyzes customer segments and market growth trends. Strategy also partners closely with the Mergers & Acquisitions and Finance teams to ensure our M&A activity is aligned with the business units and our enterprise strategic direction.
Research helps to define the future of healthcare by unlocking opportunities that have the potential to disrupt the healthcare industry. Breakthrough Innovation Teams (BRITE) and Exploratory Innovations Teams (XITE) are two ways Philips nurtures long-term ‘big bets’ in innovation and enables the growth of an overarching entrepreneurial mindset across all of Philips.
Experience Design plays an important role in making sure that the voice of the customer is heard and included in innovation. This means linking product development from inception with a patient and consumer view and ensuring that the highest product and experience performance requirements are embedded throughout all innovation projects. In 2023, the Philips brand won 160 awards for design excellence.
Innovation Engineering teams bring innovations to life by providing Philips business units with a central team of experienced, talented individuals with capabilities in software, hardware engineering, and AI. Innovation Engineering teams also enable business units to scale through shared platforms.
Innovation Excellence helps our business units to be the best they can in innovation by offering them an outside-in view and developing competencies, processes, data and tools they need to excel at innovation.
Innovation Effectiveness teams help to measure the return on innovation investments and guide enterprise-wide innovation initiatives.
Innovation & Strategy works from four main innovation sites – Eindhoven (Netherlands), Cambridge (USA), Bangalore (India) and Shanghai (China) – and smaller innovation and research sites in the Regions. Our global footprint enables us to understand, anticipate and react to local markets and needs.
Philips Intellectual Property & Standards (IP&S) proactively pursues the creation of new Intellectual Property (IP) in close co-operation with Philips’ operating businesses and Innovation & Strategy. IP&S is a leading industrial IP organization providing world-class IP solutions to Philips’ businesses to support their growth, competitiveness and profitability.
Royal Philips’ IP portfolio currently consists of approximately 53,000 patent rights, 31,500 trademarks, 135,000 design rights and 3,300 domain names. Philips filed 795 new patents in 2023, with a strong focus on the growth areas in health technology services and solutions.
Philips earns substantial annual income from license fees and royalties.
Philips believes its business as a whole is not materially dependent on any particular third-party patent or license, or any particular group of third-party patents and licenses.
We recharge the directly attributable part of the functional costs to the businesses. The remaining part is accounted for as 'central costs', and includes costs related to the Executive Committee and Group Functions such as Strategy, Legal and Audit fees.
Other small items refer to remaining items for intra-group services and legacy items relating to previously disposed businesses.
Geographically, our business is organized in three Regions: North America, Greater China and International Region (the latter made up of Europe and Growth groupings). Within our Regions, we further organize the business by Zones and Countries. Their primary accountability is to manage customer intimacy, relationships and understanding of their needs, (strategic) account management, service delivery, and indirect partner management. They are also accountable for government relations, local infrastructure needed to support Philips’ presence in a country (license to operate) and for statutory, fiscal & compliance duties, safety, sustainability and labor relations to secure compliant operations in the Region/Zone/Country.
For financial reporting purposes, we recognize four geographic areas: Western Europe, North America, Other mature geographies, and Growth geographies. Western Europe, North America and Other mature geographies are collectively recognized as Mature geographies in reporting on sales. This reflects the grouping of countries based on similar economic characteristics.
Leading health systems such as Northwell, TriHealth, and Atrium Health, have extended their long-term strategic partnerships (LSPs) with Philips to include enterprise informatics and precision diagnostics. In Canada, eHealth Saskatchewan elected to extend their enterprise informatics relationship with Philips, reinforcing the value of the partnership to clinicians and patients across the province.
The Enterprise Monitoring as a Service model (EMaaS) also drove innovation, giving health systems like NYU Langone Health, the University of California Irvine and Children’s Hospital of Orange County a predictable, scalable business model that enables them to standardize their patient monitoring platform across the enterprise. In addition to adopting EMaaS for their monitoring solutions, NYU Langone Health is also partnering with Philips to advance patient safety, quality and improve patient outcomes through digital innovation, including integrating patient data across the network, AI-enabled diagnostic imaging and digital pathology for precision diagnosis and treatment.
Philips Sonicare remains the leading electric rechargeable toothbrush in the United States and Canada, as well as the most-recommended rechargeable toothbrush brand in the United States. Additionally, Philips Norelco remains the leading electric male grooming brand in the US and Canada, reaching the next generation of young men with our One Blade multi-purpose shaver.
Philips continues to lead the way with innovation in its efforts to help address health disparities and maternal health access specifically – partnering with the state of Michigan to tailor the Philips Avent Pregnancy+ app, making it easier for moms within the state to find resources available to them, such as home-visiting nurses. During the first year, Pregnancy+ reached over 32,000 Michigan families, helping them get access to vital resources. The app was recognized by Forbes as the best pregnancy app of 2023. Forbes also recognized Philips for its Inclusion & Diversity efforts in North America, naming the company among the Best Employers for Diversity and Best Employers for Women for the second year in a row.
In 2023, we continued to deliver on our commitment to support China’s national health strategy, supplying hospitals with tailor-made solutions for their clinical and research needs, and empowering consumers to manage their health and well-being.
With the aim of better serving the Chinese market, we are committed to our ‘In China, For China’ strategy, which focuses on local innovation, manufacturing, services and partnership. We continue to drive ‘made in China’ fulfillment and create more locally relevant solutions by leveraging local ecosystems to serve both professional and consumer markets.
In the professional market, we have expanded our cooperation with local customers by providing cutting-edge imaging systems, informatics solutions and other products in support of delivering better care to patients in terms of precision diagnosis, interventional treatment, and smart hospital development. Key customers include many top hospitals: Huaxi Hospital in Sichuan Province, Renji Hospital, Xinhua Hospital, the Sixth People's Hospital, the 10th People's Hospital and Children’s Hospital in Shanghai, Jishuitan Hospital and Anzhen Hospital in Beijing, the First Affiliated Hospital of Dalian Medical University, the First Affiliated Hospital of Zhengzhou University, and Regional Imaging Center of Jiangxi Province, to name just a few.
In the consumer market, in line with our consistent ‘Professional, Young and Premium’ positioning, Philips’ brand strength increased in 2023, despite an overall weak consumer market. We leveraged new online and offline channels, including Healthy Living Lab, TikTok, O2O instant retail platforms like Meituan, JD to home, and Ele.me to engage with young consumers and grow business. Local innovation drove significant growth in Male Grooming and Oral Healthcare, which continue to solidify their leadership positions in China. Philips was recognized as a ‘gold brand’ (most favored consumer brand) in the Personal Health category for the fourth consecutive year by China Business Weekly.
2023 marked the 100th anniversary of Philips in China. This achievement stands as a testament to Philips’ commitment and dedication to improving people’s lives through meaningful innovation and fostering strong partnerships in China.
In International Region we strive to execute on a shared global vision whilst meeting the unique local needs and circumstances of our customers. Our goal is to elevate customer relationships and move from being a trusted supplier of equipment, services and software to a transformational partner directly contributing to our customers’ long-term success. To support this vision we have made great progress on leveling up our go-to-market model, developing scalable solutions and software, expanding fit-for-future capabilities, reinvesting revenue to enable new business models, and establishing new partnerships.
In International Region, our Personal Health business plays an important role in enabling healthy individual care routines with technology and solutions that support people’s long-term health and well-being.
Philips entered into many new customer partnerships in 2023, including the following:
Patients at Martini Hospital were the first in the Netherlands to use Philips' ePatch wearable sensor to diagnose cardiac arrhythmias. The hospital uses the sensor and Cardiologs software to detect atrial fibrillation after patients have had a stroke. The patch is designed to replace traditional Holter monitors, which are more cumbersome and can only be worn for a day. The new sensor is expected to improve detection of heart rhythm disorders and provide more personalized care, as well as reducing workload and lowering costs.
Philips and Gibraltar Health Authority announced a 16-year strategic partnership to transform patient imaging and cardiac care for local patients. The partnership will provide local coronary angiography and angioplasty services in a new interventional cardiac suite equipped with the latest diagnostic technology. The announcement represents a major reform in service delivery, improving the region’s access to life-saving interventions while reducing environmental impact, with patients no longer needing to travel abroad for treatment.
Developed by Dr David Tscholl and Dr Christoph Nöthiger, consulting anesthesiologists at University Hospital Zurich, the Visual Patient Avatar is a new approach to patient monitoring: patient data is translated into a simple visual design, reducing the time needed in the operating room to check and interpret vital signs. Together with Philips, this idea was further developed into a commercial solution that is now being implemented at University Hospital Bonn, the first hospital in Europe to use this type of display for faster decision support.
Philips is partnering with Assistance Publique-Hôpitaux de Paris, Hôpitaux Civils de Lyon and Incepto (a PACS AI application platform) to make Artificial Intelligence more accessible to radiologists. Philips has also joined forces with Hôpital Saint-Joseph (Paris) and Hôpital Marie-Lannelongue (Hauts-de-Seine) to improve personalized cancer care by integrating digital pathology into the imaging workflow. And Philips has opened its new healthcare innovation center, Health Innovation Paris (HIP).
Philips' innovative technologies feature across the Polish hospital network. In 2023, the first Incisive CT scanner in Central & Eastern Europe was installed to diagnose patients with cardiac disease at a private cardiology network. In addition, a state-of-the-art hybrid room was created at the University Hospital in Bydgoszcz. Longstanding cooperation with the American Heart of Poland has resulted in further contracts, including the installation of a monitoring network.
Philips and Norwegian Vestre Viken Health Trust deployed AI-enabled clinical care to help radiologists improve patient care. The large-scale deployment provides access to an AI-based bone fracture radiology application that will serve the needs of around half a million people across 22 Norwegian municipalities.
Philips Japan officially launched the Turbo-Power laser atherectomy catheter, which debulks lesions in a single step and offers remote automatic rotation for precise directional control – a powerful tool for the treatment of peripheral vascular diseases. The Philips MR7700 3.0T imaging system with SmartSpeed AI was installed for the first time in Japan, at Hamamatsu University Hospital. The MR7700 achieves high image quality, while SmartSpeed utilizes the Compressed SENSE speed engine to reduce scan time.
Philips launched the Spectral CT 7500 imaging system with an event for the top 100 radiologists in India. This system performs low-dose scans without compromising speed, power or field of view. We also received an order for 28 Philips Incisive CT systems from a single state. This system combines operator and design efficiencies to improve patient and staff experience and support clinical decision-making. Philips Innovation Campus opened its new site in Bengaluru, home to over 5,000 engineers, scientists, business developers, and clinical experts.
In Australia, Philips signed a 7-year partnership agreement with the Queensland Government and Cairns and Hinterland Hospital and Health Service (CHHHS) to provide a turnkey solution including Vue PACS, Reporting & VNA Philips Software, and Infrastructure as a Service (IaaS) across a remote and large geography. The Philips solution will enable clinicians to access a complete imaging health record of their patients and provide a platform for the integration of all image data across the CHHHS enterprise, greatly enhancing the radiology workflow.
Demonstrating our commitment to high-quality, sustainable healthcare, Philips undertook multiple initiatives to expand helium-free MR operations in Brazil. Besides Brazil, this expansion reached Mexico, Panama, Puerto Rico, Colombia, Chile, Argentina and Ecuador, making a significant mark on the region's healthcare landscape. We are also working to localize the production of BlueSeal MRI magnets in Brazil. Other notable ventures included the Brazilian Company of Hospital Services (EBSERH) installing 14 Incisive CT imaging systems at Federal University Hospitals.
In Turkey, Philips has supplied high-grade medical equipment to the new Gaziantep City Hospital. The public city hospital complex, with 1,875 new beds, will serve Gaziantep and surrounding cities, adding much-needed healthcare capacity to the region, which was hit by a devastating earthquake in February 2023.
As part of a deal with Egypt’s Ministry of Health, Philips unveiled the first Mobile MRI Truck for the Middle East, Turkey & Africa region, to enhance healthcare delivery in remote, difficult-to-access and underserved locations. In just 3 months after implementation, more than 1,100 patients across Egypt had already benefited from this initiative.
In Kazakhstan, Philips provided advanced medical equipment to the National Coordination Center for Emergency HealthCare in Astana and the Hematology and Cardiology Center in Ust-Kamenogorsk. Both are multi-modality projects and have a high social importance, as the Emergency Center will be the flagship center for the National Stroke Program in Kazakhstan, and the Hematology and Cardiology Canter treats patients with serous blood diseases.
Philips runs an Integrated Supply Chain (ISC), which encompasses supplier selection and management through procurement, manufacturing across all the industrial sites, logistics and warehousing operations, customer installation, as well as demand/supply orchestration.
When selecting and evaluating partners, we consider not only business metrics such as quality, on-time delivery performance and cost, but also environmental, social and governance factors. We use supplier classification models to identify critical suppliers, including those supplying materials, components and services that could influence the safety and performance of our products and solutions.
The Philips Supplier Quality Manual outlines Philips’ quality, regulatory, product, process and customer requirements. The standards outlined in this manual underpin agreements between suppliers and Philips, and guide compliance with Philips’ quality standards.
As part of our plan to create value with sustainable impact, the supply chain plays an important role in improving our performance and delivering to our customers and consumers as promised. In 2023, we initiated multiple interventions and have longer-term programs planned to improve our execution capabilities and become more resilient in navigating volatility.
In 2023, we focused on restoring the stability and reliability of our supply chain, including safeguarding material flows and de-risking in a sustainable manner. For example, we accelerated the redesign of printed circuit board assemblies (PCBAs) to replace older e-components with more modern and widely available e-components. We also reduced our purchases of high-risk parts by applying our supplier risk management framework, which assesses suppliers for factors such as strategic fit, financial stability, operational performance, quality, sustainability, compliance and location. We aim to maintain close relationships with our suppliers and conduct an ongoing dialogue with respect to our forecast.
Over the past year, we have re-aligned our end-to-end supply chain organization, with dedicated teams by Business and Region allowing us to tailor to specific challenges and implement solutions that address different customer and consumer needs. Whereas Philips’ supply chain historically delivered efficiencies through a functional orientation, the new operating model has sped up decision-making and better supports the businesses in achieving their short-, mid- and long-term goals.
Under the new set-up, initial investments have been made to improve our end-to-end visibility and planning tools by digitizing our priority information flows.
We continue to deploy our strategy for a more regional vs global approach to our end-to-end network design, taking into account factors such as customer proximity, leveraging manufacturing capabilities, our environmental footprint, and efficiency. We are using our multi-modality sites, in combination with contract manufacturing partners, to regionally ‘multi-source’ many of our products. This is intended to increase the resilience of our supply chain to manage future, unplanned disruptions and to ensure access to public healthcare investment where ‘local’ requirements exist in our largest markets.
Like the rest of the industry, we remain exposed to continued geopolitical tensions around the world. Labor costs remain a concern due to the persistent inflation in 2023 and show an upward trend entering 2024. On the other hand, overall macroeconomics show improved availability of materials. As a result, the cost of raw materials and energy, as well as inflation, show a downward trend compared to 2022. We believe that our interventions, in combination with the improvement in macroeconomic trends, put us on the right track in our journey to build a reliable, predictable and efficient supply chain.
Philips Group
Supplier spend analysis per geographic area
in %
| 2023 | |
|---|---|
| Western Europe | 31% |
| North America | 34% |
| Other mature geographies | 6% |
| Mature geographies | 72% |
| Growth geographies | 28% |
| Philips Group | 100% |
Philips is present in 75 countries globally and has its corporate headquarters in Amsterdam, Netherlands. Our real estate locations are spread around the globe, with key manufacturing and R&D sites in Europe, the Americas and Asia.
In 2023, we consolidated five different R&D locations into a new R&D Hub in Bangalore, India, which will host some 5,000 employees. We continued our right-sizing program through our Future of Work concepts to support hybrid working. The project to move Philips’ headquarters to a new location in Amsterdam in 2025 is progressing as planned.
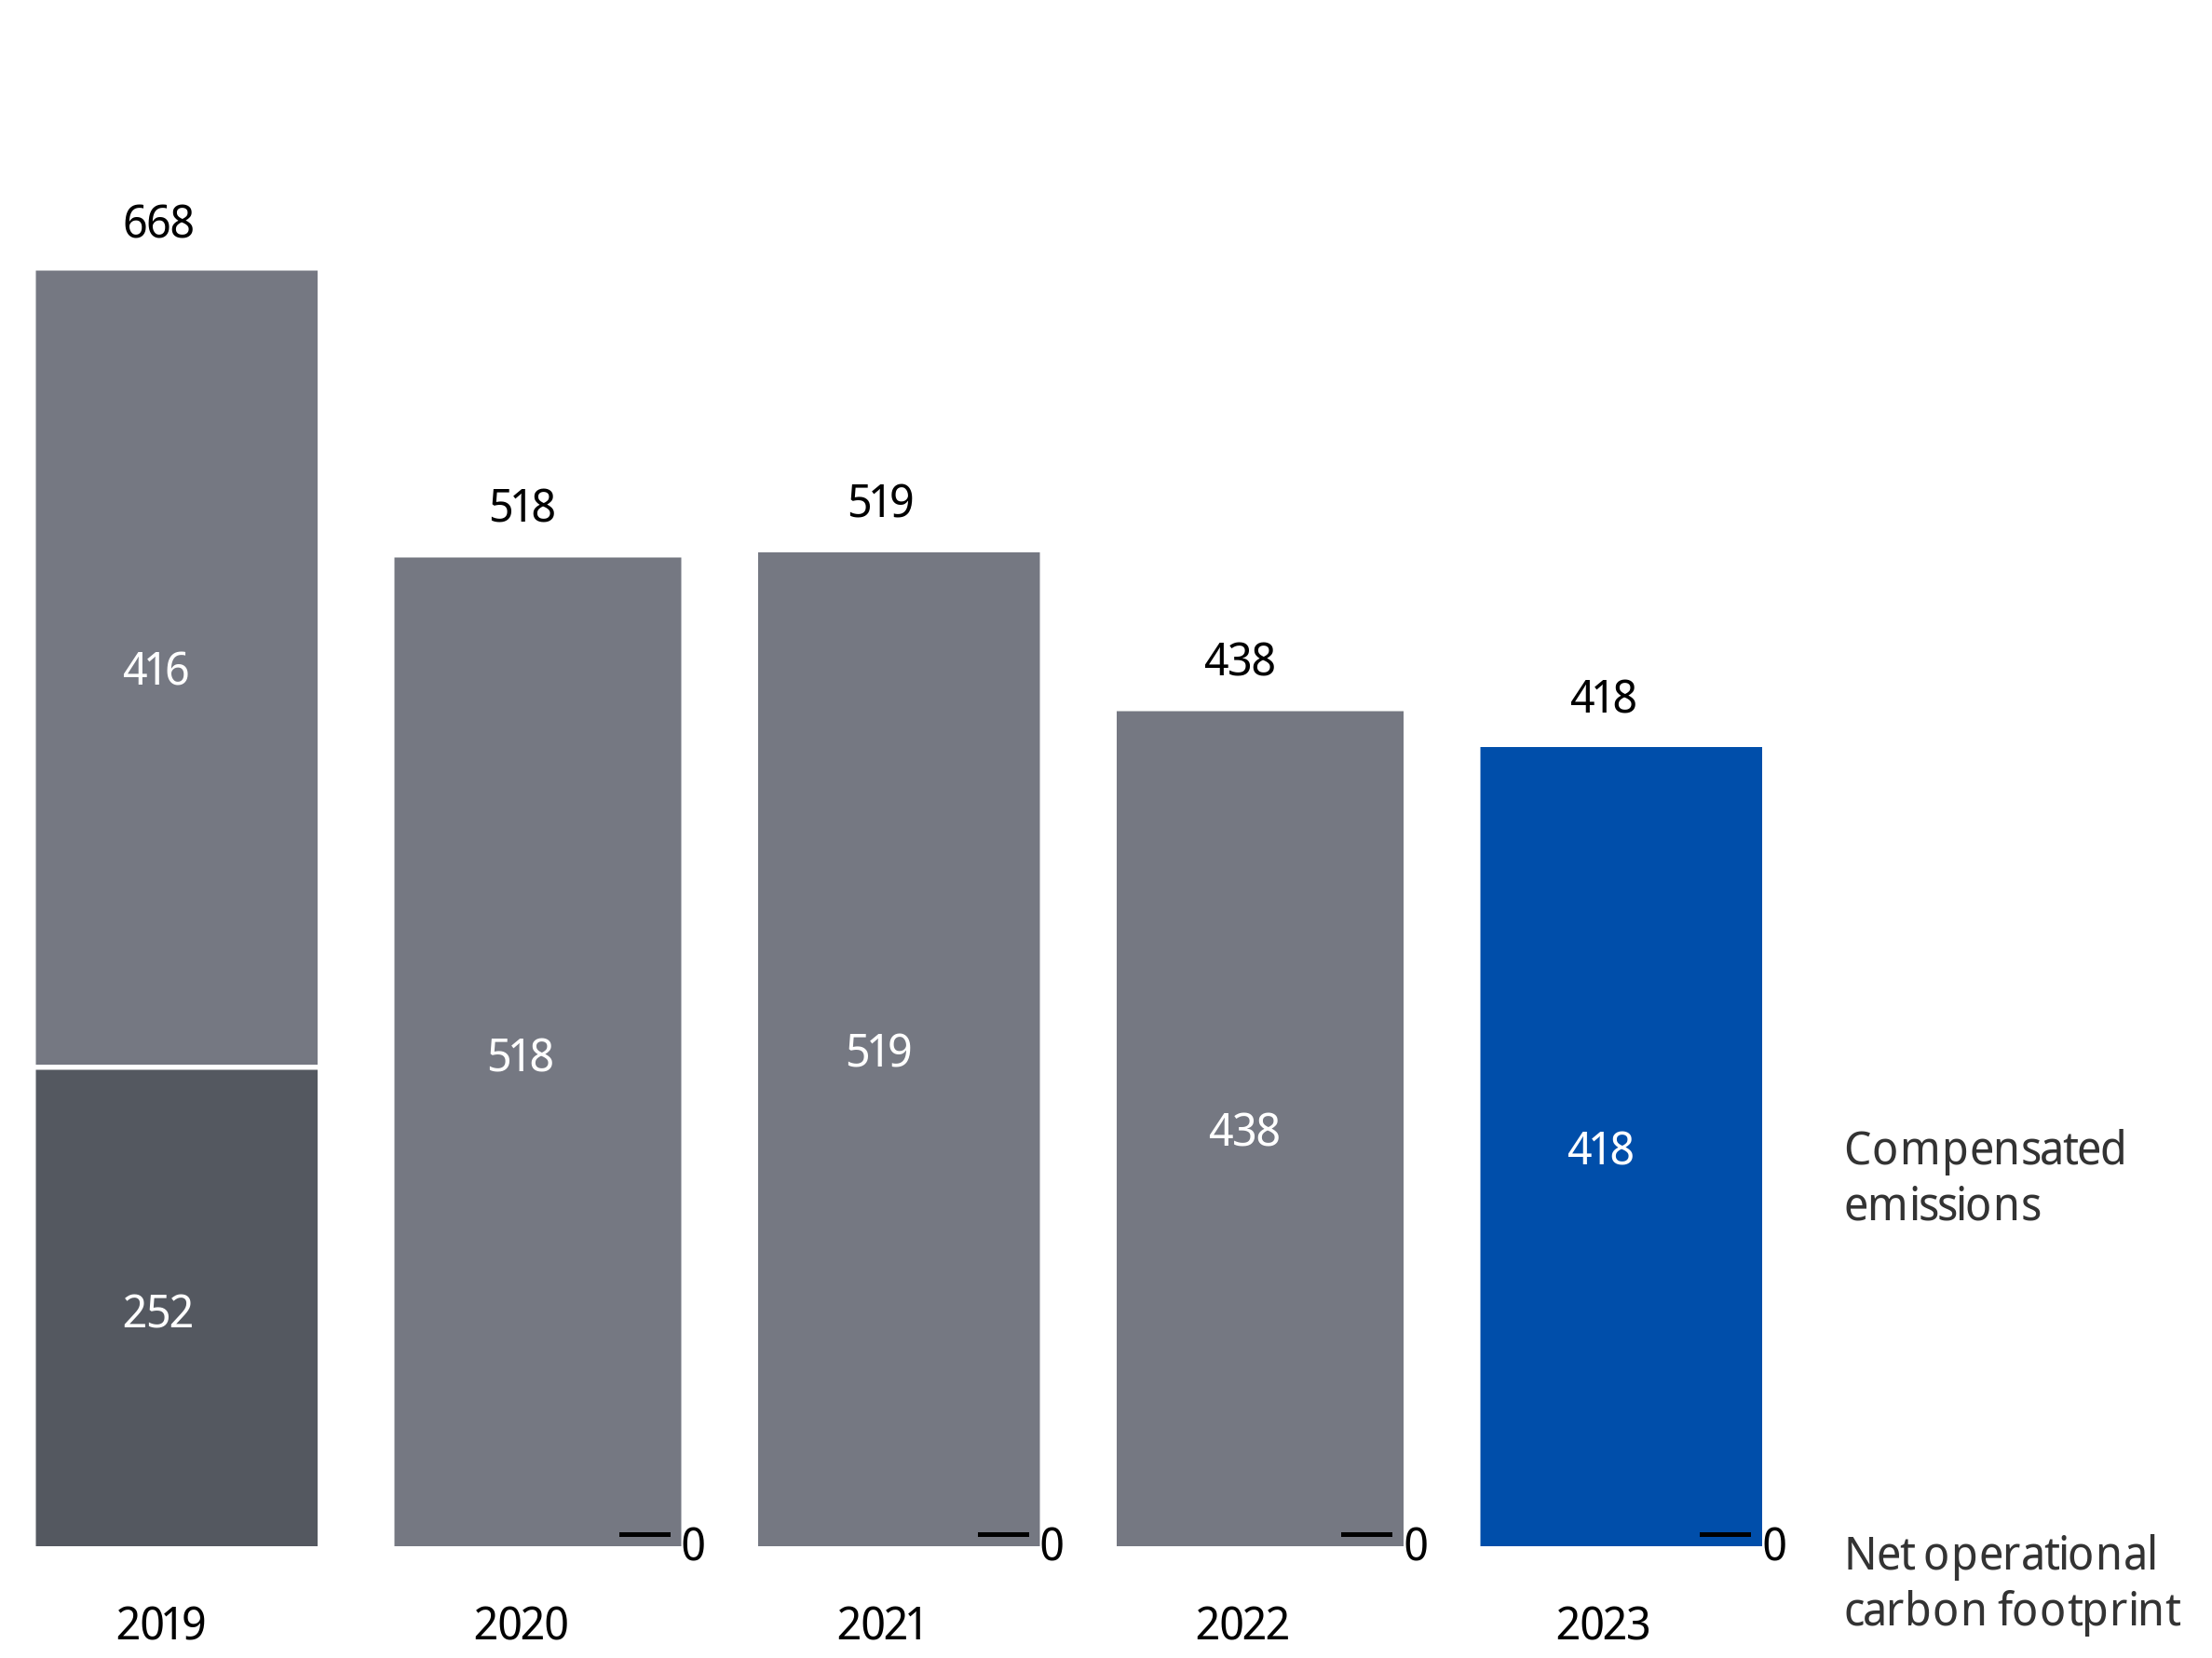
We also continue to optimize our real estate portfolio in line with our Environmental ESG commitments towards 2025. Having met our goal of bringing our site-related CO₂ emissions under 35 kilotons per year in 2020, we further reduced our CO₂ emissions to 22 kilotons in 2023. In addition, we reached 78% renewable energy in 2023, already exceeding our target of 75% by 2025. Energy consumption decreased by 7.8% compared to 2022.
Over 75% of our locations are leased properties, and we manage vacancy closely to ensure the right level of space efficiency and flexibility to support our business dynamic. Our current facilities are adequate to meet the requirements of our present and foreseeable future operations. As expected, occupancy rates in our offices continued to stabilize in the first half of 2023. We continue to evaluate options to right-size our office footprint, to further adopt task-based working principles, and to cater for meaningful presence in inspiring layout and workplace solutions. The net book value of our land and buildings as of December 31, 2023, represented EUR 1,282 million; construction in progress represented EUR 32 million.

Group sales increased 6% on a comparable basis*) to EUR 18.2 billion in 2023
Income from operations was a loss of EUR 115 million, compared to a loss of EUR 1,529 million in 2022
Adjusted EBITA**)Non-IFRS financial measure. For the definition and reconciliation of the most directly comparable IFRS measure, refer to Reconciliation of non-IFRS information.) increased to EUR 1,921 million, or 10.6% of sales, compared to EUR 1,318 million, or 7.4% of sales, in 2022
Operating cash flow improved to EUR 2,136 million, compared to an outflow of EUR 173 million in 2022
Philips Group
Key data
in millions of EUR unless otherwise stated
| 2021 | 2022 | 2023 | |
|---|---|---|---|
| Sales | 17,156 | 17,827 | 18,169 |
| Nominal sales growth | (0.9)% | 3.9% | 1.9% |
| Comparable sales growth1) | (1.2)% | (2.8)% | 6.0% |
| Impairment of goodwill | (15) | (1,357) | (8) |
| Income from operations | 553 | (1,529) | (115) |
| as a % of sales | 3.2% | (8.6)% | (0.6)% |
| Financial expenses, net | (39) | (200) | (314) |
| Investments in associates, net of income taxes | (4) | (2) | (98) |
| Income tax (expense) benefit | 103 | 113 | 73 |
| Income from continuing operations | 612 | (1,618) | (454) |
| Discontinued operations, net of income taxes | 2,711 | 13 | (10) |
| Net income | 3,323 | (1,605) | (463) |
| Adjusted EBITA1) | 2,054 | 1,318 | 1,921 |
| as a % of sales | 12.0% | 7.4% | 10.6% |
| Income from continuing operations attributable to shareholders2) per common share (in EUR) - diluted | 0.64 | (1.76) | (0.50) |
| Adjusted income from continuing operations attributable to shareholders2) per common share (in EUR) - diluted1) | 1.58 | 0.92 | 1.25 |
The introduction of a simplified operating model, workforce reduction, an improved global supply chain, and the geopolitical environment contributed to the company’s business and results in 2023. Where relevant, the impact of these factors and the resulting uncertainties on the company’s results, balance sheet and cash flows have been considered and are reflected in amounts reported.
In 2023, global economic growth is estimated to have slowed compared to 2022, marked by easing price pressures and supply chain stress while major central banks were tightening their respective monetary policies. Global real GDP is estimated to have grown by 2.7% in 2023, compared with 3.1% in 2022. On the consumer side, households were dipping into their savings accumulated during the COVID period to maintain their spending levels and to cushion against the inflation surge since late 2021. However, consumer spending momentum is not expected to sustain due to the depletion of savings and expected labor market softening because of tighter financial conditions. The delayed effect of higher benchmark interest rates is expected to manifest further in 2024, leading to a further slowdown in global economic growth. Oxford Economics expects world real GDP growth of 2.3% in 2024.
On January 30, 2023, Philips announced its plan to create value with sustainable impact, which is based on focused organic growth to deliver patient- and people-driven innovation at scale, with improved execution as a key value driver, prioritizing patient safety and quality, supply chain reliability and a simplified operating model. The simplified operating model aims to simplify the organization to increase agility and structurally lower the cost base by giving end-to-end accountability to the segments. Operating model productivity savings, procurement savings and other productivity programs contributed positively to the results of operations.
In addition to the reduction of its workforce by 4,000 roles announced in October 2022, in 2023 Philips announced plans to reduce its workforce by an additional 6,000 roles globally by 2025, in line with relevant local regulations and processes. These reductions are focused on Corporate and Functions optimization and non-core activities, and amounted to approximately 8,000 roles by year-end 2023. Workforce-related restructuring charges were EUR 196 million in 2023 and EUR 136 million in 2022.
In 2023, following significant actions to increase supply chain resilience and mitigate the impact of disruptions, our sales benefited from improved material availability and resolved shortages in components.
Limited availability and delays in the supply of certain components and products internationally – partly a consequence of the COVID pandemic and the Russia-Ukraine war – impacted our results in 2022. In addition, the supply chain constraints resulted in an increase in overall working capital, in particular inventories.
Having substantially reduced our operations in Russia in 2022, the remaining activities were focused on the delivery of medical systems, devices, and spare parts to healthcare providers. In 2023, increased sanctions and export controls led to a further reduction in sales activity. Philips’ operations in Russia and Ukraine on a combined basis represented less than 2% of group sales in both 2022 and 2023. The asset value of the activities in Russia and Ukraine, mainly working capital, was less than 1% of the consolidated total assets as of December 31, 2022 and 2023. The Russia-Ukraine war continues to put pressure on the global commodity landscape and supply chains, and contribute to higher levels of cost inflation.
The company’s global operations are exposed to geopolitical and macroeconomic changes (refer to Risk management and internal control framework ). The current situation in the Middle East further increases economic and political uncertainty. Philips is present in Israel with several subsidiaries, mainly in Diagnosis & Treatment and Connected Care, that are primarily involved in manufacturing and research and development activities.
In preparing the consolidated financial statements, management has considered the impact of climate change, specifically the financial impact of Philips meeting its internal and external climate-related aims, the potential impact of climate-related risks, and the costs incurred to pro-actively manage such risks. These considerations did not have a material impact on the financial reporting judgments, estimates or assumptions. The financial impacts considered include specific climate mitigation measures, such as the use of lower-carbon energy sources, the cost of developing more sustainable product offerings, and expenses incurred to mitigate against the impact of extreme weather conditions. To meet its long-term Science Based Targets and reduce its full value chain emissions in line with a 1.5°C global warming scenario, Philips has entered into a number of power purchase agreements.
The composition of sales growth in percentage terms in 2023, compared to 2022 and 2021, is presented in the following table.
Philips Group
Sales
in millions of EUR unless otherwise stated
| 2021 | 2022 | 2023 | |
|---|---|---|---|
| Diagnosis & Treatment | 7,825 | 8,290 | 8,818 |
| Nominal sales growth | 5.9% | 5.9% | 6.4% |
| Comparable sales growth1) | 8.3% | (0.8)% | 11.1% |
| Connected Care | 5,371 | 5,268 | 5,138 |
| Nominal sales growth | (14.9)% | (1.9)% | (2.5)% |
| Comparable sales growth1) | (19.0)% | (9.1)% | 1.1% |
| Personal Health | 3,429 | 3,626 | 3,602 |
| Nominal sales growth | 7.2% | 5.7% | (0.7)% |
| Comparable sales growth1) | 8.8% | 0.1% | 3.2% |
| Other | 530 | 643 | 612 |
| Philips Group | 17,156 | 17,827 | 18,169 |
| Nominal sales growth | (0.9)% | 3.9% | 1.9% |
| Comparable sales growth1) | (1.2)% | (2.8)% | 6.0% |
Group sales in 2023 amounted to EUR 18,169 million, 1.9% higher than in 2022 on a nominal basis. Considering a 4.1% negative currency effect and consolidation impact, comparable sales growth*) was 6.0%. The negative currency effect was mainly due to depreciation of currencies against the euro, and affected all segments. In addition, provisions charged to sales of EUR 174 million, mainly in connection with the proposed Respironics consent decree, had a negative impact of 1%.
Comparable order intake decreased 5% in 2023, compared to a 3% decline in 2022. The order book (which covers around 40% of Group sales) remains strong, and we are taking the necessary actions to improve order intake by shortening lead times from order to delivery and building on the positive impact we are making with our innovations, for example in predictive data analytics and artificial intelligence across our portfolio, to help improve the quality and efficiency of care delivery. The order book remains strong and is expected to continue to support growth.
In 2023, sales amounted to EUR 8,818 million, 6.4% higher than in 2022 on a nominal basis. Considering a 4.7% negative currency effect and consolidation impact, comparable sales*) increased by 11.1%. This was due to double-digit growth in Ultrasound and Image-Guided Therapy and high-single-digit growth in Diagnostic Imaging, due to supply chain improvements.
In 2023, sales amounted to EUR 5,138 million, 2.5% lower than in 2022 on a nominal basis. Considering a 3.6% negative currency effect and consolidation impact, comparable sales*) increased by 1.1%. This growth was mainly driven by double-digit growth in Monitoring, partly offset by a decline in Sleep & Respiratory Care due to the consequences of the Respironics recall. In addition, sales were impacted by provisions charged to sales of EUR 174 million, mainly in connection with the proposed Respironics consent decree, which had a negative impact of 3.4%.
In 2023, sales amounted to EUR 3,602 million, 0.7% lower than in 2022 on a nominal basis. Considering a 3.9% negative currency effect and consolidation impact, comparable sales*) increased by 3.2%. This was mainly driven by high-single-digit growth in Personal Care, partly offset by a decline in Oral Healthcare.
In 2023, sales amounted to EUR 612 million, compared to EUR 643 million in 2022. The decrease was mainly due to the discontinuation of innovation consultancy activities provided to other companies until 2023.
Philips Group
Sales by geographic area
in millions of EUR unless otherwise stated
| 2021 | 2022 | 2023 | |
|---|---|---|---|
| Western Europe | 3,645 | 3,603 | 3,819 |
| North America | 6,781 | 7,588 | 7,562 |
| Other mature geographies | 1,694 | 1,643 | 1,626 |
| Mature geographies | 12,120 | 12,833 | 13,007 |
| Nominal sales growth | (2)% | 6% | 1% |
| Comparable sales growth1) | (3)% | (1)% | 4% |
| Growth geographies | 5,036 | 4,993 | 5,162 |
| Nominal sales growth | 1% | (1)% | 3% |
| Comparable sales growth1) | 3% | (7)% | 10% |
| Philips Group | 17,156 | 17,827 | 18,169 |
| Nominal sales growth | (0.9)% | 3.9% | 1.9% |
| Comparable sales growth1) | (1.2)% | (2.8)% | 6.0% |
Sales in Mature geographies in 2023 were 1% higher than in 2022 on a nominal basis and 4% higher on a comparable basis*). Sales in Western Europe were 6% higher year-on-year on a nominal basis and 7% higher on a comparable basis*), with double-digit growth in the Diagnosis & Treatment segment, mid-single-digit growth in the Personal Health segment, and low-single-digit decline in the Connected Care segment. Sales in North America were flat year-on-year on a nominal basis and 3% higher on a comparable basis*), as high-single-digit growth in the Diagnosis & Treatment segment was offset by a low-single-digit decline in the Personal Health segment. Sales in Other mature geographies decreased by 1% on a nominal basis and increased by 7% on a comparable basis*), with high-single-digit comparable sales growth*) in the Connected Care segment and mid-single-digit growth in the Diagnosis & Treatment and Personal Health segments.
Sales in Growth geographies in 2023 increased by 3% on a nominal basis and 10% on a comparable basis*), with double-digit growth in the Diagnosis & Treatment and Connected Care segments and low-single-digit growth in the Personal Health segment. The double-digit growth in comparable sales growth*) was driven by China, Middle East & Turkey and Latin America.
Diagnosis & Treatment
Sales by geographic area
in millions of EUR unless otherwise stated
| 2021 | 2022 | 2023 | |
|---|---|---|---|
| Western Europe | 1,553 | 1,521 | 1,743 |
| North America | 2,664 | 3,019 | 3,172 |
| Other mature geographies | 805 | 782 | 766 |
| Mature geographies | 5,022 | 5,322 | 5,681 |
| Growth geographies | 2,803 | 2,968 | 3,137 |
| Sales | 7,825 | 8,290 | 8,818 |
| Nominal sales growth | 6% | 6% | 6% |
| Comparable sales growth1) | 8% | (1)% | 11% |
Sales in Growth geographies increased by 6% on a nominal basis in 2023, and on a comparable basis*) showed double-digit growth, which was mainly driven by China and Middle East & Turkey. Sales in Mature geographies increased by 7% on a nominal basis and showed double-digit growth on a comparable basis*), which was driven by double-digit growth in Western Europe and high-single-digit growth in North America.
Connected Care
Sales by geographic area
in millions of EUR unless otherwise stated
| 2021 | 2022 | 2023 | |
|---|---|---|---|
| Western Europe | 949 | 828 | 798 |
| North America | 3,019 | 3,227 | 3,132 |
| Other mature geographies | 649 | 587 | 573 |
| Mature geographies | 4,618 | 4,642 | 4,503 |
| Growth geographies | 753 | 626 | 635 |
| Sales | 5,371 | 5,268 | 5,138 |
| Nominal sales growth | (15)% | (2)% | (2)% |
| Comparable sales growth1) | (19)% | (9)% | 1% |
Sales in Growth geographies increased by 1% on a nominal basis in 2023, and on a comparable basis*) grew 7%, which was driven by Latin America and China. Sales in Mature geographies decreased by 3% on a nominal basis and were flat year-on-year on a comparable basis*), as growth in Other mature geographies was offset by Western Europe. In addition, provisions charged to sales of EUR 174 million, mainly in connection with the proposed Respironics consent decree, had a negative impact of 3.4%.
Personal Health
Sales by geographic area
in millions of EUR unless otherwise stated
| 2021 | 2022 | 2023 | |
|---|---|---|---|
| Western Europe | 894 | 902 | 961 |
| North America | 939 | 1,209 | 1,144 |
| Other mature geographies | 198 | 211 | 207 |
| Mature geographies | 2,032 | 2,322 | 2,312 |
| Growth geographies | 1,398 | 1,304 | 1,290 |
| Sales | 3,429 | 3,626 | 3,602 |
| Nominal sales growth | 7% | 6% | (1)% |
| Comparable sales growth1) | 9% | 0% | 3% |
Sales in Growth geographies decreased by 1% on a nominal basis in 2023, and on a comparable basis*) showed mid-single-digit growth, which was mainly driven by Middle-East & Turkey and China, partly offset by a decline in Russia & Central Asia. Sales in Mature geographies were flat on a nominal basis, and on a comparable basis*) showed low-single-digit growth, driven by Western Europe.
Philips Group
Cost of sales components
in millions of EUR unless otherwise stated
| 2021 | as a % of sales | 2022 | as a % of sales | 2023 | as a % of sales | |
|---|---|---|---|---|---|---|
| Costs of materials used | 4,142 | 24.1% | 4,320 | 24.2% | 4,626 | 25.5% |
| Salaries and wages | 2,245 | 13.1% | 2,462 | 13.8% | 2,381 | 13.1% |
| Depreciation and amortization | 479 | 2.8% | 535 | 3.0% | 461 | 2.5% |
| Other manufacturing costs | 3,123 | 18.2% | 3,316 | 18.6% | 3,252 | 17.9% |
| Cost of sales | 9,988 | 58.2% | 10,633 | 59.6% | 10,721 | 59.0% |
Cost of sales includes only expenses directly or indirectly attributable to the sale of products or services, such as cost of materials used, salaries and wages, depreciation and amortization of assets used in manufacturing, and other manufacturing costs (such as repair and maintenance costs related to production, expenses incurred for shipping and handling of internal movements of goods, and other expenses related to manufacturing).
Philips’ cost of sales increased by EUR 88 million to EUR 10,721 million in 2023, and decreased as a percentage of sales, compared to EUR 10,633 million in 2022, mainly due to an increase in Cost of materials used by EUR 306 million in 2023, mainly due to increased sales volume and cost inflation, partly offset by productivity measures and a favorable foreign currency impact. Other key factors influencing cost of sales were as follows:
In 2023, Philips’ gross margin was EUR 7,448 million, or 41.0% of sales, compared to EUR 7,194 million, or 40.4% of sales, in 2022. Gross margin increased by EUR 254 million year-on-year, driven by increased sales and price & productivity measures, partly offset by cost inflation, an unfavorable foreign currency impact, and higher restructuring, acquisition-related and other charges.
Selling expenses amounted to EUR 4,524 million, or 24.9% of sales, in 2023, compared to EUR 4,621 million, or 25.9% of sales, in 2022. The year-on-year decrease in selling expenses of EUR 97 million was mainly driven by a favorable foreign currency impact, partly offset by higher restructuring, acquisition-related and other charges.
General and administrative expenses amounted to EUR 608 million, or 3.3% of sales, in 2023, compared to EUR 671 million, or 3.8% of sales, in 2022. The year-on-year decrease of EUR 63 million was mainly driven by a favorable foreign currency impact and lower restructuring, acquisition-related and other charges.
Research and development costs were EUR 1,890 million, or 10.4% of sales, in 2023, compared to EUR 2,091 million, or 11.7% of sales, in 2022. The year-on-year decrease of EUR 201 million was mainly driven by lower restructuring, acquisition-related and other charges and a favorable foreign currency impact. 2022 included R&D project impairment charges.
Philips Group
Research and development expenses
in millions of EUR unless otherwise stated
| 2021 | 2022 | 2023 | |
|---|---|---|---|
| Diagnosis & Treatment | 762 | 894 | 827 |
| Connected Care | 670 | 822 | 663 |
| Personal Health | 190 | 200 | 197 |
| Other | 184 | 175 | 203 |
| Philips Group | 1,806 | 2,091 | 1,890 |
| As a % of sales | 10.5% | 11.7% | 10.4% |
Goodwill impairment charges were EUR 8 million in 2023 and EUR 1,357 million in 2022. For further information refer to Goodwill.
Net income amounted to a loss of EUR 463 million in 2023, an improvement of EUR 1.1 billion compared to 2022, which included a charge of EUR 1.5 billion related to goodwill and R&D impairments. Higher earnings in 2023 were offset by a EUR 575 million litigation provision in connection with the Respironics recall. Net income in 2022 included a charge of EUR 1.5 billion related to goodwill and R&D impairments. Net income is not allocated to segments, as certain income and expense line items are monitored on a centralized basis, resulting in them being shown on a Philips Group level only.
The following overview shows Income from operations and Adjusted EBITA*) by segment.
Philips Group
Income from operations and Adjusted EBITA1)
in millions of EUR unless otherwise stated
| Income from operations | as a % of sales | Adjusted EBITA1) | as a % of sales | |
|---|---|---|---|---|
| 2023 | ||||
| Diagnosis & Treatment | 720 | 8.2% | 1,026 | 11.6% |
| Connected Care | (1,199) | (23.3)% | 369 | 7.2% |
| Personal Health | 552 | 15.3% | 597 | 16.6% |
| Other | (188) | (71) | ||
| Philips Group | (115) | (0.6)% | 1,921 | 10.6% |
| 2022 | ||||
| Diagnosis & Treatment | 538 | 6.5% | 788 | 9.5% |
| Connected Care | (2,347) | (44.6)% | 111 | 2.1% |
| Personal Health | 515 | 14.2% | 538 | 14.8% |
| Other | (235) | (119) | ||
| Philips Group | (1,529) | (8.6)% | 1,318 | 7.4% |
| 2021 | ||||
| Diagnosis & Treatment | 948 | 12.1% | 1,028 | 13.1% |
| Connected Care | (716) | (13.3)% | 553 | 10.3% |
| Personal Health | 576 | 16.8% | 590 | 17.2% |
| Other | (255) | (117) | ||
| Philips Group | 553 | 3.2% | 2,054 | 12.0% |
Income from operations amounted to a loss of EUR 115 million, or (0.6)% of sales, in 2023, compared to a loss of EUR 1,529 million, or (8.6)% of sales, in 2022, which included a charge of EUR 1.5 billion related to goodwill and R&D impairments. Higher earnings in 2023 were offset by a EUR 575 million Respironics litigation provision. Adjusted EBITA*) increased to EUR 1,921 million and the margin improved to 10.6%, compared to EUR 1,318 million and a margin of 7.4% in 2022, mainly driven by increased sales and pricing & productivity measures.
Amortization and goodwill impairment charges were EUR 298 million in 2023. This includes amortization charges of EUR 290 million and goodwill impairment charges of EUR 8 million. Amortization and goodwill impairment charges in 2022 were EUR 1,720 million. This included a charge of EUR 1,331 million related to an impairment of goodwill in the Sleep & Respiratory Care business, EUR 363 million amortization charges and a EUR 27 million goodwill impairment in the Precision Diagnosis Solutions business.
Restructuring, acquisition-related and other charges were EUR 1,739 million in 2023. This includes: a EUR 575 million Respironics litigation provision, EUR 363 million in connection with the proposed Respironics consent decree, and EUR 224 million Respironics field-action running remediation costs. In addition, it includes EUR 285 million restructuring charges, mainly related to workforce reduction, and charges in relation to quality remediation actions of EUR 175 million. 2022 charges were EUR 1,127 million and included: restructuring charges of EUR 185 million; EUR 148 million portfolio realignment impairments and charges; R&D project impairment charges of EUR 134 million; EUR 250 million for the Respironics field-action provision; EUR 210 million Respironics field-action running remediation costs; an approximately EUR 60 million provision for public investigations into tender irregularities; and EUR 59 million for provisions for quality actions in Connected Care.
Income from continuing operations attributable to shareholders per common share (in EUR) - diluted, was EUR (0.50) in 2023, compared to EUR (1.76) in 2022. Adjusted income from continuing operations attributable to shareholders per common share (in EUR) - diluted*) was EUR 1.25, compared to EUR 0.92 in 2022.
Income from operations increased to EUR 720 million in 2023, compared to EUR 538 million in 2022. This was mainly driven by increased sales and pricing & productivity measures, partly offset by cost inflation. These factors also resulted in an increase in Adjusted EBITA*) to 11.6% of sales in 2023.
Amortization and goodwill impairment charges in 2023 were EUR 98 million and include EUR 89 million amortization charges and EUR 8 million goodwill impairment charges. 2022 charges were EUR 115 million and included EUR 22 million of charges related to an impairment of a technology asset in Image-Guided Therapy.
Restructuring, acquisition-related and other charges in 2023 were EUR 210 million and include EUR 81 million charges in relation to quality remediation actions and EUR 73 million restructuring charges, mainly related to workforce reduction. 2022 charges amounted to EUR 136 million and included R&D project impairment charges of EUR 73 million and a provision of approximately EUR 60 million for public investigations into tender irregularities.
Income from operations increased to EUR (1,199) million in 2023, compared to EUR (2,347) million in 2022, which included a charge of EUR 1.3 billion related to goodwill impairment. 2023 was mainly impacted by the consequences of the Respironics field action, in particular the EUR 575 million provision in connection with the Respironics litigation, partly offset by increased sales and productivity measures. Adjusted EBITA*) improved to 7.2% of sales and was also impacted by cost inflation.
Amortization and goodwill impairment charges in 2023 were EUR 178 million and include EUR 178 million amortization charges. 2022 charges were EUR 1,583 million and included EUR 1,331 million impairment of goodwill related to the Sleep & Respiratory Care business and a goodwill impairment of EUR 27 million in Precision Diagnosis Solutions.
Restructuring, acquisition-related and other charges in 2023 were EUR 1,390 million and include: charges of EUR 575 million Respironics litigation provision, EUR 363 million in connection with the proposed Respironics consent decree, and EUR 224 million Respironics field-action running remediation costs. In addition, it includes EUR 64 million restructuring charges, mainly related to workforce reduction, and charges in relation to quality remediation actions of EUR 94 million. 2022 charges were EUR 875 million and included: EUR 250 million for the Respironics field action provision; EUR 210 million Respironics running remediation costs; EUR 148 million portfolio realignment impairments and charges; and EUR 59 million provisions for quality actions in Connected Care.
Income from operations increased to EUR 552 million in 2023, compared to EUR 515 million in 2022. This was mainly driven by increased sales and pricing & productivity measures. These factors also resulted in an increase in Adjusted EBITA*) to 16.6% of sales.
Amortization charges in 2023 were EUR 14 million and include amortization charges related to intangible assets in Mother & Child Care. 2022 charges were EUR 15 million and included amortization charges related to intangible assets in Mother & Child Care.
Restructuring, acquisition-related and other charges in 2023 were EUR 31 million and include a EUR 23 million investment re-measurement loss and restructuring costs mainly related to workforce reduction of EUR 9 million. 2022 charges were not material.
In Other we report on the items Innovation & Strategy, IP Royalties, Central costs and Other.
Income from operations amounted to a loss of EUR 188 million in 2023, compared to a loss of EUR 235 million in 2022. Adjusted EBITA*) amounted to a loss of EUR 71 million, compared to a loss of EUR 119 million in 2022. The increase in Adjusted EBITA*) was mainly due to cost savings, partly offset by lower royalty income.
Restructuring, acquisition-related and other charges in 2023 were EUR 108 million and include EUR 139 million restructuring charges mainly related to workforce reduction and a gain of EUR 35 million due to a divestment. 2022 charges were EUR 108 million and included restructuring charges of EUR 61 million and a EUR 21 million impairment of intangible assets.
A breakdown of financial income and expenses is presented in the following table.
Philips Group
Financial income and expenses
in millions of EUR
| 2021 | 2022 | 2023 | |
|---|---|---|---|
| Interest expense, net | (141) | (210) | (230) |
| Net change in fair value of financial assets through profit or loss | 95 | 9 | (26) |
| Net foreign exchange gains (losses) | - | 9 | (23) |
| Other | 6 | (8) | (34) |
| Financial income and expenses | (39) | (200) | (314) |
Financial income and expenses resulted in a net expense of EUR 314 million in 2023, compared to a net expense of EUR 200 million in 2022. 2023 includes higher interest expense, fair value losses on minority investments and net foreign exchange losses compared to 2022. For further information, refer to Financial income and expenses.
Income tax expense increased by EUR 40 million year-on-year. The income tax benefit in 2023 is mainly driven by the negative income before tax, recognition of tax credits and tax incentives, partly offset by the tax effect on the economic loss class-action settlement provision relating to the Respironics recall. The income tax benefit in 2022 was mainly driven by the negative income before tax and tax incentives, partly offset by non-tax-deductible goodwill impairment.
Results related to investments in associates declined from a loss of EUR 2 million in 2022 to a loss of EUR 98 million in 2023. 2023 includes impairments of EUR 58 million and share of results of associates of EUR 40 million.
Philips Group
Discontinued operations, net of income taxes
in millions of EUR
| 2021 | 2022 | 2023 | |
|---|---|---|---|
| Domestic Appliances | 2,698 | 3 | (2) |
| Other | 13 | 10 | (7) |
| Net income of Discontinued operations | 2,711 | 13 | (10) |
In 2023 and 2022, Discontinued operations consisted primarily of the Domestic Appliances business and certain other divestments that were reported as discontinued operations. In 2021, the sale of the Domestic Appliance business resulted in an after-tax gain of EUR 2.5 billion.
For further information, refer to Discontinued operations and assets classified as held for sale.
Net income attributable to non-controlling interests decreased from EUR 3 million in 2022 to EUR 2 million in 2023.
Philips Group
Restructuring charges
in millions of EUR
| 2021 | 2022 | 2023 | |
|---|---|---|---|
| Restructuring charges per segment: | |||
| Diagnosis & Treatment | 24 | 57 | 73 |
| Connected Care | 63 | 55 | 64 |
| Personal Health | (1) | 11 | 9 |
| Other | (5) | 61 | 139 |
| Philips Group | 80 | 185 | 285 |
| Cost breakdown of restructuring charges: | |||
| Provision for personnel lay-off costs | 17 | 136 | 196 |
| Restructuring-related asset impairment | 30 | 31 | 56 |
| Other restructuring-related costs | 33 | 18 | 33 |
| Philips Group | 80 | 185 | 285 |
In 2023, Philips continued general productivity actions aimed at simplifying the organization to streamline ways of working and reduce operating expenses. This included a further reduction to 8,000 roles to date, out of the planned reduction of 10,000 roles globally across the organization by 2025, for which a restructuring charge of EUR 140 million was recorded in 2023. In addition, restructuring projects were executed during the year, of which the most significant impacted the Diagnosis & Treatment and Connected Care segments and mainly took place in the US and Netherlands.
In 2022, Philips initiated general productivity actions aimed at simplifying the organization to streamline ways of working and reduce operating expenses. This included an immediate reduction of around 4,000 positions globally across the organization, for which a restructuring charge of EUR 80 million was recorded. In addition, restructuring projects were executed during the year, of which the most significant impacted the Diagnosis & Treatment and Connected Care segments and mainly took place in the US and Netherlands. The restructuring mainly comprised product portfolio rationalization and the reorganization of global support functions.
For further information on restructuring, refer to Provisions.
Philips Group
Acquisition-related charges
in millions of EUR
| 2021 | 2022 | 2023 | |
|---|---|---|---|
| Diagnosis & Treatment | (53) | (54) | 45 |
| Connected Care | 67 | 70 | 51 |
| Philips Group | 14 | 17 | 96 |
In 2023, acquisition-related charges amounted to EUR 96 million. The Diagnosis & Treatment segment recorded charges of EUR 45 million, mainly related to the acquisition of Spectranetics, due to post-acquisition integration costs. The Connected Care segment recorded charges of EUR 51 million, mainly related to the acquisition of BioTelemetry and Capsule Technologies, due to post-acquisition integration costs.
In 2022, acquisition-related charges amounted to EUR 17 million. The Connected Care segment recorded charges of EUR 70 million related to the acquisitions of BioTelemetry and Capsule Technologies, due to post-acquisition integration costs. The Diagnosis & Treatment segment recorded a net gain of EUR 54 million, mainly related to a gain of EUR 92 million from the re-measurement of contingent consideration liabilities, partly offset by charges related to the acquisition of Spectranetics.
In 2023, Philips completed one acquisition involving a total net cash outflow of EUR 53 million (total equity price and settlement of debt). The acquisition is subject to final purchase price allocation procedures, which are expected to be finalized in the second quarter of 2024.
In 2022, Philips completed three acquisitions. The acquisition of Vesper Medical Inc., completed on January 11, 2022, was the most notable. Acquisitions in 2022 and prior years led to acquisition and post-merger integration charges of EUR 70 million in the Connected Care segment.
In 2023, Philips completed six divestments for a cash consideration of EUR 80 million, notably Philips Pharma Solutions in the US.
In 2022, Philips completed one divestment, which was not material.
For details, please refer to Acquisitions and divestments.
The movements in cash and cash equivalents balance for the years ended December 31, 2021, 2022 and 2023 are presented and explained in the following table.
Philips Group
Condensed consolidated cash flows
in millions of EUR
| 2021 | 2022 | 2023 | |
|---|---|---|---|
| Beginning cash and cash equivalents balance | 3,226 | 2,303 | 1,172 |
| Net cash flows from operating activities | 1,629 | (173) | 2,136 |
| Net cash flows from investing activities | |||
| Net capital expenditures | (729) | (788) | (554) |
| Other cash flows from investing activities | (2,943) | (698) | (82) |
| Net cash flows from financing activities | |||
| Treasury shares transactions | (1,613) | (174) | (662) |
| Changes in debt | (251) | 1,092 | (181) |
| Dividend paid to shareholders of the company | (482) | (412) | (2) |
| Other cash flow items | 62 | 34 | (81) |
| Net cash flows from discontinued operations | 3,403 | (12) | 123 |
| Ending cash and cash equivalents balance | 2,303 | 1,172 | 1,869 |
Net cash flows from operating activities amounted to an inflow of EUR 2,136 million in 2023, compared to an outflow of EUR 173 million in 2022. This increase is mainly due to higher cash earnings and lower working capital, and includes a EUR 141 million payment related to the previously announced resolution of the economic loss class action in the US. Free cash flow*) amounted to a cash inflow of EUR 1,582 million in 2023, compared to an outflow of EUR 961 million in 2022.
Net cash flows from operating activities amounted to an outflow of EUR 173 million in 2022, compared to an inflow of EUR 1,629 million in 2021. This decrease is mainly due to lower cash earnings, increased working capital and cash costs related to the Philips Respironics field action. Free cash flow*) amounted to a cash outflow of EUR 961 million in 2022, compared to an inflow of EUR 900 million in 2021.
Net cash flows from investing activities consist of net capital expenditures and other cash flows from investing activities.
In 2023, other cash flows from investing activities amounted to a cash outflow of EUR 82 million, mainly due to a new business acquisition and minority investments, partly offset by divestment proceeds.
In 2022, other cash flows from investing activities amounted to a cash outflow of EUR 698 million, mainly due to the acquisitions of Vesper Medical and Cardiologs, amounting to EUR 414 million, and new minority investments.
Net cash flows from financing activities consist of treasury shares transactions, changes in debt, dividend paid and other cash flow items.
In 2023, treasury shares transactions mainly included the share buyback activities, which resulted in EUR 662 million net cash outflow. Changes in debt mainly includes new bonds issued of EUR 500 million and loan repayments amounting to EUR 500 million. The dividend was distributed fully in shares.
In 2022, treasury shares transactions mainly included the share buyback activities, which resulted in EUR 174 million net cash outflow. Changes in debt mainly included new bonds issued of EUR 2 billion and a new term loan issued of EUR 500 million, partly offset by bond repayments of EUR 1.2 billion. Philips’ shareholders received a total dividend of EUR 741 million, including costs, of which the cash portion amounted to EUR 412 million.
In 2023, net cash provided by discontinued operations was EUR 123 million, mainly related to a refund received of one-off advance tax payments of a previously disposed business.
In 2022, net cash used for discontinued operations was EUR 12 million, mainly related to previously disposed businesses.
Condensed consolidated balance sheets as of December 31, 2021, 2022 and 2023 are presented in the following table:
Philips Group
Condensed consolidated balance sheets
in millions of EUR
| 2021 | 2022 | 2023 | |
|---|---|---|---|
| Intangible assets | 14,287 | 13,764 | 13,067 |
| Property, plant and equipment | 2,699 | 2,638 | 2,483 |
| Investments and financial assets | 1,121 | 1,334 | 1,050 |
| Deferred tax assets | 2,216 | 2,449 | 2,627 |
| Inventories | 3,450 | 4,049 | 3,491 |
| Receivables | 4,191 | 4,616 | 4,146 |
| Other assets | 693 | 665 | 672 |
| Payables | (3,784) | (3,635) | (3,886) |
| Provisions | (2,313) | (2,115) | (2,498) |
| Contract liabilities | (1,936) | (2,210) | (2,278) |
| Other liabilities | (1,473) | (1,244) | (993) |
| Net assets employed | 19,151 | 20,311 | 17,881 |
| Cash and cash equivalents | 2,303 | 1,172 | 1,869 |
| Debt | (6,980) | (8,201) | (7,689) |
| Net debt1) | (4,676) | (7,028) | (5,820) |
| Non-controlling interests | (36) | (34) | (33) |
| Shareholders' equity | (14,438) | (13,249) | (12,028) |
| Financing | (19,151) | (20,311) | (17,881) |
Total debt outstanding at the end of 2023 was EUR 7,689 million, compared with EUR 8,201 million at the end of 2022.
Philips Group
Balance sheet changes in debt
in millions of EUR
| 2021 | 2022 | 2023 | |
|---|---|---|---|
| New lease liabilities | 164 | 104 | (233) |
| New borrowings long-term debt | 76 | 2,516 | (544) |
| Repayments long-term debt incl. leases | (302) | (1,472) | 754 |
| New borrowings (repayments) short-term debt | (25) | 47 | (29) |
| Forward contracts entered (matured) | (48) | (76) | 462 |
| Currency effects, consolidation changes and other | 180 | 101 | 102 |
| Changes in debt | 46 | 1,221 | 512 |
In 2023, total debt decreased by EUR 512 million compared to 2022. The decrease mainly comes from maturing forward contracts related to the share buyback program and long-term incentive and employee stock purchase plans, and repayments of long-term debt including leases, partly offset by new borrowings. In 2023, Philips issued EUR 500 million of fixed rate notes under the company’s EMTN program that mature in 2031 and used the proceeds for general corporate purposes, including the repayment of EUR 500 million that was outstanding under the credit facility entered into in the fourth quarter of 2022. Changes in payment obligations from forward contracts are related to the maturity in 2023 of EUR 481 million of share buyback forwards (as announced in July 2021) and EUR 125 million of forwards relating to long-term incentive and employee stock purchase plans (as announced in March 2020 and May 2021), partially offset by EUR 138 million of forwards entered into relating to long-term incentive plans (as announced in June 2023).
In 2022, Philips announced a series of Liability Management transactions to optimize its debt maturity profile. The transactions included the issuance of three series of Notes under its EMTN program for a total of EUR 2 billion with maturities in 2027, 2029 and 2033. Part of the proceeds were used to tender certain of Philips’ outstanding US Dollar denominated bonds due 2025 and 2026 and Euro-denominated bonds due 2023, 2024 and 2025, as well as make-whole and fully redeem the Euro-denominated bonds due 2023 and 2024 that were not purchased as part of the Euro tender offer. Philips issued Commercial Paper of EUR 200 million in September 2022 and EUR 101 million in October 2022. These tranches were repaid throughout the fourth quarter of 2022. In addition, in October 2022 Philips entered into a EUR 1 billion credit facility that could be used for general corporate purposes. The credit facility was fully repaid in October 2023. Per year-end 2022, EUR 500 million was utilized and outstanding under the credit facility.
At the end of 2023, long-term debt as a proportion of the total debt stood at 91.5% with an average remaining term (including current portion) of 6.0 years, compared to 88.6% and 6.1 years respectively at the end of 2022.
At the end of 2022, long-term debt as a proportion of the total debt stood at 88.6% with an average remaining term (including current portion) of 6.1 years, compared to 92.7% and 6.0 years respectively at the end of 2021.
For further information, please refer to Debt.
As of December 31, 2023, including the cash position (cash and cash equivalents), as well as its EUR 1 billion committed revolving credit facility, the Philips Group had access to available liquidity of EUR 2,883 million, compared with gross debt (including short and long-term) of EUR 7,689 million.
As of December 31, 2022, including the cash position (cash and cash equivalents), as well as its EUR 1 billion committed revolving credit facility and the EUR 500 million undrawn portion of the credit facility entered into in October 2022, the Philips Group had access to available liquidity of EUR 2,704 million, compared with gross debt (including short and long-term) of EUR 8,201 million.
Philips Group
Liquidity position
in millions of EUR
| 2021 | 2022 | 2023 | |
|---|---|---|---|
| Cash and cash equivalents | 2,303 | 1,172 | 1,869 |
| Listed equity investments at fair value1) | 67 | 32 | 14 |
| Committed revolving credit facility | 1,000 | 1,000 | 1,000 |
| Credit facility | 500 | ||
| Liquidity | 3,370 | 2,704 | 2,883 |
| Short-term debt | (506) | (931) | (654) |
| Long-term debt | (6,473) | (7,270) | (7,035) |
| Debt | (6,980) | (8,201) | (7,689) |
| Net available liquidity resources | (3,609) | (5,497) | (4,806) |
Philips has a EUR 1 billion committed revolving credit facility which was signed in April 2017 and refinanced in March 2022, which will expire in March 2027. In 2023, Philips extended the maturity of the facility to 2028 and has one 1-year extension option remaining. The facility can be used for general group purposes, such as a backstop of its Commercial Paper Program.
Philips' Commercial Paper Program amounts to USD 2.5 billion, under which commercial paper can be issued up to 364 days in tenor, both in the US and in Europe, in any major freely convertible currency. As of December 31, 2023, Philips had no commercial paper outstanding. Philips established a Euro Medium Term Note (EMTN) program which facilitates the issuance of notes for a total amount of up to EUR 10.0 billion. In 2023, Philips issued EUR 500 million fixed rate notes due 2031 under the program. The proceeds were used for general corporate purposes, including the repayment of EUR 500 million that was outstanding under the credit facility entered into in the fourth quarter of 2022.
In terms of liquidity, the company has access to various sources. The company’s liquidity risk management procedures have not changed significantly during 2023. The access to existing lines of credit remains intact. These lines of credit, along with other financial risks to which Philips is exposed, are disclosed in Details of treasury and other financial risks. Further, with respect to potential claims related to the Respironics recall, please refer to Contingencies. The management continues to monitor the risks associated with such potential claims and its impact on liquidity position, if any.
Philips’ existing long-term debt is rated BBB+ (with stable outlook) by Fitch, Baa1 (with negative outlook) by Moody’s, and BBB+ (with negative outlook) by Standard & Poor’s. As part of our capital allocation policy, our net debt*) position is managed with the intention of retaining our strong investment grade credit rating. Ratings are subject to change at any time and there is no assurance that Philips will be able to achieve this goal. Philips' aim when managing the net debt*) position is dividend stability and a pay-out ratio of 40% to 50% of adjusted income from continuing operations attributable to shareholders*). Philips’ outstanding long-term debt and credit facilities do not contain financial covenants. Adverse changes in the company’s ratings will not trigger automatic withdrawal of committed credit facilities or any acceleration in the outstanding long-term debt (provided that the USD-denominated bonds issued by Philips in March 2008 and 2012 contain a ‘Change of Control Triggering Event’ and the EUR-denominated bonds contain a ‘Change of Control Put Event’). A description of Philips’ credit facilities can be found in Debt.
Philips Group
Credit rating summary
| long-term | short-term | outlook | |
| Fitch | BBB+ | Stable | |
| Moody's | Baa1 | P-2 | Negative |
| Standard & Poor's | BBB+ | A-2 | Negative |
Philips pools cash from subsidiaries to the extent legally and economically feasible. Cash not pooled remains available for local operational needs or general purposes. The company faces cross-border foreign exchange controls and/or other legal restrictions in a few countries, which could limit its ability to make these balances available on short notice for general use by the group.
Philips believes its current liquidity and direct access to capital markets is sufficient to meet its present financing needs.
In 2023, shareholders’ equity decreased by EUR 1,220 million to EUR 12,028 million at year-end. The decrease was mainly due to the net loss of EUR 463 million and currency translation reductions in equity of EUR 604 million, primarily due to the depreciation of the US dollar against the euro in 2023.
In 2022, shareholders’ equity decreased by EUR 1,189 million to EUR 13,249 million at year-end. The decrease was mainly due to net loss of EUR 1,608 million, dividend distributed (EUR 412 million), and settlements of earlier concluded forward contracts (EUR 140 million). This was partly offset by currency translation gains of EUR 749 million, primarily due to the appreciation of the US dollar against the euro in 2022.
The number of issued common shares of Royal Philips as of December 31, 2023 was 913,515,966. At year-end 2023, the company held 7.1 million shares in treasury to cover obligations under long-term incentive plans. In 2016, Philips purchased call options on its own shares to hedge options granted to employees up to 2013, and as of December 31, 2023, no such options remained outstanding. In 2023 (and earlier years), the company entered into several forward contracts to acquire its own shares, and as of December 31, 2023, the outstanding forward contracts related to 15.5 million shares. See below for more information on the shares that were acquired in the course of 2023. Philips issued 39.3 million shares in May 2023 in order to distribute the 2022 dividend. The company cancelled 15.1 million shares in December 2023.
The number of issued common shares of Royal Philips as of December 31, 2022 was 889,315,082. At year-end 2022, the company held 7.8 million shares in treasury. Of these shares, 5.7 million shares were held to cover obligations under long-term incentive plans and 2.2 million shares were held for capital reduction purposes. In 2016, Philips purchased call options on its own shares to hedge options granted to employees up to 2013, and as of December 31, 2022, Philips’ outstanding options related to 26 thousand shares. In 2022 (and earlier years), the company entered into several forward contracts to acquire its own shares, and as of December 31, 2022, the outstanding forward contracts related to 24.5 million shares. See below for more information on the shares that were acquired in the course of 2022. Philips issued 14.2 million shares in June 2022 in order to distribute the 2021 dividend. The company cancelled 8.8 million shares in June 2022.
Historically, Philips uses different methods to repurchase shares in its own capital: (i) share buyback repurchases in the open market via an intermediary; (ii) repurchase of shares via forward contracts for future delivery of shares; and (iii) the unwinding of call options on own shares. During 2023, Philips used method (ii) to repurchase shares for capital reduction purposes and share-based compensation plans.
The open market transactions via an intermediary allow for buybacks during both open and closed periods.
For more information on share repurchase transactions entered into 2021, 2022, and 2023, please refer to Equity.
Philips Group
Impact of share acquisitions and cancellations on share count
in thousands of shares as of December 31
| 2019 | 2020 | 2021 | 2022 | 2023 | |
|---|---|---|---|---|---|
| Shares issued | 896,734 | 911,053 | 883,899 | 889,315 | 913,516 |
| Shares in treasury | 5,760 | 5,925 | 13,717 | 7,835 | 7,113 |
| Shares outstanding | 890,974 | 905,128 | 870,182 | 881,481 | 906,403 |
| Shares acquired | 40,390 | 8,670 | 45,486 | 5,081 | 15,964 |
| Shares cancelled | 38,541 | 3,810 | 33,500 | 8,758 | 15,134 |
Philips Group
Total number of shares repurchased
in thousands of shares unless otherwise stated
| share repurchases related to shares acquired for capital reduction | average price paid per share in EUR | shares acquired for LTI's | average price paid per share in EUR | total number of shares purchased1) | average price paid per share in EUR | total number of shares purchased as part of publicly announced plans or programs2)3)4) | approximate value of shares that may yet be purchased under the plans or programs in thousands of EUR | |
|---|---|---|---|---|---|---|---|---|
| January 2023 | 858,343 | |||||||
| February 2023 | 858,343 | |||||||
| March 2023 | 858,343 | |||||||
| April 2023 | 858,343 | |||||||
| May 2023 | 2,100 | 37.54 | 2,100 | 37.54 | 2,100 | 781,290 | ||
| June 2023 | 919,239 | |||||||
| July 2023 | 2,100 | 36.69 | 2,100 | 36.69 | 2,100 | 842,194 | ||
| August 2023 | 842,194 | |||||||
| September 2023 | 2,100 | 36.69 | 2,100 | 36.69 | 2,100 | 765,153 | ||
| October 2023 | 2,224 | 37.47 | 1,000 | 44.85 | 3,224 | 39.76 | 3,224 | 636,967 |
| November 2023 | 2,223 | 37.49 | 2,000 | 39.96 | 4,223 | 38.66 | 4,223 | 473,721 |
| December 2023 | 2,218 | 37.58 | 2,218 | 37.58 | 2,218 | 390,388 | ||
| Total | 12,964 | 3,000 | 15,964 | 38.66 | 15,964 | |||
| of which5) | ||||||||
| purchased in the open market | ||||||||
| acquired through exercise of call options/settlement of forward contracts | 12,964 | 3,000 | 15,964 | 15,964 | ||||
| To be acquired by settlement of forward contracts after December 31, 2023 | 390,388 |
The following table presents a summary of the Group's fixed contractual cash obligations and commitments as of December 31, 2023. These amounts are an estimate of future payments, which could change as a result of various factors such as a change in interest rates, foreign exchange, contractual provisions, as well as changes in our business strategy and needs. Therefore, the actual payments made in future periods may differ from those presented in the following table:
| payments due by period | |||||
|---|---|---|---|---|---|
| total | less than 1 year | 1-3 years | 3-5 years | after 5 years | |
| Long-term debt | 7,615 | 533 | 1,934 | 1,431 | 3,717 |
| Short-term debt | 122 | 122 | |||
| Interest on debt | 1,704 | 180 | 328 | 285 | 911 |
| Derivative liabilities | 39 | 38 | 1 | ||
| Purchase obligations3) | 668 | 355 | 286 | 27 | |
| Trade and other payables | 1,917 | 1,917 | |||
| Contractual cash obligations | 12,065 | 3,145 | 2,549 | 1,716 | 4,655 |
Included in debt are remaining forward contracts of EUR 167 million related to the EUR 1.5 billion share buyback program announced in July 2021 and EUR 224 million relating to the repurchase of shares to cover long-term incentive and employee stock purchase plans. In 2023, Philips entered into a total amount of EUR 138 million of forward contracts relating to the repurchase of up to 7.1 million shares to cover long-term incentive plans. In addition, in 2023 there were maturities of a total of EUR 481 million of forward contracts for 13.0 million shares related to the EUR 1.5 billion share buyback program announced in July 2021, as well as maturities of a total of EUR 125 million of forward contracts to repurchase shares to cover long-term incentive and employee stock purchase plans. Philips intends to cancel all of the shares acquired under the share buyback program and has canceled 15.1 million shares acquired in 2023, as the program was initiated for capital reduction purposes.
Philips offers voluntary supply chain finance programs with third parties, which provide participating suppliers with the opportunity to factor their trade receivables at the sole discretion of both the suppliers and the third parties. Philips continues to recognize these liabilities as trade payables and settles them accordingly on the invoice maturity date based on the terms and conditions of these arrangements. As of December 31, 2023, approximately EUR 114 million (2022: EUR 151 million) of the Philips accounts payable were transferred under these arrangements.
The company and its subsidiaries sponsor post-employment benefit plans in many countries in accordance with legal requirements, customs and the local situation in the countries involved. For a discussion of the plans and expected cash outflows, please refer to Post-employment benefits.
The company had various provisions by the end of 2023 which are expected to result in cash outflows in 2024. Refer to Provisions.
Philips has contracts with investment funds where it committed itself to make, under certain conditions, capital contributions to these funds of an aggregated remaining amount of EUR 153 million (2022: EUR 127 million). Capital contributions already made to these investment funds are recorded as non-current financial assets.
Please refer to Dividend for information on the proposed dividend distribution.
Please refer to Equity for information on other Long-term incentive and employee stock purchase plans.
Philips’ policy is to provide guarantees and other letters of support only in writing. Philips does not provide other forms of support. The total fair value of guarantees recognized on the balance sheet amounts to EUR nil million for both 2023 and 2022. Remaining off-balance-sheet business-related guarantees on behalf of third parties and associates amount to EUR 2 million as of December 31, 2023 (December 31, 2022: EUR 2 million).
Philips’ dividend policy is aimed at dividend stability and a pay-out ratio of 40% to 50% of adjusted income from continuing operations attributable to shareholders*).
A proposal will be submitted to the Annual General Meeting of Shareholders, to be held on May 7, 2024, to declare a distribution of EUR 0.85 per common share, in common shares, against retained earnings.
If the above dividend proposal is adopted, the shares will be traded ex-dividend as of May 9, 2024 at the New York Stock Exchange and Euronext Amsterdam. In compliance with the listing requirements of the New York Stock Exchange and Euronext Amsterdam, the dividend record date will be May 10, 2024.
The number of share dividend rights entitled to one new common share will be determined based on the volume-weighted average price of all traded common shares of Koninklijke Philips N.V. at Euronext Amsterdam on May 9, 10 and 13, 2024. The company will calculate the number of share dividend rights entitled to one new common share (the ratio), such that the gross dividend in shares will be approximately equal to EUR 0.85. The ratio and the number of shares to be issued will be announced on May 15, 2024. Distribution of the dividend (up to EUR 770 million) and delivery of new common shares, with settlement of any fractions in cash, will take place from May 16, 2024.
| ex-dividend date | record date | distribution from | |
| Euronext Amsterdam | May 9, 2024 | May 10, 2024 | May 16, 2024 |
| New York Stock Exchange | May 9, 2024 | May 10, 2024 | May 16, 2024 |
Further details will be given in the agenda with explanatory notes for the 2024 Annual General Meeting of Shareholders. The proposed distribution and all dates mentioned remain provisional until then.
Dividend in shares distributed out of retained earnings is subject to 15% dividend withholding tax, but only in respect of the par value of the shares (EUR 0.20 per share). Shareholders are advised to consult their tax advisor on the applicable situation with respect to taxes on the dividend received.
In May 2023, Philips settled a dividend of EUR 0.85 per common share, representing a total value of EUR 749 million (including costs). The dividend was distributed in the form of shares only, resulting in the issuance of 39,334,938 new common shares, leading to a 4.5% dilution. For more information refer to Shareholders’ equity.
The following table sets forth in euros the gross dividends on the common shares in the fiscal years indicated (from prior-year profit distribution) and such amounts as converted into US dollars and paid to holders of shares of the New York Registry:
The analysis of the 2022 financial results compared to 2021, and the discussion of the critical accounting policies, have not been included in this Annual Report. These sections are included in Philips’ Form 20-F for the financial year 2023, which will be filed electronically with the US Securities and Exchange Commission.
Philips reiterates confidence in delivering the plan for 2023-2025, acknowledging that uncertainties remain. For full-year 2024, Philips expects to deliver 3-5% comparable sales growth*) and an Adjusted EBITA*) margin of 11-11.5%. In 2024, Philips expects around 100 basis points of costs that relate to remediation activities and disgorgement payments for Philips Respironics sales in the US. The free cash flow*) from Philips' businesses is expected to amount to EUR 0.8-1 billion. This only excludes the remaining cash-out related to the previously announced resolution of the economic loss class action in the US.
The previously stated 2023-2025 Group financial outlook of mid-single-digit comparable sales growth*), low-teens Adjusted EBITA*) margin, and EUR 1.4-1.6 billion free cash flow*) now takes the proposed Respironics consent decree into account and remains unchanged. It excludes the investigation by the US Department of Justice related to the Respironics field action and the impact of the ongoing litigation.

1.88 billion lives improved by our products and solutions, including 221 million in underserved communities
CDP ‘A List' rating for climate action for 11th year in a row
Strengthening patient safety and quality Philips' highest priority
Shift to new, simplified operating model, including reduction of roles
Preparing for upcoming ESG reporting legislation
Environmental, Social & Governance (ESG) are three key dimensions within which a company’s approach to doing business responsibly and sustainably, and its overall societal impact, are defined. They give expression to an increasingly widely held view – that companies that hold themselves accountable to their stakeholders and increase transparency will be more viable, and valuable, in the long term.
Philips is a purpose-driven company aiming to improve the health and well-being of 2.5 billion people annually by 2030. We believe that private-sector companies like ours have a vital role to play in collaborating with other partners across our supply chain, and with private and public organizations in society, to address the major challenges the world is facing.
Taking a multi-stakeholder approach, we draw inspiration from the societal impact we can have through our products and solutions, and through how we operate in the world. Our company is very conscious of our responsibility and our contribution to society and the environment. We are also witnessing growing interest in ESG on the part of our customers, who are increasingly turning to technology companies for support in addressing their sustainability objectives and are including ESG-related considerations in their procurement policies and criteria.
We aim to be a front-runner in the area of ESG and have been recognized as leading the way in, for example, sustainability, corporate governance practices and tax transparency.
Our reporting is aligned with the comprehensive and integrated Environmental, Social & Governance (ESG) commitments we have adopted for the period 2020-2025.
We have excluded the data from Domestic Appliances from the ESG information wherever possible. In a limited number of cases, for example for road logistics emissions, we have used proxies. If Domestic Appliances information was not available for past years, and could therefore not be excluded, we have indicated this in the respective section. The Employee Engagement Index (EEI) and General Business Principles (GBP) results have not been restated.
In September 2020, Philips reinforced its commitments as a purpose-driven company with the announcement of an enhanced and fully integrated approach to doing business responsibly and sustainably. Philips’ framework comprises a comprehensive set of commitments across all the Environmental, Social and Governance (ESG) dimensions that guide execution of the company’s strategy. It includes ambitious targets and detailed plans of action.
As a leading health technology company today, our purpose is to improve people’s health and well-being through meaningful innovation, positively impacting 2.5 billion lives per year by 2030. We aim to grow Philips responsibly and sustainably, and we therefore continuously set ourselves challenging environmental and social targets, and highest standards of governance. Acting responsibly towards the planet and society is part of our DNA. We believe that this is the best way for us to create superior, long-term value for Philips’ multiple stakeholders.
Philips’ ESG commitments are set out below. Further details relating to these commitments can be found throughout the rest of this chapter, in Supplier sustainability, and in ESG statements.
We act responsibly towards our planet in line with UN SDGs 12 and 13.
Our purpose is to improve people’s health and well-being through meaningful innovation, in line with UN SDG 3. We act responsibly towards society and partner with our stakeholders
We aim to deliver superior long-term value for our customers and shareholders, and we live up to the highest standards of ethics and governance in our culture and practices
We have an environmental impact through our global operations (including our supply chain), but even more so through our products and solutions. This is where we contribute to SDG 12 (Ensure sustainable consumption and production patterns) and SDG 13 (Take urgent action to combat climate change and its impacts).
In this Environmental performance section, an overview is given of the most important environmental parameters of our ESG commitments. We focus on the material topics arising from our Double Materiality Assessment - Climate change and Resource use and circular economy, but also address some other environmental topics. Details can be found in the ESG statements.
Philips has been performing Life-Cycle Assessments (LCAs) since 1990. LCAs provide insight into the lifetime environmental impact of our products. They are used to steer our EcoDesign efforts by reducing the environmental impact during the lifetime of our products and to grow our Green/EcoDesigned/EcoHero and Circular portfolio. As a next step, for the seventh year, we have measured our environmental impact on society at large via a so-called Environmental Profit & Loss (EP&L) account, which includes the hidden environmental costs associated with our activities and products. It provides insights into the main environmental hotspots and innovation areas to reduce the environmental impact of our products and solutions.
The EP&L account is based on LCA methodology, in which the environmental impacts are expressed in monetary terms using conversion factors developed by CE Delft. These conversion factors are subject to further refinement and are expected to change over time. We used expert opinions and estimates for some parts of the calculations. The figures reported are Philips’ best possible estimates. As we gain new insights and retrieve more and better data, we will enhance the methodology, use-cases and accuracy of results in the future. For more information and details we refer to our methodology document.
The definition of the use-case scenarios has a significant impact on the result, especially for consumer products, which have large sales volumes, long lifetimes and frequently high energy consumption.
The current EP&L account only includes the hidden environmental costs. It does not yet include the benefits to society that Philips generates by improving people’s health and well-being through our products and solutions. We have a well-established methodology to calculate the number of lives we positively touch with our products and solutions. We aim to look into valuing these societal benefits in monetary terms in the future.
The Philips products subject to the Respironics recall were evaluated as part of the 2023 EP&L calculation. In accordance with the EP&L methodology, products replaced during the recall by new products with lifetime guarantees were included in the 2023 EP&L calculation for all life cycle stages. Refurbished products and repair kits were not included.
Compared to the adjusted 2022 EP&L impact of EUR 4.38 billion, Philips reduced its environmental impact in 2023 to EUR 4.21 billion. This is mainly due to differences in sales mix (including the impact of the Respironics recall).
The increase in the 2022 baseline was mainly driven was mainly driven by the update to the EcoInvent 3.9.1 database using ReCiPe 2016 (our Life Cycle Inventory database containing environmental impacts of products and services) from the EcoInvent 3.8 database using ReCiPe 2008, and the update to the 2023 CE Delft prices for EU27 from the 2017 CE Delft prices for Dutch territory only. Philips updates the EcoInvent database used on a yearly basis to utilize recent emission factors and in this case, to utilize the current ReCiPe 2016 methodology. Additionally, the CE Delft prices for EU27 were more representative of a global manufacturing company, like Philips.
To understand the changes to the 2022 EP&L and have a comparable baseline for the 2023 reporting, please refer to the following chart:
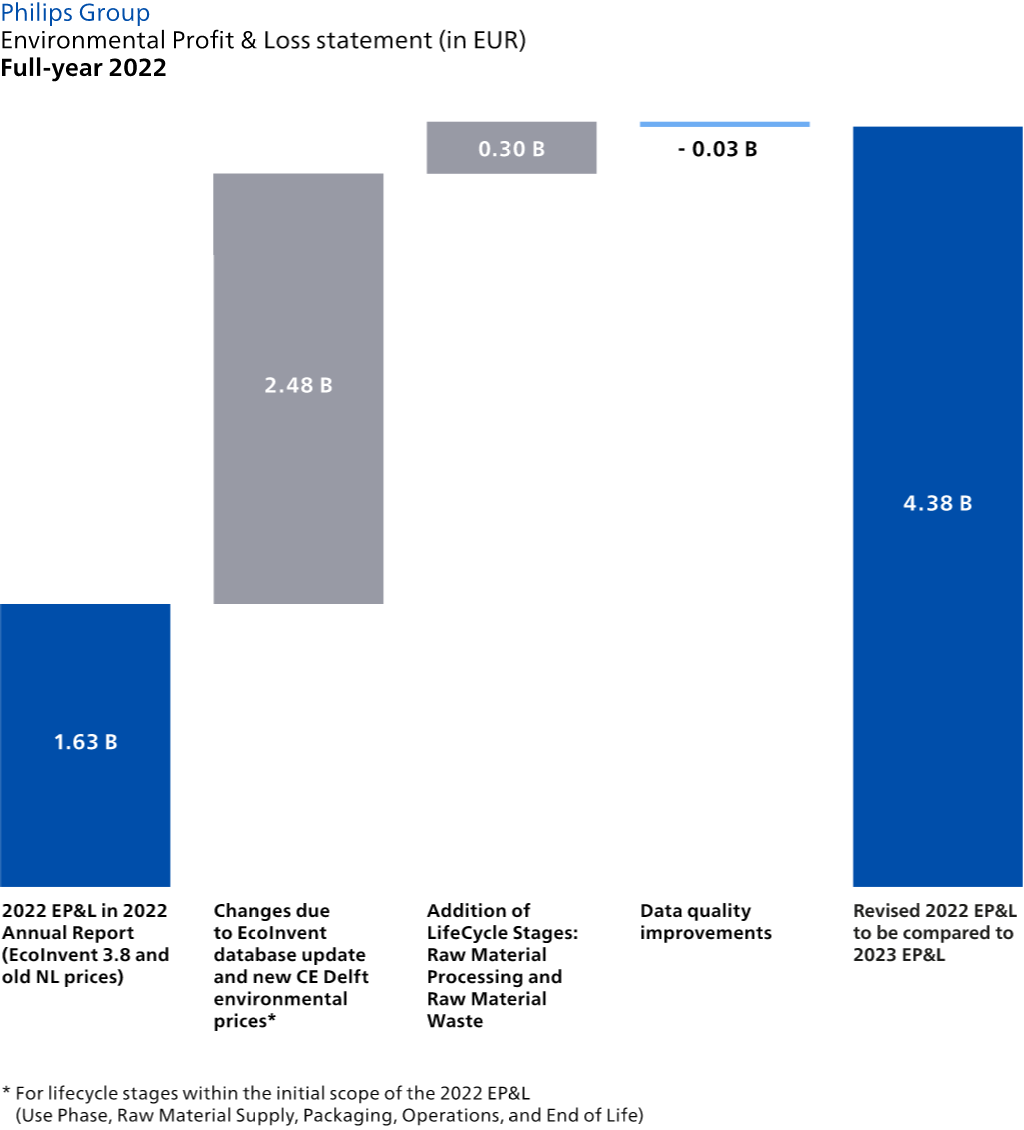
The majority of this increase can be attributed to the increase in the emission factors and/or prices for the following environmental impact categories on the lifecycle stages included in the 2022 EP&L:
Additionally, the environmental impact categories associated with biodiversity and ecosystem services were included, which amounted to approximately EUR 61 million. Therefore, the total increase attributed to methodology changes to the 2022 EP&L with the existing 2022 lifecycle stages is EUR 2.48 billion. Additionally, to compare the 2022 EP&L with the 2023 EP&L, the Raw Material Processing and Raw Material Waste lifecycle stages should be included (adding some EUR 302 million to the 2022 EP&L). With the inclusion of data quality improvements and corrections performed in 2023, the 2022 EP&L would be approximately EUR 4.38 billion.
The most significant environmental impact, 51% of the total, is related to the usage of our products, which is due to electricity consumption. Human toxicity, particulate matter formation, and climate change are other important impacts. The environmental costs include the environmental impact of the full lifetime of the products that we put on the market in 2023, e.g. 10 years in the case of a MRI or 5 years of usage in the case of a Sonicare toothbrush. Products identified as rentals are the only exception, with an energy consumption of one year. As we expand our EcoDesign activities, with a target to have all our products EcoDesigned by 2025, we expect to better report on its environmental impact in the years to come.
Of the total 2023 impact, just EUR 261 million (6%) is directly caused by Philips’ own operations, mainly driven by outbound logistics, followed by business travel. Compared to EUR 128 million in 2022, this is almost a two times increase, mainly due to updating the emission factors from EcoInvent 3.8 to EcoInvent 3.9.1 and the prices to the 2023 CE Delft prices for EU27, mitigating the downward trend in logistics emissions as presented in Sustainable Operations.
Our materials and components supply chain, including raw materials supply, raw materials processing, raw materials waste, and packaging currently has an environmental impact of some EUR 1.80 billion, which is 43% of our total environmental impact. The main contributors are the electronic components (including printed circuit boards), cables and metals used in our products. Through our Circular Economy and Supplier Sustainability programs we will continue to focus on reducing the environmental impact caused by the materials we source and apply in our products.
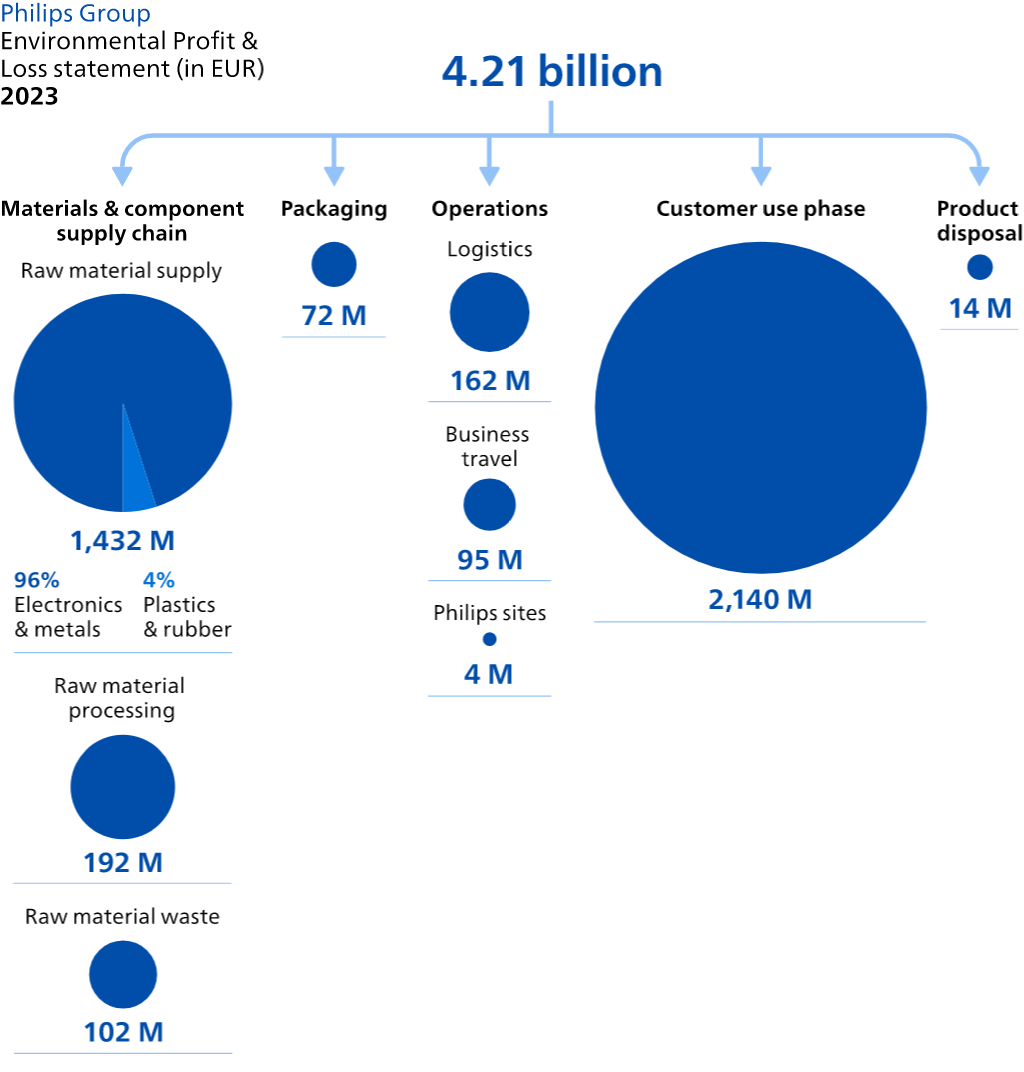
In 2018, we were the first health technology company to have its 2020-2040 targets (including purchased goods and services and the use of sold products) approved by the Science Based Targets initiative – showing our commitment to drive climate action across the value chain, from suppliers to customers, and ensuring that we contribute to the decarbonization required to stay in line with a 1.5 °C global warming scenario, as agreed in the Paris Agreement. Together with the insights gained through the EP&L we will optimize our climate impact by providing our businesses with actionable insights. For more information on our climate performance please refer to Climate Action.
For more information on our efforts to reduce emissions in the supply chain, please refer to Supplier sustainability.
For more information on our efforts to reduce emissions in the customer use-phase, please refer to Green/EcoDesigned Innovation and Green/EcoDesigned and EcoHero Revenues.
At Philips, we see climate change as a serious threat. Research from the Potsdam Institute for Climate Impact Research shows that over 4% of global CO2 emissions are caused by the healthcare sector. Therefore, we are taking action to rethink our business models and decouple economic growth from the impact we have on the environment. We believe large corporates should lead the transition to a low-carbon economy. This will not only benefit the environment, but will also positively impact social and economic aspects.
During the COP21 United Nations Climate Conference in Paris in 2015, we committed to become carbon-neutral in our operations, pursue all efforts to reduce our operational emissions, source all our electricity from 100% renewable sources, and offset all unavoidable emissions by year-end 2020. We delivered on a comprehensive program that included energy-efficiency improvements, on-site renewables, and Power Purchase Agreements, as well as business travel improvements and transport mode shifts to low-carbon-emitting alternatives. As a result, we have significantly reduced our operational carbon footprint.
Since 2020, Philips has been carbon-neutral in its operations (scope 1, scope 2, and scope 3 - business travel and transportation & distribution). Although we prioritize carbon reduction, our comprehensive carbon offsetting program is still necessary to ensure carbon neutrality in our own operations.
Philips Group
Net operational carbon footprint
in kilotonnes CO2 -equivalent
Having achieved our 2020 carbon neutrality target, we have raised the bar and set ambitious emission reduction targets to ensure we help limit the impact of global warming throughout our value chain – collaborating with suppliers and customers to amplify our impact. Philips is committed to addressing climate change by establishing ambitious long-term emission reduction targets, officially approved by the Science Based Targets initiative (SBTi). We have added the emissions from our (scope 3 categories) Purchased Goods & Services and Use of Sold Products retrospectively to define a baseline (2020). With these additions, we cover approximately 96% of our value chain emissions.
For all of our SBTi-approved and 1.5 °C-aligned targets, baselines and performance, please refer to the following table. These targets follow the cross-sector guidance of the SBTi. Philips was the first health technology company to have its targets approved by the SBTi.
Philips Group
Science Based Targets
reduction % compared to baseline
| Scope coverage | 2025 | 2030 | 2040 | ||
|---|---|---|---|---|---|
| Absolute Contraction Approach (ACA) emission reduction targets | Scope 1 & 2 (Baseline 2015) | 100% | -75% | -90% | |
| Scope 3 (Baseline 2020) | 96% | -42% |
In establishing our Greenhouse Gas (GHG) emissions baseline, the selection of the base year is guided by several considerations. More precisely, it is driven by historical data availability, the stability of operations during that period, and the desire to capture a representative snapshot of our emissions profile. In particular, we consider factors such as significant changes in business operations, facility expansions, or the implementation of emission reduction initiatives.
Despite the unprecedented challenges brought about by the COVID-19 pandemic, the year 2020 stands out as a significant year for Philips, marked by a level of relative stability in both customer base and emissions profile. In contrast, the year 2015 was selected as the baseline for scope 1 and 2 emissions due to it being the earliest feasible date for measurement and target-setting in alignment with the Paris Agreement. Should enhancements in data quality or methodological changes lead to an emission deviation exceeding 5% compared to our current baseline emissions, we are committed to restating the baseline in accordance with the Science Based Targets initiative.
By joining forces with customers and suppliers, we can reduce our shared carbon footprint and create a sustainable and more resilient healthcare industry. To deliver, we will focus on the following four objectives, in order of magnitude:
More and more, customers – both in healthcare and retail – are seeking solutions that are less impactful on the environment. To address that demand, we are continuously reducing the climate impact of our products by increasing the energy efficiency of our existing installed base and future product introductions. We see improving energy efficiency as a huge lever to deliver on our value chain emission reductions. More information can be found on our sustainability website.
There is a pressing need for industry and business to manage and reduce CO2-e emissions across the entire value chain – including at supplier level. To this end, we have invited many of our largest suppliers – first-tier manufacturing and transportation-related suppliers – to report their climate performance and strategy as part of the Carbon Disclosure Project (CDP) Supply Chain program. Additionally, we engage with these suppliers to reduce their emissions as part of our Supplier Sustainability program. More information can be found on our sustainability website.
From a climate perspective, applying circular business models can lead to a significant emission reduction. As the value of materials is retained, the need for virgin resources is significantly reduced, and consequently, the need for e.g. energy to produce those virgin materials, leading to reduced emissions. This is also part of our Circular Economy program. More information can be found on our sustainability website.
By continuing to phase out fossil fuels at our sites and increase our global renewable energy share, we will be able to achieve our long-term emission targets (scope 1 and 2). This entails, for example, moving towards geothermal and renewable district heating and cooling solutions where available. More information can be found on our sustainability website.
Our efforts are acknowledged by CDP (formerly known as the Carbon Disclosure Project), a global NGO that assesses the greenhouse gas (GHG) emission performance and management of reporting companies. In 2023, we were ranked on the CDP Climate Change ’A’ List for our continued climate performance and transparency for the 11th consecutive year. None of our peers can claim the same.
Actions related to the achievement of our targets are governed by our Environmental policy, which incorporates input from Philips' regulatory, design, sustainability, supply chain, and operations stakeholders, as well as the voice of our customers to minimize their environmental footprint.
For more information on our Climate Action progress in 2023, please refer to Climate Action.
Philips reports all its emissions in line with the Greenhouse Gas Protocol (GHGP) as further described in Scope of reporting.
A circular economy aims to decouple economic growth from the consumption of natural resources and ecosystems by optimizing their use, eliminating waste and pollution, and circulating products and materials for as long as possible, while giving natural systems the opportunity to regenerate themselves. The way we take, make and use materials has a significant impact on both climate and nature, as 45% of global GHG emissions come from the way products are made and used, and more than 90% of biodiversity loss stems from extraction and processing. Bringing this back to Philips’ impact on the planet, our use of materials accounts for over 40% of our environmental impact based on our EP&L methodology, which includes raw material supply, processing, waste and packaging. Therefore, in addition to the use of renewable resources and energy efficiency, the transition to a circular economy will be essential to meet our global climate goals.
The Circular Economy program at Philips ran for the 11th year in 2023, building on more than 30 years' experience of applying resource efficiency through our sustainability programs. Our ambition is to help our customers to ‘do more with less’ and drive the circular transformation across the value chain together with our partners. We apply Philips’ circularity principles ‘use less, use longer and use again’ across five strategic areas:
Philips Group
Progress towards Philips' 2025 circularity targets
| Metrics | Unit | 2020 Baseline | 2022 Results | 2023 Results | 2025 Targets | Key actions to deliver on 2025 targets |
|---|---|---|---|---|---|---|
| Resource inflows & outflows (products) | ||||||
| Circular revenues | % | 15 | 18.2 | 20.0 | 25 | Grow sales from products, services and solutions that use less virgin materials, optimize and extend product lifetime, recirculate materials |
| Resource inflows & outflows (waste) | ||||||
| Zero waste to landfill | % | 2.6 | 0.0 | 0.0 | less than 0.5 | Minimize waste to landfill |
| Circular materials management | % | 90 | 91 | 91 | 95 | Avoid waste by increasing the recirculation of discarded materials |
| Resource inflows (products) | ||||||
| Close the loop on medical equipment | # | Achieved for large medical equipment | Extend to small medical equipment | Adopt policy ensuring responsible end-of-use management |
Philips has committed to voluntary circularity targets to be delivered by 2025 as part of our externally communicated 2025 Sustainability Commitments. Key actions to deliver on these are stated in the above table. In 2023, Philips increased its circular revenues by 1.8% compared to the previous year, mainly driven by circular design of software and hardware. We implemented sharpened circular revenue requirements to further align with developments on circularity metrics and reporting disclosures. For example, external trends on metrics led to further sharpening of the definition of our software contributions. We also brought our circular revenue reporting more in line with our circular strategy on design and closing the loop.
In 2023, Philips achieved 91% circular materials management, comparable to 2022. We continued the emphasis on our Zero Waste to Landfill KPI, achieving 0.0% waste to landfill, compared to 0.0% in 2022.
We reclaimed more than 11,500 systems or pieces of equipment in 2023. The main driver was our take-back program for patient monitors.
For more information on our Circular Economy program, please refer to Circular Economy.
Philips recognizes the importance of healthy ecosystems and biodiversity for our company, our employees, and society. Therefore, Philips has developed the Natural Capital program, which is an addition to existing sustainability programs. This program is dedicated to reducing Philips’ impacts on natural capital, focusing on our chemicals footprint, water consumption, and improving biodiversity and ecosystem services. By systematically quantifying and reducing the environmental impact of our operations, supply chain and the use-phase of our products, we actively aim to protect and restore biodiversity. Philips acknowledges its dependency and impact on natural capital and aims to iteratively improve its understanding to drive regenerative decisions.
Philips aims to restore and enhance biodiversity and ecosystem services (BES) at our industrial sites and to actively promote ecosystem restoration activities through partnerships with, among others, NGOs, local communities, and governments. The Natural Capital program is focused, taking our 23 manufacturing sites as a starting point; Philips has created a BES community and trained employees on all these sites in ecosystem services. As a result, the ecosystem services of Philips' global manufacturing sites have been mapped and quantified. Based on this data, Philips evaluated the total area and ecological value of each manufacturing site and established the first BES data baseline to measure BES improvements by 2024. Together with our partners, we are working to develop more advanced BES metrics suitable for industrial areas.
In 2022, our manufacturing sites delivered some 80 potential measures to enhance biodiversity on-site. Philips implemented 30% of the biodiversity improvement measures selected for the short term at a number of sites in 2023, e.g. planting native trees in India, creating flower gardens in China, and creating habitats for endangered bee species in Central America. Furthermore, we have published our first Taskforce on Nature-related Financial Disclosures (TNFD) report and aim to set ourselves Science Based Targets for Nature (SBTN) in the future.
Philips aims to expand BES improvements in 2024 and track BES performance at our manufacturing sites with a new ecosystem services mapping according to our Environmental Policy. Improving BES at our manufacturing sites, and thereby also improving the working environment, is a contributor to making Philips the ’best place to work’, one of the ESG commitments Philips announced in 2020. Furthermore, healthy ecosystems support our efforts to mitigate climate risks assessed in our TCFD report for our sites.
As can be derived from our Environmental Profit & Loss (EP&L) account, the environmental impact of Philips’ sites is limited, as they are not very energy-intensive, are 100%-powered with electricity from renewable sources, do not emit large quantities of high-impact substances, and are not water-intensive. At the same time, Philips is aware that the total environmental impact of the full value chain is substantial, especially upstream in the mining industry. Philips considers improving biodiversity on its own land as a first important step towards reducing biodiversity impact over the full value chain.
Having become carbon-neutral in our operations by year-end 2020, and with our drive to send zero waste to landfill, focus on circular materials management, and enhance BES, the environmental impact of our sites will be further optimized in the years to come.
At Philips, we recognize that human health and environmental health go hand in hand. In 2022, the United Nations declared the ability to live in a clean, healthy and sustainable environment a human right.
Climate change poses a threat to health and is expected to cause some 250,000 additional deaths per year globally, according to the World Health Organization. It creates a pressing need – together with global resource constraints, growing and aging populations, and the rise of chronic diseases – for resilient and sustainable healthcare models.
We see a growing demand from our customers, including hospitals, to reduce their environmental impact, reduce waste and decarbonize healthcare. Our Green/EcoDesigned Innovation – the Research & Development spend related to the development of new generations of Green/EcoDesigned products and solutions and Green technologies, addressing SDG 12 (Ensure sustainable consumption and production patterns) – is focused on addressing that impact.
Sustainable Innovation is the Research & Development spend related to the development of new generations of products and solutions that address the United Nations’ Sustainable Development Goals 3 (Ensure healthy lives and promote well-being for all at all ages) or 12.
In 2023, Philips invested EUR 142 million in Green/EcoDesigned Innovation, a decrease compared to 2022 due to more demanding EcoDesign criteria, a growing share of innovation spend in software, for which reporting processes still need to be further implemented, and reduced R&D investments at Philips. We expect Green/EcoDesigned Innovation spend to increase in the years to come, as one of our 2025 ESG commitments is to design all our new product introductions in line with our EcoDesign requirements by 2025. Over EUR 1.5 billion was invested in Sustainable Innovation in 2023.
Philips Group
Green/EcoDesigned Innovation per segment
in millions of EUR
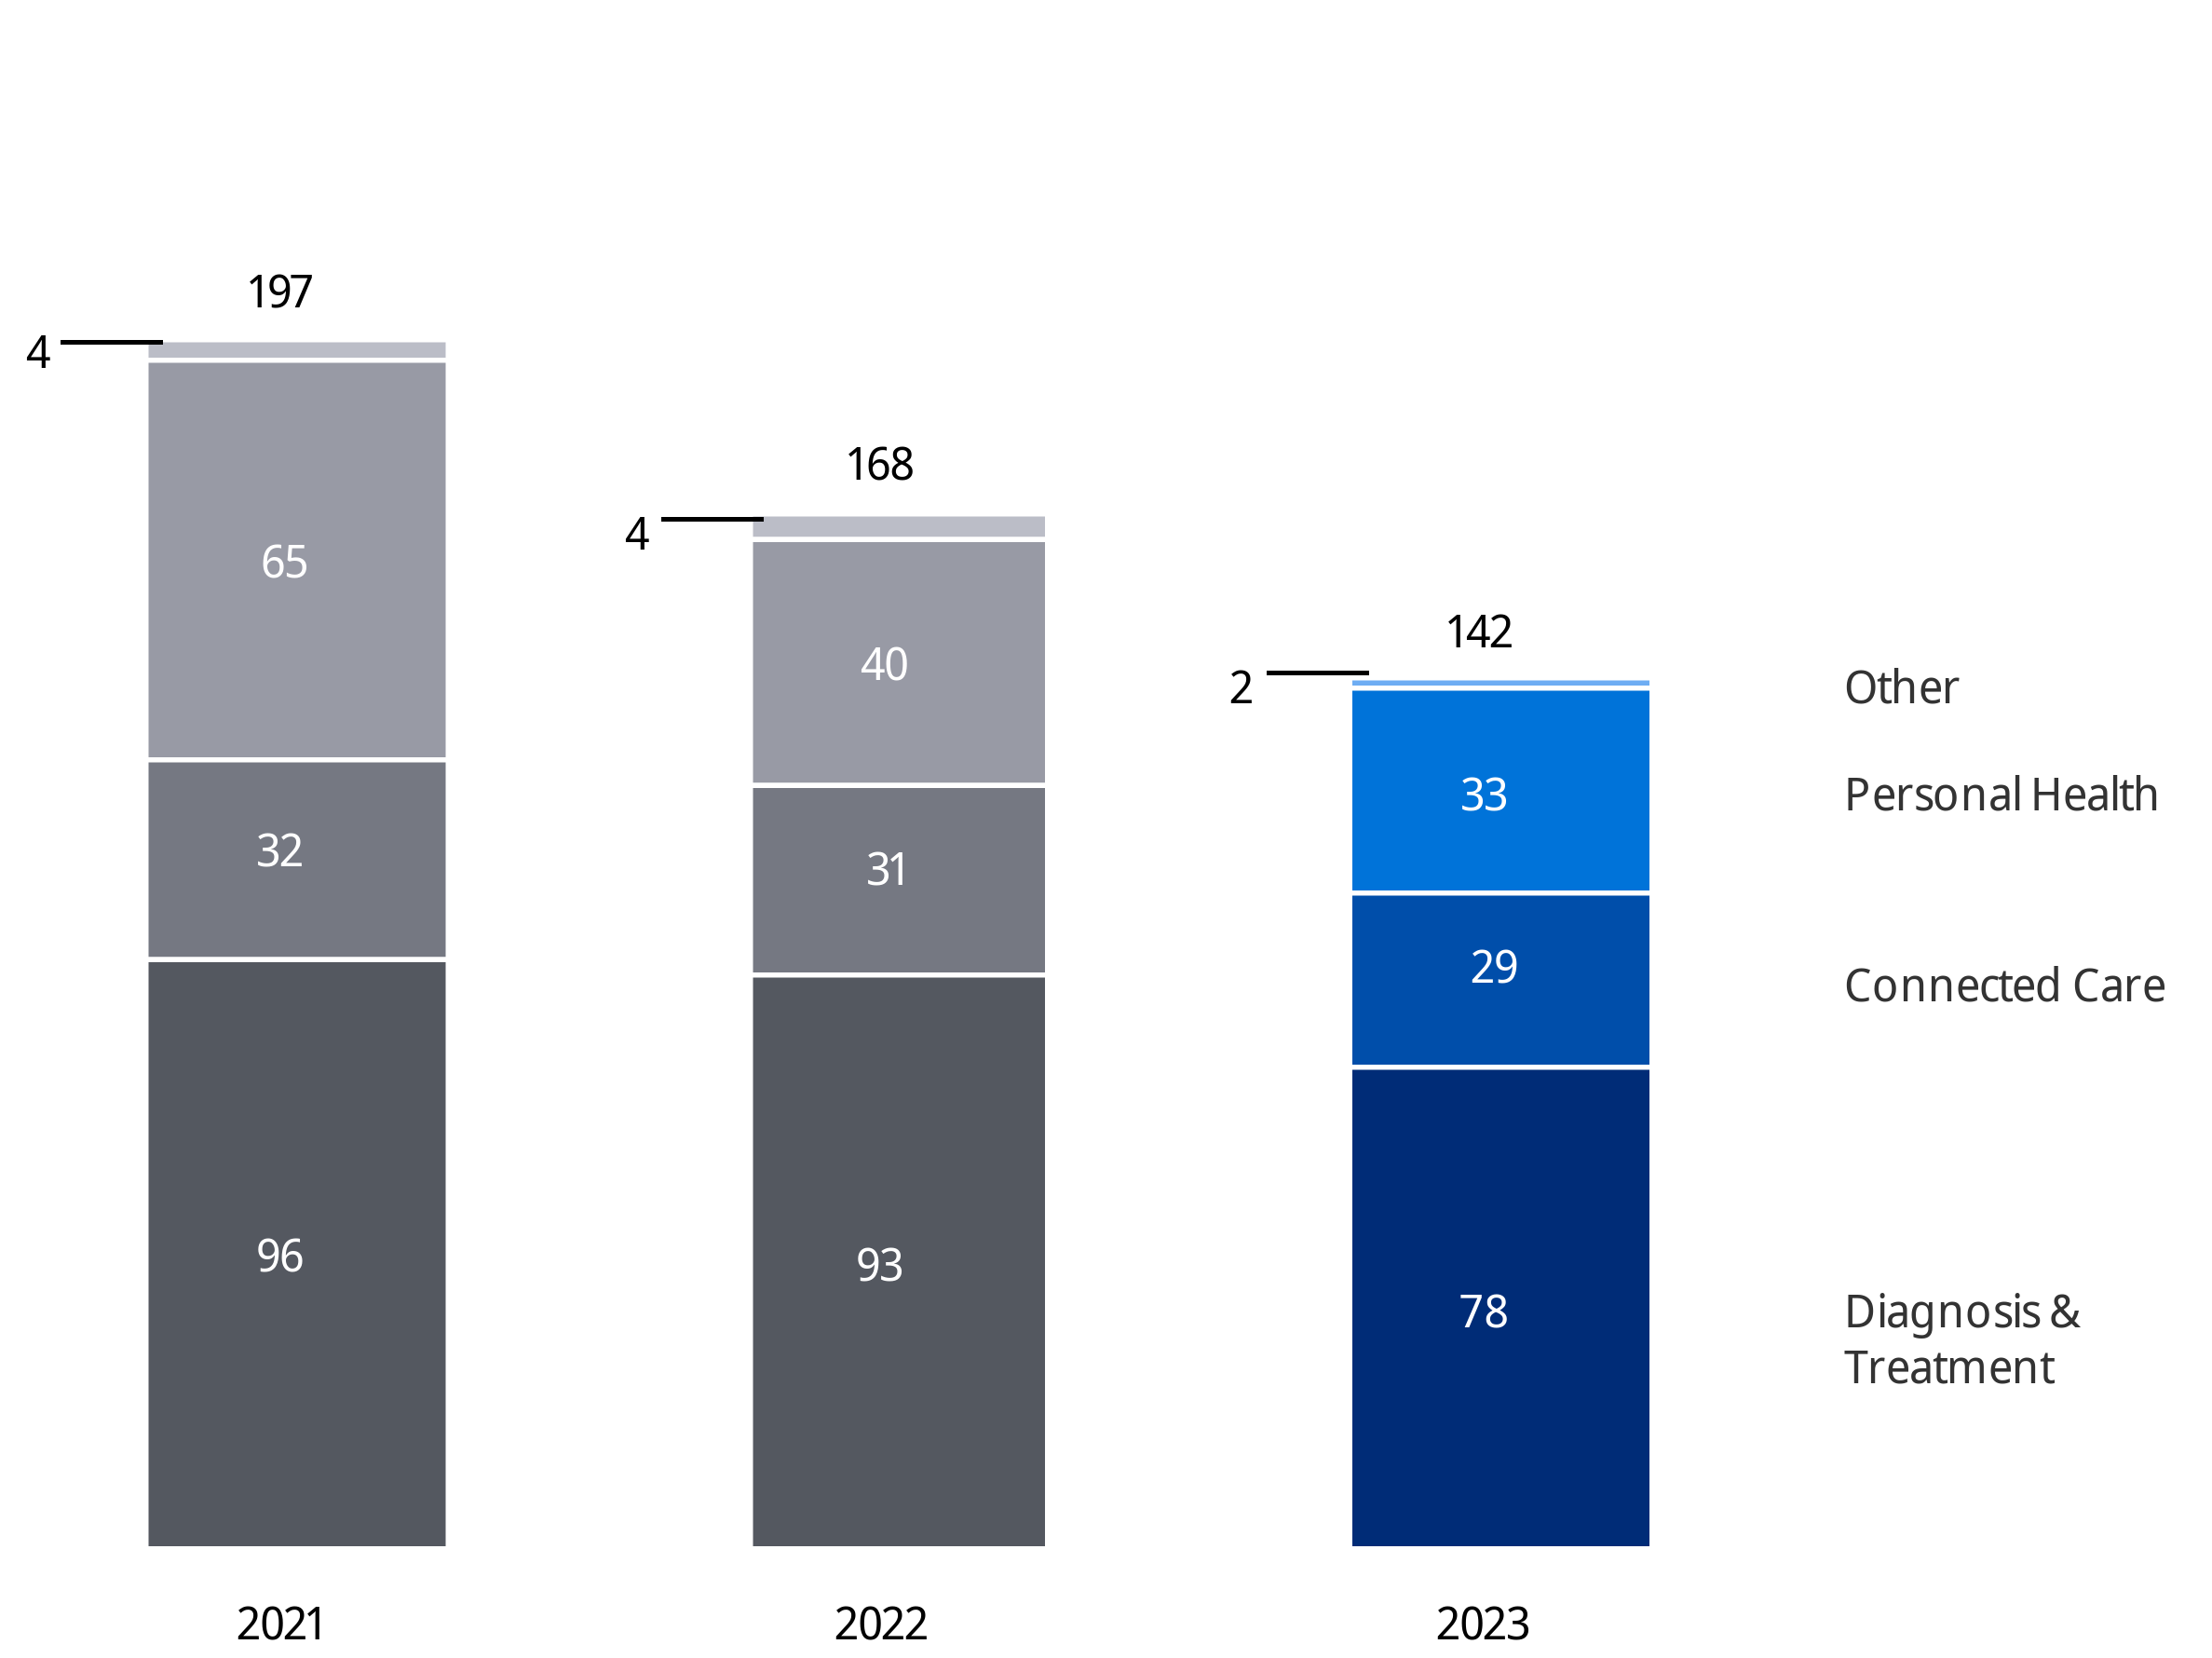
Philips develops innovative solutions that support precision diagnosis and effective, minimally invasive interventions and therapy, while respecting the limits of natural resources. Investments in Green Innovation in 2023 amounted to EUR 78 million, a reduction compared to EUR 93 million in 2022.
We aim to reduce environmental impact over the total lifecycle and our Green/EcoDesign innovations focus on four areas: Energy, Substances, Circularity, and Packaging. Energy efficiency is an area of focus, especially for our large imaging systems such as MRI. Through circular design, Philips also pays particular attention to enabling the reduction in use of virgin materials, for example, through designing for low weight and enabling the upgrading and re-use of our products. As a result, our customers can, for example, benefit from enhancements in workflow, dose management and imaging quality. In addition, we are reducing the substances of concern and improving our packaging. We continued to actively partner with multiple leading care providers to investigate innovative ways to reduce the environmental impact of healthcare, for example by maximizing energy-efficient use of medical equipment (e.g. by introducing EcoModes) and optimizing lifetime value. Philips closed the loop on large equipment by the end of 2020, by structurally embedding a responsible take-back policy into its customer trade-in offers. This means that for all equipment that a customer is willing to trade-in at end of use, Philips will take it back for refurbishment and parts recovery where feasible, or locally recycle it in a certified way to ensure it does not end up in landfill. Sustainable design and innovation help to further increase the value created and decrease the environmental impact Philips can deliver from returned systems.
Philips’ connected health solutions integrate, collect, combine and deliver quality data for actionable insights to help improve access to quality care, while respecting the limits of natural resources. It is our belief that well-designed e-health solutions can reduce the travel-related carbon footprint of healthcare, increase efficiency in hospitals, reduce waste, and improve access to care and outcomes. For example, our Philips Radiology Operations Command Center enables real-time collaboration and virtual imaging operations and can decrease staff travel time and costs. The value and adoption of e-health solutions also became apparent during the COVID-19 crisis. Green/EcoDesigned Innovation investments in 2023 amounted to EUR 29 million, in line with EUR 31 million in 2022. Over the coming years, Green/EcoDesigned Innovation projects will deliver, among other things, new EcoDesigned patient monitors with lower environmental footprints.
R&D investments at our Personal Health segment amounted to EUR 33 million in 2023, compared with EUR 40 million in 2022. Personal Health continued its work on improving the energy efficiency of its products, and the voluntary phase-out of polyvinyl chloride (PVC), brominated flame retardants (BFR), Bisphenol A (BPA) and phthalates from, among others, food contact and childcare products. New hairdryers have been launched that are more energy-efficient, with an improvement of more than 10% compared to the 2020 baseline. Personal Health also continues to increase circularity by, for example, using recycled materials in products and packaging. For packaging, we are increasingly shifting away from single use plastic materials. As part of our Fit for Future Packaging program, we have launched additional paper-based, mailbox-ready packaging solutions in our Grooming & Beauty portfolio, including OneBlades and hairdryers.
The segment Other invested EUR 2 million in Green/EcoDesigned Innovation, spread over projects focused on global challenges relating to water, air, energy, food, circular economy, and access to affordable healthcare.
For more information on our Circular Economy activities and the progress towards targets in 2023, please refer to Circular Economy.
Green/EcoDesigned Revenues are generated through products and solutions that offer a significant environmental improvement in one or more Green Focal Areas – Energy efficiency, Packaging, Substances, and Circularity – and thereby deliver a contribution to SDG 12 (Ensure sustainable consumption and production patterns). Green/EcoDesigned Revenues amounted to EUR 12.8 billion in 2023, or 70.5% of sales, comparable to 2022 (71.7% in 2022).
As the first EU Taxonomy delegated act, addressing Climate Change Adaptation and Climate Change Mitigation, only applies to sectors with the highest CO2 emissions, Philips’ activities are not within the scope of this delegated act and consequently none of Philips' revenues were eligible under this taxonomy during 2023.
Philips Group
Green/EcoDesigned Revenues per segment
in millions of EUR unless otherwise stated
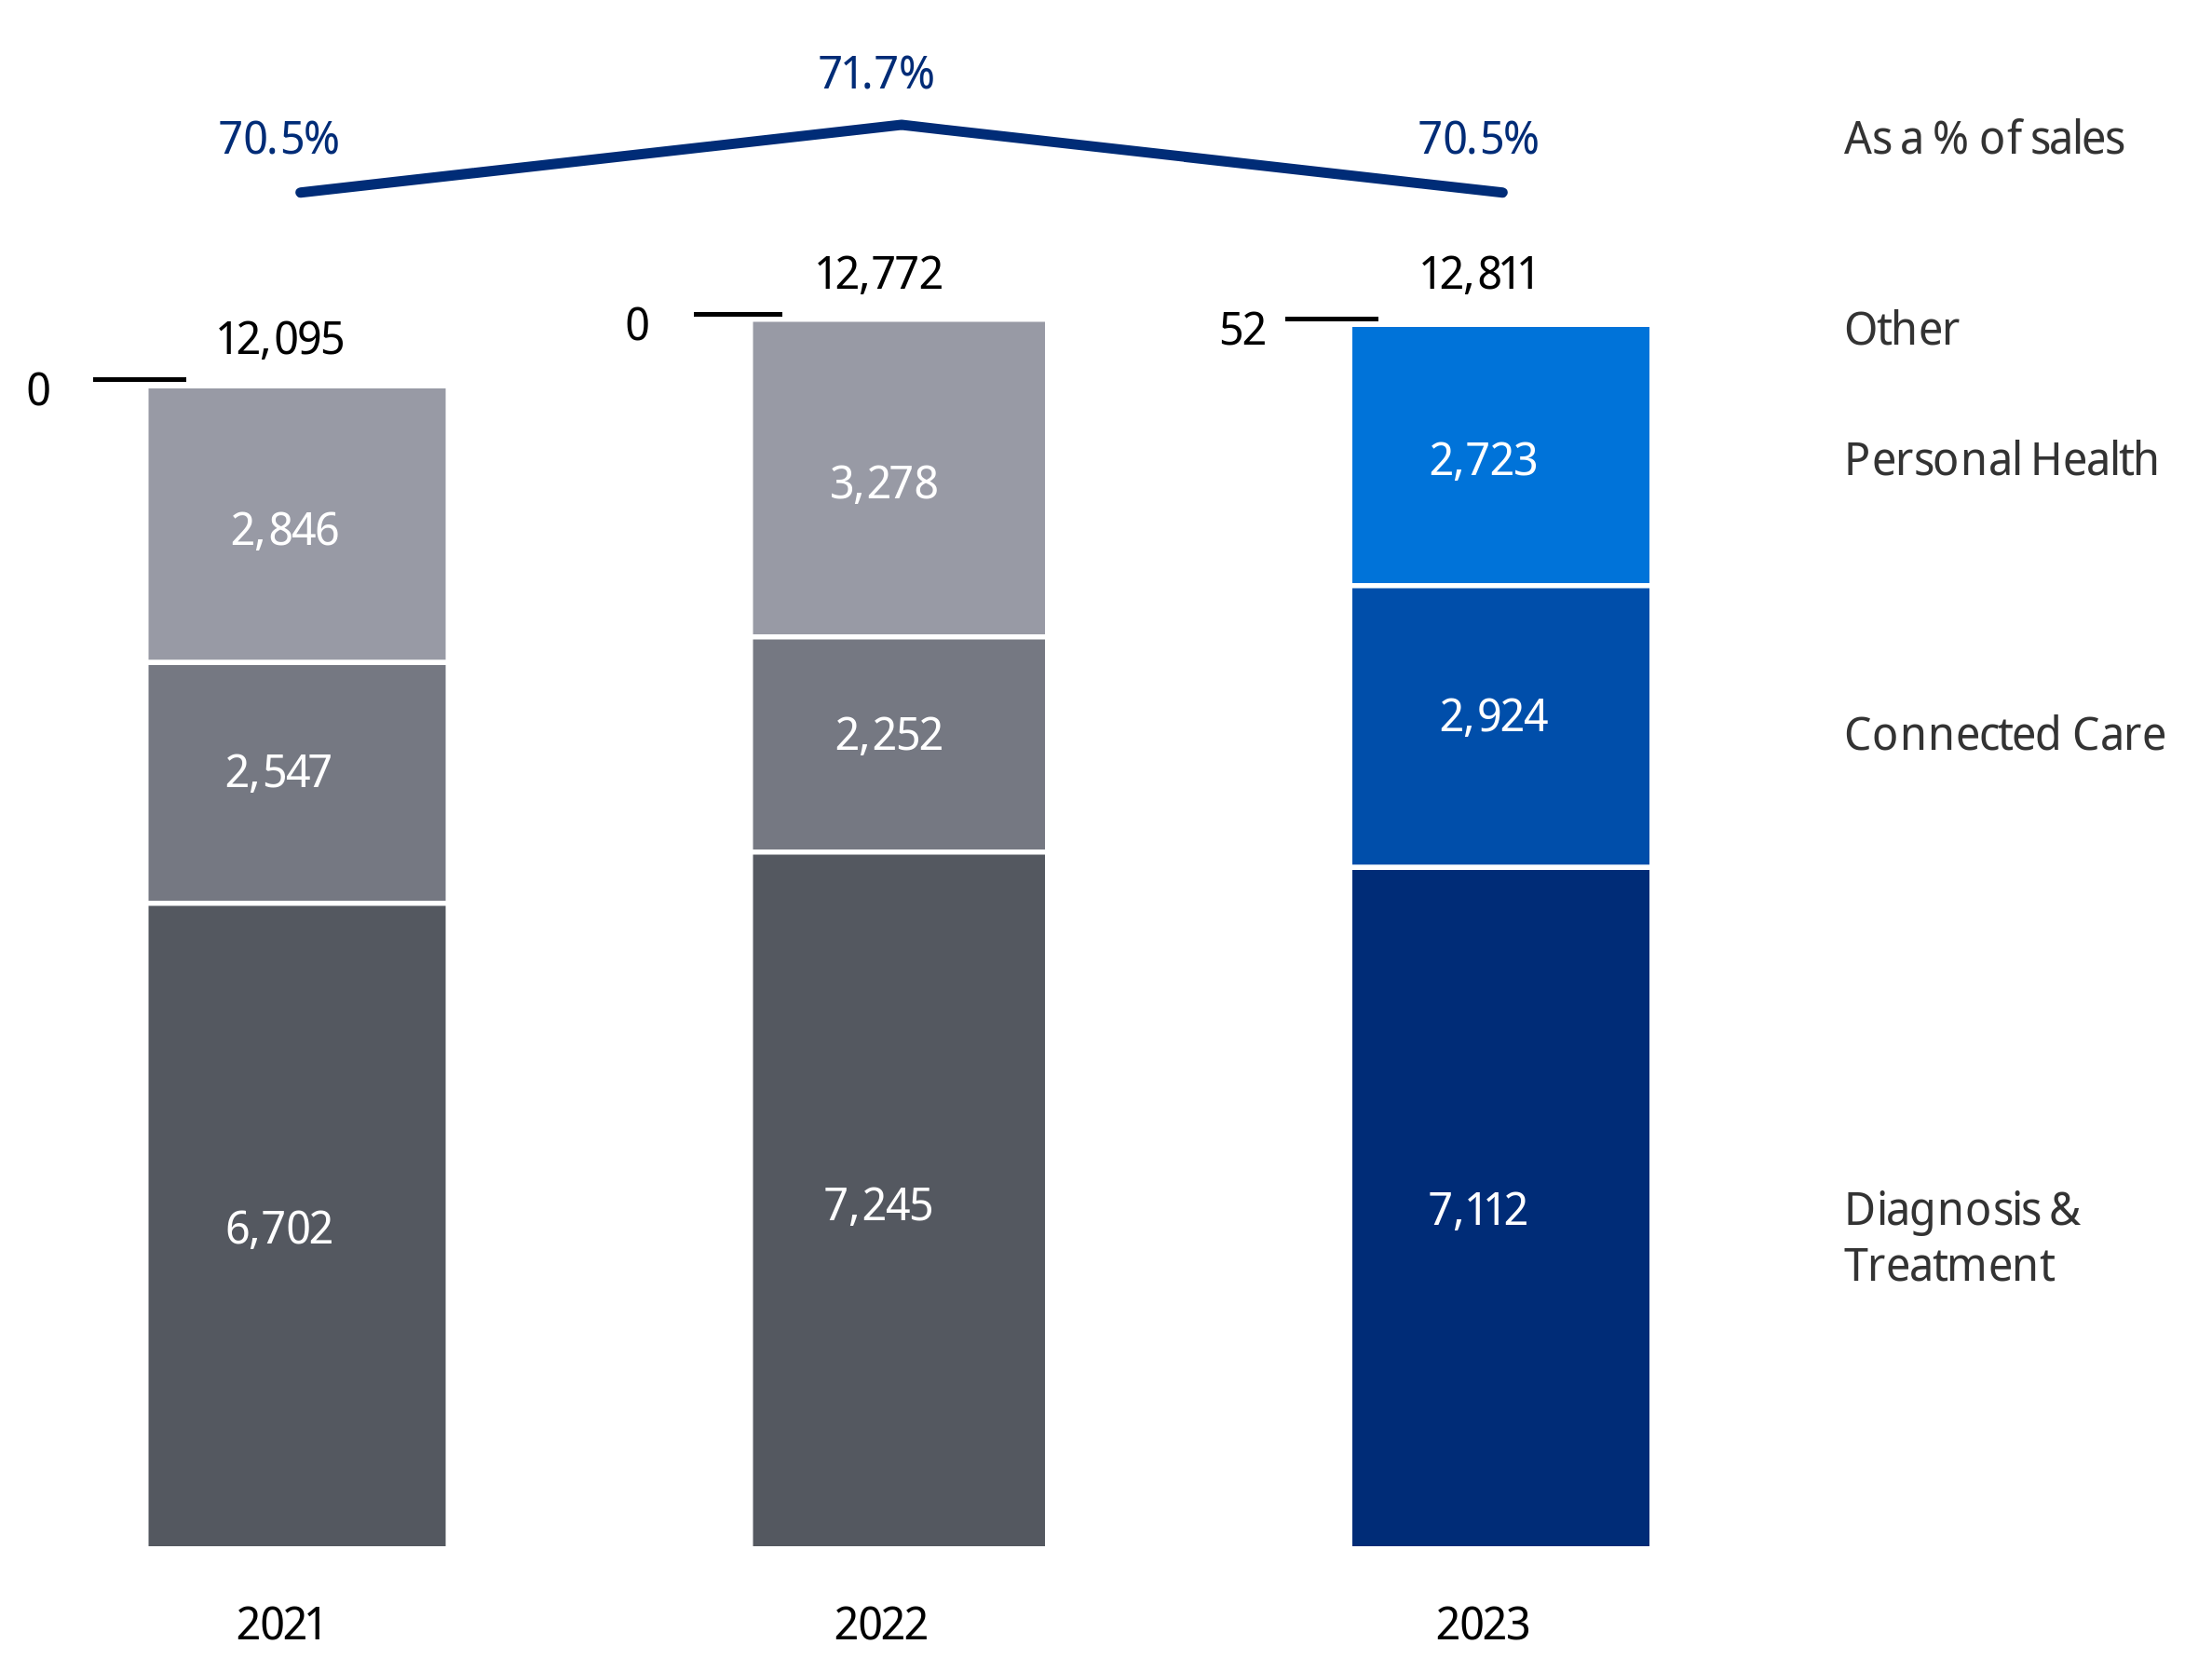
Through our EcoDesign process we aim to create products and solutions that have significantly less impact on the environment over their whole lifecycle. Overall, the most significant improvements have been in energy efficiency and lower weight (thus less resources), although increased attention was also given to substances of concern, packaging and circular design, in particular design for recyclability, in all segments in 2023.
By 2025, 25% of hardware revenues should come from EcoHeroes, which meet the EcoDesign requirements and outperform in at least one of the focal areas compared to their predecessor or relevant benchmarks, supported by a sustainability claim. In 2023, Philips achieved 15.9% in EcoHero Revenues, with most contributions from improvements in energy use.
In 2023, a number of main platforms were launched. Specific attention was paid to preparing for future EcoDesigned product launches.
New Green/EcoDesigned products in Connected Care are expected in 2024 and beyond, with improvements in all EcoDesign focal areas.
In our Personal Health business, the focus is on Green/EcoDesigned Products and Solutions that meet or exceed our minimum requirements in the areas of energy consumption, packaging, substances of concern, and application of recycled plastics. We continue to make progress in developing PVC/BFR-free products. More than 90% of our consumer product sales consist of PVC/BFR-free products, with the exception of power cords, for which there are not yet economically viable alternatives available. In our Oral Healthcare portfolio, we introduced the first brush heads containing 75% bio-based materials. In our Mother & Child Care portfolio, we launched the first baby monitor with recycled plastic. And we implemented recycled plastic in the interior parts of a significant proportion of the Male Grooming portfolio.
Philips’ Sustainable Operations programs focus on the main contributors to climate change, with the aim of reducing, re-using and/or recycling waste, reducing water consumption, and reducing emissions.
Full details can be found in ESG statements.
Annually, we undertake thorough assessments of both our operational sites and strategic suppliers to address potential water-related risks. We utilize publicly accessible tools such as the Aqueduct Water Risk Atlas by WRI and WWF Water Risk Filter to define and respond to these risks. This comprehensive process evaluates the susceptibility of our sites to various risks including water availability, wastewater quality, workplace water accessibility, and groundwater replenishment, encompassing physical, regulatory, and reputational concerns.
While Philips is not a water-intensive organization, this practice ensures the uninterrupted continuity of our operations and the provision of high-quality Water, Sanitation and Hygiene (WASH) services at all our sites and those of our strategic suppliers. Among our facilities, five locations have been identified as exposed to substantive financial and strategic risks related to water. These sites are situated either in areas highly vulnerable to coastal flooding or extremely high-water stress (>80%), with three in China, one in Indonesia, and one in the USA. In response, we have deployed engineers and experts to conduct further investigations, accurately identify risk exposure, anticipate potential losses, and implement proactive measures to mitigate property loss and business interruption.
We are proud to have received an 'A' score for disclosure transparency on water security in the CDP Europe 2023, demonstrating our ongoing commitment to water risk management and sustainability practices.
Total water withdrawal in 2023 was 661,076 m3, a 3% decrease compared to 2022 and a 7% reduction compared to 2019 (pre-COVID level).
Diagnosis & Treatment, which consumes 49% of total water usage, recorded a 5% increase, mainly caused by lower amounts of reused water in a site in North America. Personal Health recorded a 7% decrease. In 2022, one of our manufacturing sites in Asia experienced a water leakage which resulted in higher water intake in that year. This leakage was remedied. Connected Care showed a decrease of 11%, due to decreased production volumes at a site in Asia.
Philips Group
Water withdrawal
in thousands of m3
| 2019 | 2020 | 2021 | 2022 | 2023 | |
|---|---|---|---|---|---|
| Diagnosis & Treatment | 295 | 286 | 337 | 310 | 324 |
| Connected Care | 150 | 116 | 119 | 111 | 99 |
| Personal Health | 265 | 221 | 247 | 257 | 238 |
| Philips Group | 710 | 623 | 703 | 678 | 661 |
In 2023, 99.6% of water was purchased and 0.4% was extracted from groundwater wells.
In 2023, our manufacturing sites generated 19,375 tonnes of waste, a decrease of 15% compared to 2022, mainly driven by the lower construction activities in different locations across the globe, lower paper/cardboard and plastic waste due to reduced production volumes at some sites and more efficient waste management. The reported re-used materials were 9% of the total waste.
Diagnosis & Treatment decreased waste by 12%, mainly driven by the decreased volume of one-time construction related re-used materials and lower construction activity, which was partially offset by the operational changes. Connected Care decreased waste by 21% due to the significant decrease in shipment packaging materials related to the recall, increased volume of re-used materials and operational changes. Personal Health reduced waste by 17% due to operational changes, lower production volumes and the start of a smart warehouse, that significantly reduced amounts of wood pallets and cardboard wastes by using reusable plastic trays.
Philips Environmental Policy addresses the waste hierarchy stating that Philips drives action by ensuring circular manufacturing and supply to increase circular practices at our sites and responsible waste management according to the waste hierarchy.
Philips Group
Total waste
in tonnes
| 2019 | 2020 | 2021 | 2022 | 2023 | |
|---|---|---|---|---|---|
| Diagnosis & Treatment | 9,675 | 19,703 | 9,974 | 10,694 | 9,422 |
| Connected Care | 4,095 | 3,475 | 2,753 | 2,899 | 2,276 |
| Personal Health | 8,758 | 7,929 | 9,477 | 9,209 | 7,677 |
| Philips Group | 22,528 | 31,107 | 22,204 | 22,802 | 19,375 |
Until 2020, total waste consisted of waste that is delivered for landfill, incineration, waste to energy or recycling. We extended the scope with materials sent for re-use and other recovery as of 2021. Total waste does not include waste prevented.
Materials delivered for re-use, other recovery or recycling via an external contractor amounted to 17,446 tonnes, which equals 90% of the total waste. Materials delivered to incineration and landfill amounted to 1,929 tonnes, which equals 10% of the total waste, of which 74% comprised non-hazardous waste and 26% hazardous waste. We recorded 1,531 tonnes of waste prevented in our own activities in 2023, compared to 1,484 tonnes in 2022. Philips did not produce any radioactive waste in 2023.
Philips Group
Total waste by destination
in tonnes
| Total waste generated | Hazardous waste | Non-hazardous waste | |
|---|---|---|---|
| Re-use | 1,651 | 1 | 1,650 |
| Recycling | 15,762 | 1,536 | 14,226 |
| Other recovery | 33 | - | 33 |
| Waste diverted from disposal by recovery operation | 17,446 | 1,537 | 15,909 |
| Incineration (with energy recovery) | 1,480 | 199 | 1,281 |
| Incineration (without energy recovery) | 298 | 294 | 4 |
| Landfill | 1511) | 4 | 147 |
| Waste directed to disposal by disposal operation | 1,929 | 497 | 1,432 |
| Total waste generated | 19,375 | 2,034 | 17,341 |
The total waste destinations are fully categorized above. There is no waste generated that is destined for other disposal methods. Our sites addressed both the Circular Materials Management percentage as well as waste sent to landfill, as part of our ESG commitments; refer to Definitions and abbreviations for the definition of Circular Materials Management.
The Circular Materials Management percentage has replaced the recycling percentage in 2021. In 2023, it remained at 91%, the same level as in 2022.
Our Zero Waste to Landfill KPI excludes one-time-only waste and waste delivered to landfill due to regulatory requirements. According to this definition, in 2023 we reported 2.7 tonnes of waste sent to landfill, a small increase compared to 1 tonne in 2022. All our 23 industrial sites achieved Zero Waste to Landfill status at the end of 2023.
Philips Group
Total waste by composition
in tonnes
| Waste generated | Waste diverted from disposal | Waste directed to disposal | |
|---|---|---|---|
| Wood waste | 4,140 | 4,104 | 36 |
| Paper/cardboard waste | 3,527 | 3,522 | 5 |
| Metal waste | 3,338 | 3,291 | 48 |
| Plastic waste | 2,381 | 2,237 | 144 |
| Municipal (mixed) waste | 2,136 | 1,156 | 980 |
| Chemical waste | 2,020 | 1,532 | 487 |
| Electrical and electronic waste | 626 | 622 | 4 |
| Other | 1,208 | 983 | 225 |
For all waste types and waste destinations, preparation for proper treatment takes place. This preparation is case specific; in some cases it includes separation, inspection and cleaning.
Philips included reduction targets for the substances that are most relevant for its businesses in its ESG commitments. For more details on emissions from substances, please refer to Sustainable Operations .
As a leading health technology company, it is our purpose is to improve people’s health and well-being through meaningful innovation, in line with UN SDG 3 ‘Ensure healthy lives and promote well-being for all at all ages’. In pursuing this purpose, we act responsibly towards society and partner with our stakeholders.
We aim to be the best place to work for people who share our passion, promoting personal development, inclusion and diversity.
Lack of access to affordable, quality care is one of the most pressing issues of our time. Climate change is exacerbating this situation and putting the lives of millions of people at risk. At Philips, we are conscious of our responsibilities towards society and the planet. It is our purpose to improve people’s health and well-being through meaningful innovation. As such, we aim to improve the lives of 2.5 billion people a year by 2030. To ensure we remain on track to achieve this goal, we have developed an integrated approach that tells us how many lives have been improved by our products and solutions in a given year. We call this our Lives Improved model.
The Lives Improved model helps us to track our performance on a country-by-country basis in line with UN Sustainable Development Goal 3, allowing us to shape strategies to ensure healthy lives and promote well-being for all at all ages.
In 2023, Philips improved 1.88 billion lives, an increase of around 67 million compared to 2022. This increase was driven by steady growth across all segments, improved statistics and the addition of the Ambulatory Monitoring & Diagnostics (AM&D) and Clinical Data Services (CDS) business units in the Lives Improved model. From a zone perspective, we saw significant growth mainly in Latin America, Asia Pacific, Japan, Indian Subcontinent, Middle East & Turkey, and Africa.
Philips believes that improving access to healthcare requires meaningful innovation. It also requires a deep understanding of the relationship between all stakeholders and their specific needs in underserved communities. We have an additional commitment to improve the lives of 300 million people in underserved communities with our health-related products by 2025, rising to 400 million by 2030. This commitment allows us to increase our focus on those populations where we can make a positive impact by providing access to effective and affordable healthcare for those in greatest need. By combining the strengths of Philips, Philips Ventures, Philips Foundation, and its partners, we can provide better healthcare and improve health outcomes for all. In 2023, our health-related solutions improved the lives of 221 million people in underserved communities (an increase of some 20 million compared to 2022).
For more information, please refer to our Lives Improved methodology document.
The following table shows the number of Lives Improved per region/zone.
Philips Group
Lives improved per region/zone
| Lives Improved (million) | Population (million) | Saturation rate (as % of population) | |
|---|---|---|---|
| APAC | 132 | 1,023 | 13% |
| Benelux | 26 | 30 | 86% |
| Central Eastern Europe | 79 | 166 | 48% |
| DACH | 87 | 101 | 86% |
| France | 46 | 69 | 66% |
| Greater China | 506 | 1,442 | 35% |
| Iberia | 48 | 58 | 83% |
| IIG | 47 | 81 | 58% |
| Indian Subcontinent | 99 | 1,628 | 6% |
| Japan | 49 | 125 | 39% |
| Latam | 169 | 650 | 26% |
| META | 113 | 1,763 | 6% |
| Nordics | 21 | 28 | 74% |
| North America | 363 | 372 | 98% |
| Russia, Central Asia | 52 | 253 | 21% |
| UK & Ireland | 42 | 73 | 58% |
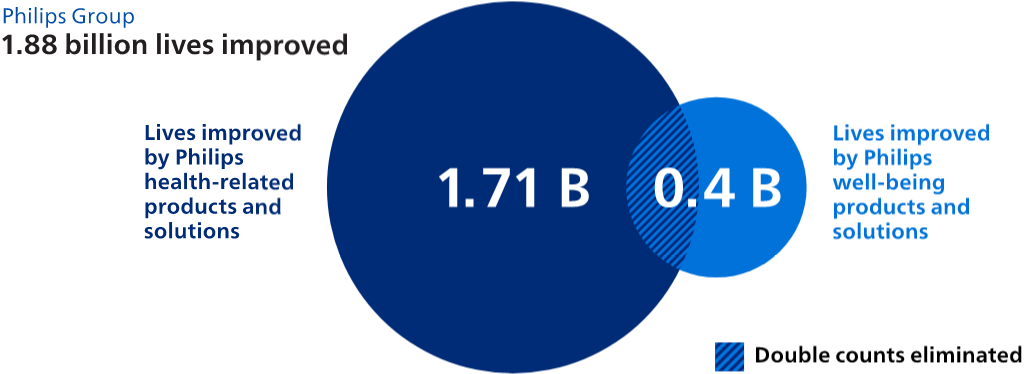
2023 has been a year of change, focused on building the foundation to deliver greater impact in all we do by addressing challenges and shifting to our new operating model, whilst continuing to deliver for patients, customers and consumers. We laid the groundwork for our updated People strategy and the key pillars of growing our people, igniting our culture, simplifying how we work, and bringing oxygen to the organization through simple adaptive people processes and a focus on well-being and inclusion.
Aligned with these pillars, we continued driving the broader Talent agenda, with a strong focus on Executive Committee successor identification and development. This resulted in two internal executive appointments, our new Chief People Officer and Market Leader North America, and the appointment of two critical external executive female talents, Chief Business Leader Monitoring & Connected Care and Chief Medical Officer, further strengthening our MedTech expertise. We continued to support the development of our internal talents resulting in 33% internal mobility (vs. target 30%) and further improved our diversity ambitions with over 31% women in senior leadership. Overall, employee turnover is slightly up to 17.6% from 2022 (17.5%) and top talent has seen an increase to 12.3% from 10.2% in 2022.
In 2023, we began reinvigorating our culture using a phased approach to emphasize action over words, laying the groundwork for scaling this work in 2024. This included working on our culture through our most pressing challenges with the Philips Leadership Team and how to understand our disabling patterns as an organization so that we can begin to disrupt them. Deeper culture work was started in the businesses with specific needs, and preparations to ignite, embed and embody our culture at scale are under way. This culture work will run in parallel with our priority of scaling development for all 7,500 people leaders. Building on 2023 progress, we will enable leaders to model the skills and behaviors that align with our refreshed culture and position us to deliver results through our teams.
As a result of the shift in the operating model, we have made progress in simplifying how we work and are trending below the target headcount (69,656 actual vs. 72,295 target). Despite the amount of change in the organization, we saw an improvement in engagement scores between March and October 2023 by 5% to 73% indicating that the organization is starting to recover from the change, although the number is still below 2022 (78%) and benchmark levels.
In 2023, we gained momentum towards our strategy of becoming a more people-centric organization and we have put in place the foundations that will help us to deliver value with sustainable impact through our people.
Our culture is crucial to meeting our goal of improving the lives of 2.5 billion people by 2030. The way we act and behave shapes our shared understanding of what is important and how we deliver. As a leader in health technology, we are on a journey to reinvigorate our culture so that we become even more people-focused, reduce complexity, and drive greater accountability to meet the needs of our patients, consumers, and customers more consistently.
We have launched a new global People strategy to accelerate this mission and significantly shape our organizational culture. This strategy rests on three pillars. Firstly, we simplify and enhance our core operations to empower employees to address pressing needs efficiently, all to prioritize patient safety and customer experience. Secondly, we focus on nurturing our workforce's skills and capabilities, adapting to the ever-evolving health technology industry. Thirdly, we instill a culture of inclusivity and belonging by integrating health, well-being, and diversity into our work practices, ensuring that every employee feels valued and connected to our shared mission. These pillars form the foundation of our talent ecosystem and reflect our commitment to fostering innovation and excellence on a global scale.
But our culture is more than words; it is also shaped by how our organization is structured. Our new operating model, implemented in 2023, defines how we work in a regulated environment to safely develop innovations that improve people's health and well-being responsibly and sustainably. We prioritize patient safety, quality, compliance, and integrity in everything we do. With this new structure, our culture-defining initiatives and programs are expected to have a greater impact as we focus on consistency and tangible action.
For example, in October we held a global Timeout for Patient Safety and Quality, where our entire company took time to reflect on how our daily work affects patient safety and quality, where we can commit to taking personal and collective responsibility, and how to create a culture centered on patients and people. Initiatives like this, along with targeted learning activities like our Clinical and Medical Learning Hub, which provides world-class clinical training and resources, contribute to making our culture ‘real’ and deliver a sense of pride for our people.
Considering the ever-changing economic, political, and health environment, we also remain flexible in our approach to how we work. We continue to adapt our hybrid model for more flexibility and collaboration, with a stronger focus on policies and programs that prioritize people and are tech-enabled for easier access and efficiency. This means we continue to:
This comprehensive and people-centric strategy – combined with our operating model and targeted interventions – is designed to transform Philips into an even more agile, high-performing organization with a thriving culture at the core.
Through 2023, our Strategic Priority recruitment team continued to focus on delivery of the roles most critical to the delivery of our strategy. Together, the Strategic Priority team delivered 1,427 hires within R&D, Q&R and Clinical roles at Corporate Grade 70 and above, and all Informatics roles. To further enhance our workforce of the future, Talent Acquisition delivered 20.2% of external candidates with MedTech experience.
Our Philips-wide Graduate Development Program (GDP) continues to perform well and increased from 40 participants in 2021 to 240 in 2023. The GDP lasts two years and includes two job rotations, as well as offering the graduates a comprehensive learning and development track, and access to career centers to help guide future steps. Philips also gave meaningful work experience to 1,802 interns, offering 321 of them permanent employment after their internship.
We continue our Total Workforce Strategy, which considers all sources of skills, capabilities, locations and changes in the labor market in order to deliver the Workforce of the Future. Our Right Shoring & Sourcing methodology is used to implement this strategy. This methodology steers improvements in workforce composition towards the ‘right shore’ (onshore, nearshore and offshore) and the ‘right source’ (employees, contingent workers and external services). The program delivered EUR 11.4 million in savings in 2023.
In 2023 we started with the implementation of our external workforce strategy. In addition, we have been looking at how we are attracting contingent workforce talent. Direct sourcing has been expanded to 32% in the Netherlands, to 14% in the United States, and has been rolled out to India. To strengthen the way we directly source contingent workforce talent, our own Philips employer value proposition is utilized for the different Functions to attract these contingent workers.
More information on training and learning programs can be found in People development.
As a health technology leader, we attach great importance to the health and well-being of our workforce and to creating an environment of inclusion and belonging, where all employees feel psychologically safe. Our company’s success depends on our employees feeling valued, respected, and empowered to contribute fully. We are a diverse team made up of approximately 70,000 individuals across over 100 countries, all with different backgrounds, perspectives, and experiences. We fully value and leverage these differences to ensure that creativity and innovation can flourish. Philips’ commitment towards Inclusion & Diversity is reflected in our General Business Principles and the company-wide Inclusion & Diversity Policy and Fair Employment Policy.
We continue to put in place measures to enhance representation of diverse talent at all levels within the organization, and to ensure that representation at senior management levels reflects the diversity of our stakeholders, including consumers, our customers and their patients.
To this end, in 2022, Philips restated its commitment to having 35% of senior management positions held by women, by the end of 2025. Senior management positions (including senior directors and executives) amount to approximately 1,155 employees, 363 females (31.4%), 792 males (68.6%) at the end of 2023. As of year-end 2023, we had reached our initial goal (set in 2020) of a 30% representation of women in senior management.
Our Supervisory Board has adopted the Diversity Policy for the Supervisory Board, Board of Management and Executive Committee, which also includes the Supervisory Board’s aim that at least one-third of the members of each of the Board of Management and the Executive Committee are women and at least one-third are men. For more information on the Diversity Policy, please refer to Report of the Corporate Governance and Nomination & Selection Committee.
At year-end, the three members of the Board of Management remained male, with three out of 10 members of the Executive Committee being female. The Executive Committee numbers reflect a slight increase compared to 2022, where there were two women out of twelve in total, pending expected announcements of new leaders. The company generally seeks to fill vacancies by considering candidates that bring a diversity of (amongst others) gender. The selection of candidates is based on merit and there have been and may be pragmatic reasons – such as other relevant selection criteria and the availability of suitable candidates – that have impacted the achievement of our gender diversity goals.
Long-term Inclusion & Diversity ambitions are embedded in our People strategy. In our ongoing effort to increase transparency and accountability, we share data on the representation of women throughout our Businesses, Regions and Functions, including a monthly review with the Executive Committee. We closely monitor the inflow, advancement and outflow of talent, which makes it possible to customize goals and intervene where appropriate. We continue important initiatives that address unconscious bias, health and well-being, inclusion and development of underrepresented talent.
Philips Group
Gender diversity
in %
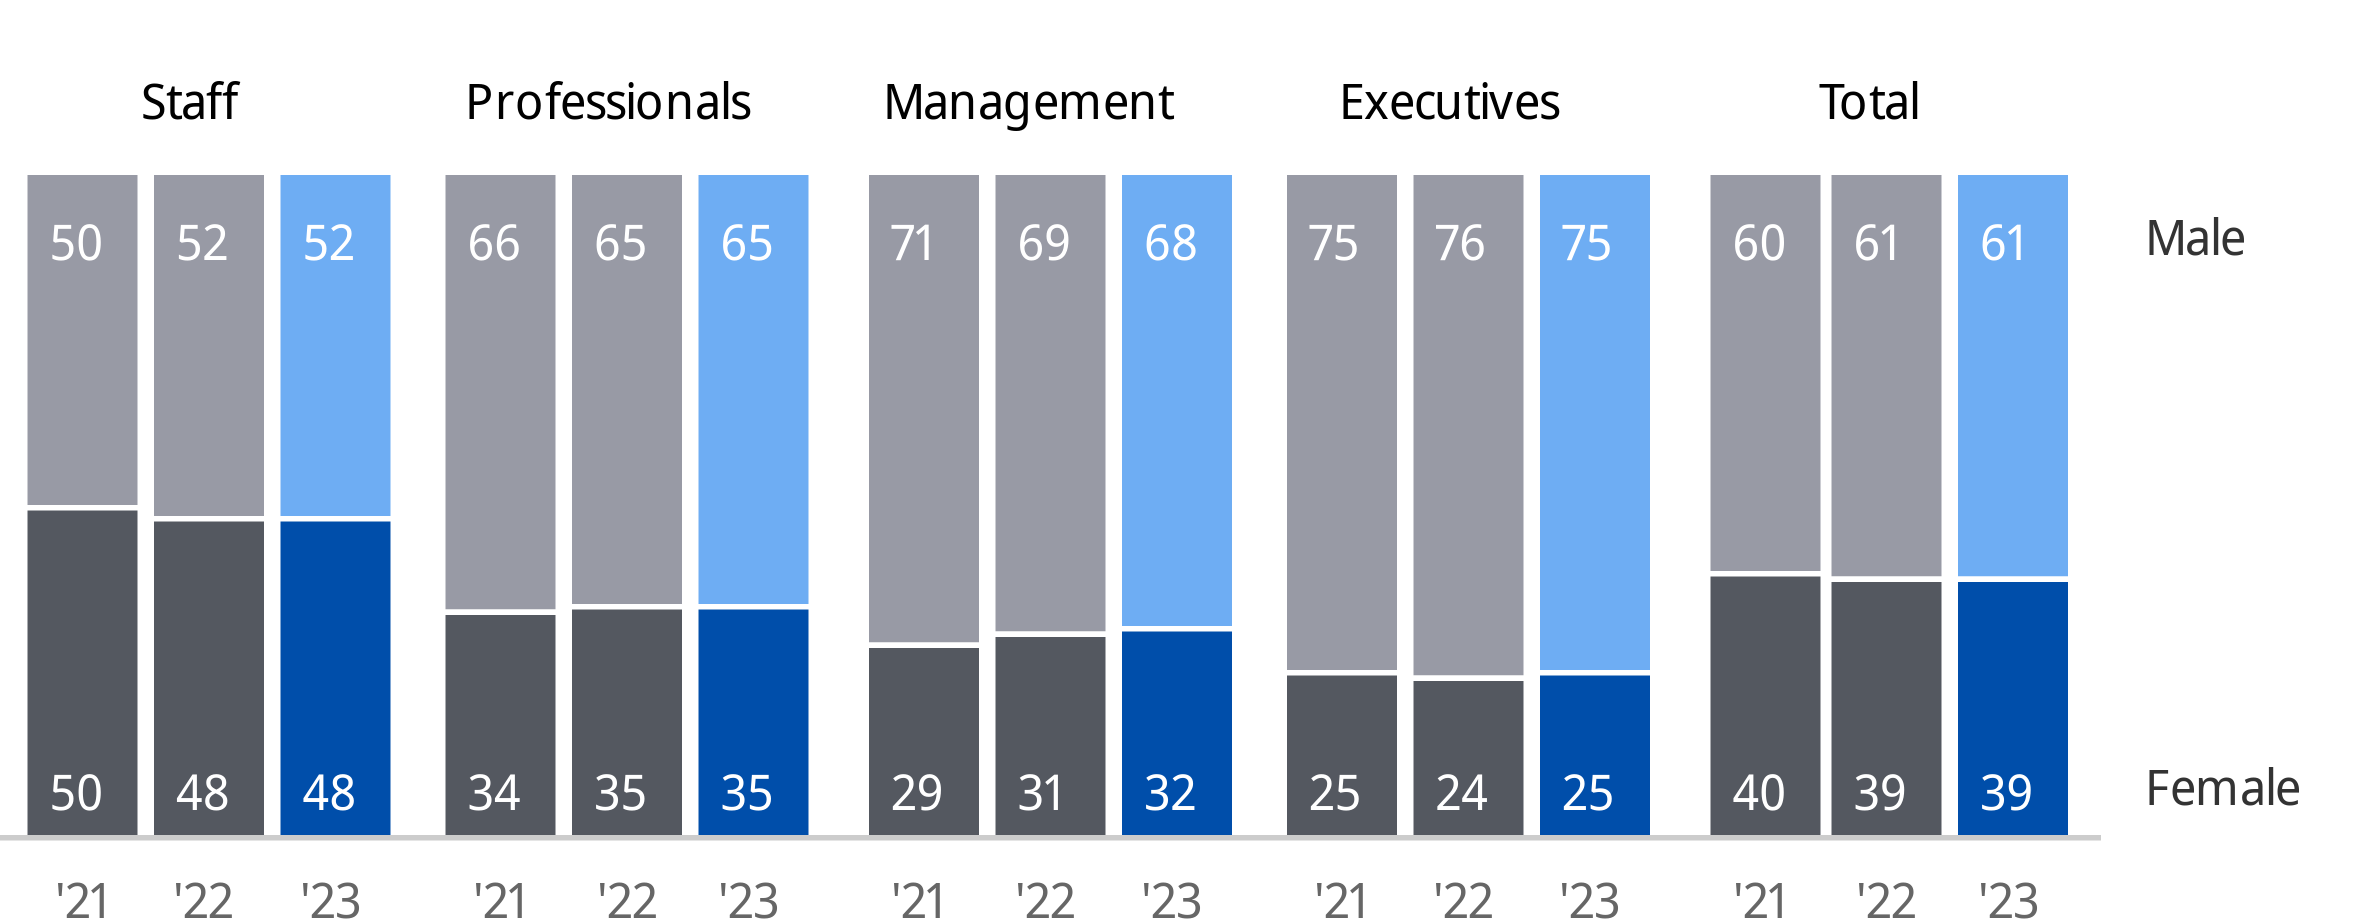
Philips Group
Generation diversity
in %
| 2023 | |
|---|---|
| Generation Z (1997 and onwards) | 11% |
| Generation Y / Millennials (1981 - 1996) | 48% |
| Generation X (1965 - 1980) | 33% |
| Baby Boomers (1946 - 1964) | 8% |
Philips Group
Employees by age group
| Employee age group | Under 30 | 30 to 50 | Above 50 | Total |
|---|---|---|---|---|
| % | 18 | 59 | 23 | 100 |
At Philips, we remain committed to a multi-generational workforce, as the presence of generational diversity is a key factor to foster creativity, productivity and innovation. The different life experiences of a multi-generational workforce support collaborative decision making and the inclusion of different beliefs and points of view.
Our Global Diversity Council is comprised of 10 senior leaders representing our Businesses, Regions and Functions. The Council provides governance and oversight on diversity efforts, promotes company-wide behavior change, and communicates on progress. Additionally, every Council member is an Executive Sponsor to one of our Employee Resource Groups.
Employee Resource Groups (ERGs) provide an inclusive space for employees to support and care for one another, develop skills, experience meaningful cultural connections, expand their knowledge, all while strengthening relationships among the Philips community.
Philips currently has 11 ERGs globally, with over 10,000 employees participating: Able & Allies; Asian Employee Resource Group; Black Employee Resource Group; Future Leaders and Rising Employees; Latinx Employee Resource Group; Middle Eastern Employee Resource Group; Philips Empowering Parents; Philips Women Lead; Pride Network; Veterans and Family Coalition; and Neurodiversity Network.
In 2023, we evolved our (mental) health and well-being framework to incorporate two additional pillars of well-being – career and environmental – enhancing our holistic approach and integrating global and local programs. We continued to address mental health by further rolling out the Employee Assistance Program (EAP).
We grew our Mental Health Champion program to 250 Champions across the globe, providing accredited training for peer-to-peer confidential support. We developed Compassionate leadership training for all our people managers, as well as encouraging dialogues around self-care, building trust and resilience. We also launched a Manager Mental Health toolkit, complemented by training sessions.
Along with International Women’s Day and PRIDE, Philips also recognized World Health Day and World Mental Health Day, with a variety of virtual mental well-being sessions and resilience practices that engaged employees across our Regions. In collaboration with Philips University, the Philips Energy Management well-being program was further extended across the organization.
In 2023, we deployed bias training to all recruiters, continued the learning journey for employees with a focus on emotional wellness, and launched a learning series for all employees called Learn With Us, where we featured Diversity, Inclusion and Well-being best practices from across the globe.
Many stakeholders, including customers and potential partners and employees, view third-party assessments as objective indications of the strength of our commitment. Awards received in 2023 included Forbes Best Employers for Women, Forbes Best Employers for Diversity, and Forbes Best Employers in Texas.
As we continue to focus on integrating inclusion, belonging and equity into the employee experience, we see value in partnering with diverse professional network organizations and job boards to sharpen our focus on the development and retention of our internal diverse talent and increasing representation of diverse talent across our organization. In 2023, we renewed a partnership with the National Black MBA Association and introduced partnerships with the National Sales Network, Circa and Mogul.
We continue to keep a close pulse on our employee sentiment through our bi-annual Employee Engagement Survey. Amidst the changes across the company, our Employee Engagement Survey (EES) saw an extremely high response rate of 73%, which means that almost 50,000 employees participated.
In 2023, average employee engagement scores decreased to 73% – lower than the Fortune 500 benchmark. The decrease in employee engagement scores, specifically in the first half of the year, did not come as a surprise, as we announced employee reductions and organizational changes in January and many of our employees were (pre-) informed of how they would be impacted. There was significant improvement (5 percentage points) in the EES scores in the second half of the year, as the employees settled within the new organization structure.
Philips Group
Employee Engagement Index
| 2021 | 2022 | 2023 | |
|---|---|---|---|
| Favorable | 79% | 77% | 73% |
| Neutral | 14% | 15% | 17% |
| Unfavorable | 7% | 8% | 10% |
In a changing environment, we listened actively to our employees to provide them with greater clarity on future direction and enable them to proactively deal with change to meet our customer and patient needs. In 2023, we introduced specific sessions around Patient Safety and Quality. We saw that our employees feel comfortable reporting a patient safety or quality concern, while some employees feel that we can learn more from reviewing quality and regulatory events, and that there is an opportunity to improve training and recognition on these topics. This is critical given the culture of people- and patient-centricity that we aspire to.
Using the Customer Experience Index, we look at how well employees think we focus on customer needs. These inputs are actively exchanged with the Customer Experience team.
Our employee engagement is primarily driven by a clear understanding of our customer needs and delivering on commitments that we make to each other. The results of the EES indicate that employees feel they can be themselves and have trusting relationships at work. Another significant factor driving engagement is our high scores on the Inclusion & Diversity index, which remains above the industry benchmark.
The total number of Philips Group employees was 69,656 at the end of 2023, compared to 77,233 at the end of 2022, a decrease of 7,577 FTEs.
On January 30, 2023, we launched a multi-year plan to create value with sustainable impact. Part of this plan is to improve performance and simplify our way of working to improve our agility and productivity. This includes the difficult, but necessary reduction of our workforce by around 6,000 roles globally by 2025. This is in addition to the 4,000 reductions announced in 2022. As we went through this change, we did it with the utmost care and respect for our people, with a strong focus on supporting those who were directly impacted by the reductions in finding a new role.
Subject to local country legislation, our support offers include:
Philips Group
Employees per segment
in FTEs at year-end
| 2021 | 2022 | 2023 | |
|---|---|---|---|
| Diagnosis & Treatment | 29,094 | 30,335 | 28,397 |
| Connected Care | 21,047 | 19,241 | 17,549 |
| Personal Health | 10,134 | 9,319 | 9,085 |
| Other | 17,913 | 18,337 | 14,626 |
| Philips Group | 78,189 | 77,233 | 69,656 |
Philips Group
Employment
in FTEs
| 2021 | 2022 | 2023 | |
|---|---|---|---|
| Balance as of January 1 | 75,001 | 78,189 | 77,233 |
| Consolidation changes: | |||
| Acquisitions | 2,594 | 87 | 27 |
| Divestments | (744) | (33) | (353) |
| Other changes | 1,338 | (1,010) | (7,251) |
| Balance as of December 31 | 78,189 | 77,233 | 69,656 |
Approximately 56% (2022: 58%) of the Philips workforce is located in Mature geographies and 44% (2022: 42%) in Growth geographies. In 2023, the number of employees in Mature geographies decreased by 5,392. The number of employees in Growth geographies decreased by 2,184.
Philips Group
Employees per geographic area
in FTEs at year-end
| 2021 | 2022 | 2023 | |
|---|---|---|---|
| Western Europe | 19,775 | 19,297 | 16,900 |
| North America | 21,807 | 20,618 | 18,094 |
| Other mature geographies | 4,683 | 4,576 | 4,105 |
| Mature geographies | 46,265 | 44,491 | 39,099 |
| Growth geographies | 31,923 | 32,742 | 30,558 |
| Philips Group | 78,189 | 77,233 | 69,656 |
In 2023, employee turnover amounted to 17.6%, of which 9.5% was voluntary, compared to 17.5% (11.1% voluntary) in 2022. External benchmarks show that our voluntary employee turnover remains in line with similar-sized companies, and that we are reasonably successful in retaining our employees.
Philips Group
Employee turnover 2023
in number of employees
| Staff | Professionals | Management | Executives | Total | |
|---|---|---|---|---|---|
| Female | 2,935 | 2,261 | 237 | 19 | 5,452 |
| I choose not to self-identify | 1 | 1 | |||
| Male | 2,583 | 3,676 | 527 | 50 | 6,836 |
| Philips Group | 5,518 | 5,938 | 764 | 69 | 12,289 |
Philips Group
Employee turnover 2023
| Staff | Professionals | Management | Executives | Total | |
|---|---|---|---|---|---|
| Female | 23.1% | 16.8% | 17.9% | 26.8% | 19.7% |
| I choose not to self-identify | 6.3% | 3.9% | |||
| Male | 18.7% | 14.5% | 18.3% | 23.4% | 16.1% |
| Philips Group | 20.8% | 15.2% | 18.1% | 24.3% | 17.6% |
Philips Group
Voluntary turnover 2023
| Staff | Professionals | Management | Executives | Total | |
|---|---|---|---|---|---|
| Female | 11.9% | 9.6% | 7.5% | 9.9% | 10.6% |
| I choose not to self-identify | 6.3% | 3.9% | |||
| Male | 11.1% | 7.8% | 7.1% | 6.1% | 8.8% |
| Philips Group | 11.5% | 8.4% | 7.2% | 7.0% | 9.5% |
The rate of employee turnover reported, is calculated in headcount as a monthly average across the reporting period.
As a company, Philips is committed to remunerating equal pay for equal work. We ensure that all employees are compensated fairly and without inequity based on gender, race, or any other characteristic protected by law.
A pay equity review is a crucial process that reflects our commitment to fostering fairness, equality, and transparency within our organization. Annually, Philips conducts a comprehensive analysis of its compensation structure to ensure that all employees are remunerated fairly for their skills, experience, and contributions, regardless of human characteristics that can lead to potential biases. The systematic measurement of gender pay gaps within Philips is an integral aspect of our operational practices. This commitment ensures that we not only provide equal opportunities, but also uphold fairness in compensation for the work undertaken by our diverse workforce. This dedication to transparency and proactive correction reflects our overarching commitment to fostering an environment of equality and inclusivity within the company.
In alignment with our global ethos, many countries in which Philips operates have already embraced the practice of regular pay equity reviews over several years. Notable examples include Australia, the United Kingdom, Sweden, India, and certain states within the United States. This demonstrates our unwavering dedication to upholding the principles of equity and inclusivity on a global scale. When an unexplained gap is brought to light, immediate actions are taken to rectify the situation. Furthermore, Philips is committed to understanding the underlying factors contributing to these unexplained gaps, and formulating proactive measures to prevent such occurrences in the future.
Specifically focusing on the United States, Philips embarked on a significant initiative in the form of a company-wide Pay Equity & Transparency Project starting in 2022 and culminating in 2023. This project builds upon the successful groundwork laid during pay equity reviews at the state level in the US. The objective has been to create a comprehensive and standardized approach to pay equity and pay transparency, ensuring that all employees across the US are remunerated fairly, in accordance with their skills and responsibilities. All US employees have the right to request pay transparency and understand their position against peers, which is over and above the current legislative requirements.
The Pay Equity Project is a testament to our commitment to not only meeting but exceeding legal and regulatory requirements. By proactively addressing pay equity concerns, we aim to create an inclusive work environment that fosters diversity and promotes equal opportunities for everyone within the organization. This initiative reinforces our belief that fair compensation is not only a legal obligation but a fundamental ethical responsibility that contributes to the overall success and sustainability of our company.
Through this proactive approach, we strive to set an industry standard for pay equity, demonstrating that a commitment to fairness and equality is not only beneficial for our employees but also the long-term success and reputation of Philips as a global leader in innovation and healthcare solutions.
Philips can only achieve its aim to improve the lives of 2.5 billion people per year by 2030 if we support and empower our people, so they can be their best and perform effectively. To this end, we conducted a living wage analysis on the lowest salaries in every country in which we currently operate.
The living wage is a concept defined by Anker and Anker (2017) as “Remuneration received by a worker in a particular place sufficient to afford a decent standard of living for the worker and her or his family. Elements of a decent standard of living include food, water, housing, education, healthcare, transport, clothing, and other essential needs, including provision for unexpected events”.
Based on the Living Wage analysis conducted in 2023, all Philips employees received wages and benefits that are consistent with at least the minimum Living Wage standard for an individual. Furthermore, approximately 97% of Philips employees received wages and benefits that are consistent with at least the minimum Living Wage standard for a family (based on reference data and guidance from Wage Indicator).
In 2023, the safety of our employees remained paramount. As the COVID-19 pandemic continued the endemic phase, the centralized controls put in place during the pandemic were relaxed in line with local governments’ advice. As Philips resumed normal operations, office occupancy started to rise, and business travel restarted. However, critical control measures were maintained. Philips has emerged from the pandemic with a good record of management and control that restricted the impact of the pandemic on employees and the wider business operations.
At Philips, we strive for an injury-free and illness-free work environment. Since 2016, the Total Recordable Cases (TRC) rate has been defined as a Key Performance Indicator (KPI). A TRC is a case where an injured employee is unable to work for one or more days, has medical treatment, or sustains an industrial illness. We set yearly TRC targets for the company, businesses and industrial sites.
We recorded 172 TRCs in 2023, the same as in 2022. While our workforce decreased in 2023, the TRC rate increased from 0.23 per hundred FTEs in 2022 to 0.24 in 2023.
In 2023 we recorded 90 Lost Workday Injury Cases (LWIC). These are occupational injury cases where an injured person is unable to work for one or more days after the injury. This represents a 9% increase compared with 81 in 2022. The LWIC rate increased to 0.12 per 100 FTEs in 2023, compared with 0.11 in 2022. The number of Lost Workdays caused by injuries decreased by 1,471 days (37%) to 2,549 days in 2023.
For more information on Health and Safety, please refer to Health and Safety performance
Philips strongly believes that companies have both the responsibility to respect human rights and the ability to protect them. Philips’ Human Rights Policy, General Business Principles, Supplier Sustainability Declaration and other relevant policies detail how Philips respects human rights, in line with the International Bill of Human Rights and the International Labor Organization’s Declaration on Fundamental Principles and Rights at Work.
In this regard, Philips follows the guidance given in the UN Guiding Principles on Business and Human Rights and the Organization for Economic Co-operation and Development (OECD) Guidelines for Multinational Enterprises. Philips has also been a signatory to the UN Global Compact since 2007. Philips’ Board of Management is responsible for strategy and oversight of all company activities across the three ESG dimensions, including human rights. The Board also monitors progress and takes corrective action where needed.
In addition, a cross-functional project team, comprised of a Human Rights Manager and professionals from several business functions, is in place to drive several human rights initiatives. The project team is overseen by the Human Rights Steering Committee, consisting of senior leaders from Operations, Legal, Human Resources and Sustainability.
In 2023, we continued to develop our due diligence strategy by conducting Human Rights Impact Assessments (HRIA). Philips conducted Human Rights Impact Assessments (HRIAs) at its sites in Pune (India) and Varginha (Brazil), living up to its commitment of conducting HRIAs at 100% of its at-risk sites by 2023. Philips intends to monitor the progress and findings from these sites and take them on a continuous improvement journey regarding human rights topics.
Although the Human Rights Impact Assessment of selected sites is primarily focused on Philips own operations, a derived deep-dive approach for certain suppliers has been rolled out since 2022. For 8 suppliers, a focused assessment on human rights was conducted, compared with the broader Supplier sustainability assessment approach which covers sustainability more holistically and is detailed in Supplier sustainability.
Our Human Rights Report contains detailed information regarding our progress, targets, and plans for continuous improvement.
Philips’ purpose to improve people’s health and well-being applies throughout our value chain. An important area of focus for the Integrated Supply Chain is sustainability, and we are actively working on this together with our partners, whether these be component suppliers or energy or logistics providers. Close cooperation with our suppliers not only helps us deliver health technology innovations, it also supports new approaches that help us minimize our environmental impact and maximize the social and economic value we create.
The sustainability performance of our suppliers is fully embedded in our procurement strategy and way of working. We want to make a difference through sustainable supply management and responsible sourcing. This is more than just managing compliance – it is about collaborating with our supply partners to make a positive and lasting impact.
Since 2003, our sustainability strategy has included dedicated supplier sustainability programs. We have a direct (tier 1) business relationship with approximately 4,900 product and component suppliers and 16,100 service providers. Social and environmental issues deeper in our supply chain also require us to intervene beyond tier 1 suppliers. In 2023, our programs focused specifically on improving supplier sustainability performance, human rights, responsible sourcing of minerals, and reducing the environmental footprint of our supply base by driving the adoption of Science Based Targets.
Through the Supplier Sustainability Performance program, our maturity-based approach to drive continuous improvement, we improved the lives of approximately 723,000 workers in our supply chain in 2023 (2022: 459,000). Collaborating with our strategic partners, we increased the number of deep-dives at second-tier suppliers, actively supporting them to become more effective in their own sustainability engagement approaches towards their suppliers.
Detailed information on our supplier sustainability programs is available in section Supplier sustainability of this Annual Report.
To fulfill our company purpose, a responsible tax approach is required. We fully acknowledge our societal role when it comes to paying taxes in the geographies where value is created. We consider our tax payments as a contribution to the communities in which we operate, and part of our social value creation.
Our Approach to Tax sets the standard for our conduct, by which individual employees, the company and its subsidiaries must abide. We consider tax in the context of the broader society, inspired by our stakeholder dialogues, global initiatives of the Organization for Economic Cooperation and Development and United Nations, human rights, international tax laws and regulations, and relevant codes of conduct.
Under the ultimate responsibility of the Board of Management, the Chief Financial Officer annually reviews, evaluates, approves and where necessary adjusts Philips’ approach to tax. Part of our approach is to acknowledge the importance of transparency in respect of our tax contributions. Philips supports and participates in transparency initiatives such as the Dow Jones Sustainability Index (DJSI) and the Tax Transparency Benchmark of the Dutch Association of Investors for Sustainable Development (VBDO). The Tax Transparency Benchmark is a study conducted by the VBDO on tax transparency practices among Dutch and European listed companies. The 2023 benchmark assessed the tax transparency practices of 51 Dutch companies and 65 listed companies from Belgium, Denmark, France, Germany, Italy, Spain, and Sweden. Philips scored the maximum achievable 40 points. The jury noted our comprehensive Country Activity and Tax Report 2022, which explicitly linked to the GRI 207 Tax Standard and included information on environmental and social factors. Furthermore, the jury commended Philips for the clear description of the role taxes play within its value creation model. In addition, Philips scored a top score (100 out of 100) in the Tax Strategy section of the 2023 Dow Jones Sustainability Index.
Since 2020, we have been providing certain voluntary disclosures about taxes paid and collected in the countries in which we operate. The 2023 Country Activity and Tax Report is published on our website, in addition to, and simultaneously with the disclosures on tax included in this Annual Report.
Philips has a Tax Control Framework in place that forms part of its standard set of Internal Controls over Financial Reporting (ICFR). Philips' tax position is therefore reflected in its financial statements and covered by the Board of Management's report on ICRF and its conclusion regarding the effectiveness thereof, as referred to in the section Risk management and internal control framework .
Philips also endorses the ambitions expressed in the Tax Governance Code published by Dutch employers' organization VNO-NCW. We comply with the principles prescribed in the Code, available at www.vno-ncw.nl/taxgovernancecode, and we have touched upon the elements of this code in our Country Activity and Tax Report.
In 2023, Philips contributed to the communities where we operate through taxes paid (e.g. corporate income tax) and taxes collected (e.g. VAT). Philips' total tax contribution in 2023, amounting to EUR 3,051 million, is presented by tax type in the following table. Please refer to our 2023 Country Activity and Tax Report for more details.
Philips Group
Total contribution 2023 per tax type
in millions of EUR
| Corporate income tax paid | Customs duties | VAT1) | Payroll tax | Other taxes | Total | |
|---|---|---|---|---|---|---|
| Western Europe | (17) | 9 | 206 | 844 | 66 | 1,107 |
| North America | (31) | 38 | 123 | 721 | 8 | 859 |
| Other mature geographies | 35 | 3 | 77 | 116 | 1 | 232 |
| Growth geographies | 65 | 77 | 332 | 340 | 40 | 853 |
| Philips Group | 52 | 127 | 737 | 2,021 | 115 | 3,051 |
Stichting Philips Foundation, an independent foundation organized under Dutch law, is a registered charity established in 2014. In 2023, Royal Philips supported Philips Foundation with a contribution of EUR 6.7 million and provided the operating staff as well as the expert assistance of skilled volunteers in the execution of the Foundation’s programs.
Philips Foundation’s mission is to reduce healthcare inequality by providing access to quality healthcare for underserved communities through meaningful innovation. It does this through the provision and application of Philips’ healthcare expertise, innovation power, talent and resources and by financial support. Together with key partners around the globe (NGOs, academic partners, entrepreneurs), Philips Foundation seeks to identify challenges where a combination of healthcare technology expertise and partner experience can be used to create meaningful solutions that have a positive impact on people’s lives.
Philips Foundation works in projects (grant-based) and through impact investments (loans and equity). The instrument depends on the status and self-sustainability of the respective healthcare technology in serving the more disadvantaged communities.
For more information on the Philips Foundation, please refer to Philips Foundation.
Our stakeholder engagement is closely aligned with the company’s purpose to improve people’s health and well-being through meaningful innovation. One of our key ESG commitments is to be transparent about our plans, activities, targets, results and contributions to society, and to engage with shareholders, customers, business partners, governments and regulators through a variety of platforms. The purpose of our engagement efforts is to pursue and foster an open, meaningful, effective, and informed dialogue regarding our activities and our internal and external stakeholders’ needs, concerns and expectations. Please refer to the Philips Stakeholder Engagement Policy available at our website.
The purpose of our advocacy efforts is to contribute to policy development and legislative processes and to support business opportunities in the areas relevant to Philips and its businesses, for example: health system resilience policies and investment plans; ESG, in particular on climate, circularity and green procurement; and Digital Health, such as AI, data protection, interoperability, cybersecurity, and technological sovereignty. For information on our advocacy activities and expenses in 2023, please refer to Advocacy activities and expenses.
In organizing ourselves around customers and markets, we conduct dialogues with our diverse stakeholders in order to explore common ground for addressing societal challenges, building partnerships and jointly developing supporting ecosystems for our innovations around the world. We derive significant value from our stakeholders across all our activities and engage with, listen to and learn from them. Working in partnerships is crucial to delivering on our purpose to improve people’s health and well-being through meaningful innovation. We incorporate feedback on specific areas of our business into our planning, actions, targets, policies and disclosures. In addition, we participate in meetings and task forces as a member of organizations including the World Economic Forum, WBCSD, Responsible Business Alliance (RBA), EFRAG, Dutch Sustainable Growth Coalition, the Ellen MacArthur Foundation, European Round Table for Industry, Platform for Accelerating the Circular Economy (PACE) and the European Partnership for Responsible Minerals.
Furthermore, we engage with the leading Dutch labor union (FNV) and a number of NGOs, including Enough, GoodElectronics, the Chinese Institute of Public and Environmental Affairs, UNICEF, Amnesty International, Greenpeace, Friends of the Earth, and WageIndicator. We also engage with a variety of investors, analysts, institutional advisory and other organizations, such as Eumedion, ISS, Glass Lewis, VEB and VBDO. Please also refer to Investor information.
In addition to our many stakeholder engagement sessions, our sustainability e-mail account (philips.sustainability@philips.com) enables stakeholders to share their issues, comments and questions, also about this Annual Report. The following table provides a non-exhaustive overview of our stakeholder engagement, which is also used for our materiality analysis.
| Stakeholder engagement overview (non-exhaustive) | |||
| Stakeholders | Processes | Results | |
| Employees |
| Regular meetings, quarterly Employee Survey, employee development process, quarterly update webinars. For more information, refer to Social performance Regular mail updates, team meetings, webinars | Engaged and informed employees, action plans, policies |
| Customers |
| Joint (research) projects, business development, Lean value chain projects, strategic partnerships, consumer panels, Net Promoter Scores, Philips Customer Experience Centers, Philips Customer Care centers, Training centers, social media | New technologies and processes, Frustration Free Packaging solutions, green consumer propositions, Life Cycle Analysis of products, EU Product Environmental Footprint pilots |
| Suppliers |
| Supplier development activities (including topical training sessions), supplier forums, supplier website, participation in industry working groups like COCIR and RBA. For more information, refer to Supplier sustainability. | Supplier improvement projects, supplier commitments to Science Based Targets to reduce CO2 emissions, joint projects |
| Governments, municipalities, etc. |
| Topical meetings, research projects, policy and legislative developments, business development, multi-stakeholder projects. For more information, refer to Advocacy activities and expenses | Feedback on proposed legislation, investment plans, transition plans to a circular and low carbon society |
| NGOs |
| Topical meetings, multi-stakeholder projects, joint (research) projects, innovation challenges, renewables projects, social investment program and Philips Foundation. For more information, refer to Advocacy activities and expenses | Projects to increase access to care in underserved communities, action plans, policies |
| Investors |
| Webinars, roadshows, capital markets day, Investor relations and Sustainability accounts | Green and Sustainability Innovation Bonds, visits to Philips Customer Experience Centers |
Koninklijke Philips N.V. (Royal Philips), a company organized under Dutch law, is the parent company of the Philips group. Royal Philips has a two-tier board structure consisting of a Board of Management and a Supervisory Board, each of which is accountable to the General Meeting of Shareholders for the fulfillment of its respective duties. The Board of Management is entrusted with the management of the company. The other members of the Executive Committee have been appointed to support the Board of Management in the fulfilment of its managerial duties. See the chapter Corporate governance of this Annual Report, where the company addresses the main elements of its corporate governance structure, reports on how it applies the principles and best practices of the Dutch Corporate Governance Code, and provides other information required under Dutch law.
Under the chairmanship of the President/Chief Executive Officer (CEO) and supported by the other members of the Executive Committee, the members of the Board of Management drive the company’s management agenda and share responsibility for the continuity of the Philips group, focusing on sustainable long-term value creation. In fulfilling their duties, the members of the Board of Management and Executive Committee are guided by the interests of the company and its affiliated enterprise, taking into account the interests of its stakeholders.
The Supervisory Board supervises the policies, management and general affairs of Philips, and assists the Board of Management and the Executive Committee with advice on general policies related to the activities of the company, including setting and executing the strategy of the Philips Group.
Philips’ strategy, and the way it has been developed by the Board of Management under the supervision of the Supervisory Board, clearly integrates the company’s impact in the field of sustainability, including the effects on people and the environment. The Board of Management regularly convenes on ESG matters with other Executive Committee members (the Chief Operating Officer, the Chief Strategy & Innovation Officer, the Chief Human Resources Officer, the Chief Business Leader Precision Diagnosis and the Chief International Markets Market Leader) and certain functional executives. Together they define Philips’ ESG strategy, commitments, programs, targets and policies, they monitor and evaluate progress and take corrective action where needed. Progress on ESG is reported on a quarterly basis to the Audit Committee of the Supervisory Board, which assist the Supervisory Board in fulfilling its oversight responsibilities for the integrity and quality of the company’s sustainability statements,
ESG is also embedded in our core business processes, like innovation (EcoDesign), sourcing (Supplier Sustainability Program), manufacturing (Sustainable Operations), logistics (Green Logistics) and programs like the Circular Economy initiative.
Our operating model integrates key aspects of how we operate – from our strategy, structure & governance, policies, processes, systems & data, to our people & culture and performance management.
In 2023 we continued the process of simplifying the way we work to drive clear accountability and agility, and to unlock significant productivity and margin gains. This simplification – with end-to-end accountable businesses supported by a much leaner Group layer and strong Regions, together with a strengthened culture of patient- and people-centricity, innovation impact and clear accountability – is a primary enabler to create value with sustainable impact.
It is designed to help us to fulfill our purpose of improving the health and well-being of billions of people and ensure the highest standards of quality and integrity in everything we do.
The company’s risk management and internal control framework forms an integral part of the Philips business planning and performance review cycle. The purpose of our risk management is to identify and analyze the risks Philips faces in executing its strategy and activities, to set the risk appetite of the company, and to monitor its effectiveness. The objective of internal control is to maintain integrated management control of the company’s operations and reporting, as well as safeguard compliance with applicable laws and regulations. Key elements of our framework include (but are not limited to) our General Business Principles, our corporate governance, authorization structures, our policy framework, internal reporting structures. Furthermore, it comprises various frameworks to help manage and control risk in line with our risk appetite. These include (but are not limited to) our Enterprise Risk Management framework (refer to Risk management), and other management systems and frameworks relevant to specific risk areas such as patient safety and quality, health & safety, environmental, tax, business continuity, information security and privacy.
As a key part of its risk management and internal control framework, Philips has implemented a standard set of Internal Controls over Financial Reporting (ICFR). Philips has designed its ICFR framework based on the COSO Internal Control-Integrated Framework (2013). Together with Philips’ established accounting procedures, this standard set of internal controls is designed to provide reasonable assurance that assets are safeguarded, that the books and records properly reflect transactions necessary to permit preparation of financial statements, that policies and procedures are carried out by qualified personnel, and that published financial statements are properly prepared and do not contain any material misstatements. In each reporting unit, management is responsible for customizing the controls set for their business, risk profile and operations.
Each year, management’s accountability for ICFR is evidenced through the formal certification statement sign-off. Any deficiencies noted in the design and operating effectiveness of ICFR that were not completely remediated are evaluated at year-end by the Board of Management and the outcome reported to the Supervisory Board. The Board of Management’s report on ICFR, including its conclusions regarding the effectiveness thereof, can be found in this report in the section Management’s statements and report .
While pursuing our business objectives, we aim to be a responsible partner in society, acting with integrity towards our employees, customers, patients, business partners and shareholders, as well as the wider community in which we operate. To that end, our GBP – part of the Philips Operating Model – and their underlying policies incorporate and represent the fundamental principles by which all Philips businesses and employees around the globe must abide. They set the minimum standard for our business conduct as a health technology company, for our individual employees and for our subsidiaries, and Philips rigorously enforces compliance of its GBP throughout the company. Our GBP also serve as a reference for the business conduct, we expect from all our business partners.
The GBP include principles of doing business with integrity at work, integrity in the market and professional integrity outside work. They also set our integrity standard on inside information, aiming to prevent trading on or disclosure of non-public information, the publication of which would be likely to have a significant influence on the trading price of Philips securities or securities of companies that Philips is seeking to acquire. More specifically, Philips has adopted Rules of Conduct with respect to trading in Philips securities to promote compliance with applicable insider trading and other market abuse laws, rules and regulations, in particular the EU Market Abuse Regulation. The Rules of Conduct apply to all employees, the members of the Board of Management and the Supervisory Board of Royal Philips.
The GBP form an integral part of labor contracts in virtually every country in which Philips operates. Translations of the GBP text are available in 30 languages, allowing almost every employee to read the GBP in their native language. Detailed underlying policies, manuals, training, and tools are in place to give employees practical guidance on how to apply and uphold the GBP in their daily work environment. Details can be found at www.philips.com/gbp. Each year, employees reconfirm their commitment to the code of conduct after completing their GBP e-learning, and there is an additional annual sign-off for Executives. A similar sign-off is in place for Finance and Procurement staff for their respective codes of conduct.
The Executive Committee is responsible for the effective deployment of the GBP and for generally promoting a culture of compliance and ethics within the company. Furthermore, each quarter all our key Regions convene market compliance committees dealing with GBP-related matters in the local context. They are also responsible for the design and execution of localized compliance plans that are tailored to their market-specific risks and organizational set-up, and regularly review the relevant compliance metrics for their respective market through dashboards delivered by the legal compliance monitoring team. The GBP Program Office, together with a worldwide network of GBP Compliance Officers, supports the implementation of GBP initiatives.
As part of our continuous effort to raise GBP awareness and foster dialogue throughout the organization, each year a global GBP communications and training plan is deployed, including structured dialogues led by managers where quality, integrity and speaking up are discussed. This is part of a company-wide initiative aimed at reinforcing a culture of dialogue using ethical dilemma case studies that are relevant to our workforce. All functions at risk also receive annual training which includes content on, amongst others, antibribery and anticorruption and healthcare compliance via tailored case studies. Almost 60,000 (94%) of our assigned employees completed their yearly GBP e-learning. Specifically in 2023, we again focused on increasing awareness on integrity and on the importance of speaking up, through and following the deployment of our biennial Business Integrity Survey. Through this survey, more than 22,500 employees trusted us with their views and opinions on integrity within Philips. Ninety-four percent of employees expressed the belief that we act with integrity with Philips. To gain deeper insights into the results of the Business Integrity Survey, we execute deep-dive initiatives amongst our employees.
A key control to measure implementation of our GBP is the GBP monitoring and reporting program, which is part of our Internal Control framework. In addition, we continue to expand the capabilities of our legal compliance monitoring team, serving our business customers as well as our compliance networks with actionable data, thus further improving our compliance control framework.
The GBP are supported by established mechanisms with the aim of ensuring standardized reporting and enabling employees and third parties to escalate concerns 24/7. Concerns raised are registered consistently in a single database hosted outside of Philips servers to ensure confidentiality and security of identity and information. Encouraging people to speak up through the available channels if they have a concern will continue to be a cornerstone of our GBP communications and awareness campaigns. At least twice a year, the Executive Committee and Audit Committee of the Supervisory Board are informed on relevant GBP metrics, cases, trends and learnings.
In 2023, a total of 764 concerns were reported via Philips Speak Up (Ethics Line) and through our network of GBP Compliance Officers. This represents an increase of 8% from the total of 706 concerns in the previous reporting period (2022). This is a continuation of a year-on-year upward trend. See Philips SpeakUp (Ethics Line) for further details.
Through the Audit Committee of the Supervisory Board, the company also has procedures in place for the receipt, retention and treatment of complaints specifically relating to accounting, internal accounting controls, or auditing matters, enabling the confidential, anonymous submission of complaints.
The results of the monitoring measures in place are given in Philips SpeakUp (Ethics Line). The GBP and underlying policies, including the Financial Code of Ethics and Procurement Code of Ethics, are published on the company website, at www.philips.com/gbp.
Our remuneration policy is designed to encourage employees to deliver on our purpose and strategy and create stakeholder value, and to motivate and retain them. Our executive long-term incentive plan includes environmental and social commitments. A description of the composition of the remuneration of the individual members of the Board of Management and the Supervisory Board is included in the Report of the Remuneration Committee.
Enabling the delivery of patient-centric, safe, and high-quality care – the essence of patient safety and quality – is foundational to Philips' purpose to improve the health and well-being of people through meaningful innovation. This year we formed the Patient Safety and Quality organization, which brings together the Quality, Regulatory Affairs, and Clinical and Medical functions as one unified team. Positioned to support and enable the entire Philips organization and to foster the quality culture at Philips, the Patient Safety and Quality team is instrumental in ensuring we have the capabilities, processes, and tools required for operating in a highly regulated healthcare technology industry.
Throughout 2023, we continued to accelerate our work in crucial areas, with the goal of achieving and maintaining the highest level of patient safety and quality. Specific areas of focus included: preparation and manufacturing site readiness for audits and inspections; a review of quality records; new ways of undertaking product quality reviews; planning for IT and data enhancements; and simplification of our process framework and Quality Management Systems.
This year, we created the new role of Chief Patient Safety and Quality Officer, who is a member of the Philips Executive Committee and reports directly to the Chief Executive Officer. Additionally, we hired a new Chief Medical Officer to lead the team that is focused on clinical research, medical safety, and medical support for our global businesses.
Early in 2023, we organized CAPA management, Quality Management Systems, compliance training, internal quality audits, and other crucial areas for patient safety and quality into a Compliance and Quality shared service team. We set up a Transformations team, responsible for project management of Patient Safety and Quality programs. Regulatory Affairs formed new teams that are responsible for expanding our engagement with external stakeholders and regulators, and for the delivery of effective tools, processes, and services to facilitate timely and compliant market access. We appointed a new leader for Product Safety and Surveillance, Corrections and Removals, and strengthened our post-market processes and ways of working.
Across Philips, teams in all Businesses, Regions, and Functions continued to foster a quality culture and mindset, where all employees are encouraged to speak up and share ideas for improving the safety and efficacy of our products. In October, our employees took part in a Timeout for Patient Safety and Quality to solidify commitment and planning.
We strive to continuously raise our performance to deliver safe and high-quality products, services, and solutions, which are compliant with quality and safety standards and all applicable laws. In 2023, as part of our plan to create value with sustainable impact, we introduced a new operating model that enables us to simplify how we work and improve accountability and ownership. We are strengthening our engineering capabilities for new product development in areas such as quality systems engineering, reliability and software design.
We further reduced the number of Quality Management Systems in which we operate to increase focus, reduce complexity, and minimize risk. This year we closed nine QMS for a total of 66 Quality Management Systems by year-end 2023, with further significant reductions planned for 2024.
In 2023, our Accelerating Patient Safety & Quality program instituted an improved approach for management of skills and launched a training program on patient safety and quality topics. In collaboration with business units and Innovation & Strategy, we established programs to improve product design and reliability.
All Philips businesses are accountable for patient safety and quality. This year, we instituted a new Patient Safety and Quality performance review meeting with each business and at the Philips level in aggregate. We set Patient Safety and Quality key performance indicators for the company, and Quality performance metrics are part of the remuneration of all Philips Executives. Additionally, every employee has a patient safety and quality goal as part of people performance management.
Under Philips' new operating model, Regulatory Affairs sits on the leadership team of each Business and Region as a key partner. In 2023, we established internal governance and requirements for engagements with national government regulatory authorities (e.g. the US Food and Drug Administration (FDA), European Medicines Agency (EMA), China National Medical Products Administration, Notified Bodies, and National Competent Authorities in the European Union.
As a global business in a dynamic regulatory environment, we must ensure compliance with evolving regulations related to innovations in areas such as Artificial Intelligence, and healthcare informatics and software design. This year, we increased levels of investment in regulatory science and policy and in enterprise informatics. Teams are working on global harmonization of requirements, safe and innovative applications of AI, and secure transmission and storage of protected health information. Sought as strategic partners, the Regulatory Affairs team participated in international consensus standards groups alongside regulators and engaged with international regulators as invited experts and speakers at the International Medical Device Regulators Forum, Global Harmonization Working Party, and other meetings. We are working with the National Institutes of Health to establish ethical applications of Artificial Intelligence in medical devices.
In 2023, we also increased our collaborations with organizations supporting regulatory science like the Food, Drug, and Law Institute and the Regan-Udall Foundation for the FDA. In partnership with the Boston Globe and the Washington Post, we hosted an industry and customer panel on Transforming Healthcare with AI: Harnessing Technology to Promote Safety and Quality for Patients. Regulatory Affairs leaders moderated panel discussions among key international regulators and were featured speakers at events such as MedTech Europe and the AdvaMed annual conference.
Throughout 2023, we continued transitioning our portfolio to become European Union Medical Device Regulation (EU-MDR)-compliant. In March 2023, the grace period was extended until year-end 2027 or 2028, under strict conditions and depending on risk class. We continue to use this available grace period for placing a portion of our portfolio on the market under the European Union Medical Device Directive (EU-MDD).
Regulatory Affairs deployed a digital regulatory information management tool to all Regions in 2023, with continued deployments planned to Businesses in 2024. This tool will be a single source for regulatory data that will help increase speed to market.
In 2023, we formed a centralized medical office with expertise in clinical research, medical safety, healthcare economics, and a breadth of care specialties. This team is focused on supporting the global business, navigating the intricacies of addressing patients' and customers’ unmet needs across a variety of ecosystems, and looking across the entire product lifecycle to help teams develop solutions that are safe, effective, and relevant for patients, providers, and payers.
In 2023, we hosted our second Patient Safety Advisory Board, where external leaders from across the world, from a variety of professional backgrounds, participated in intensive workshops focused on themes identified as key to improving the safety and efficacy of our solutions. Experts from outside and within Philips exchanged ideas ranging from the role of innovation in human interface models, patient safety and clinical education programs and capability building at Philips, and other topics that are key to our overall way forward in innovation and safety. This year, Philips also introduced an extensive Clinical and Medical curriculum, available to all employees.
The team continued our advocacy and investment in topics such as radiation safety, medical device testing, and improved access to physician and staff training. At Harbor-UCLA Lundquist Institute, we host a facility for R&D pre-clinical testing, clinical and medical education proctoring, and fellows training. Our team continues to design, generate, and disseminate clinical and economic evidence to show the value of our solutions in improving patient outcomes.
Our Health Economics and Outcomes Research team continued to contribute economic evidence to support innovation and expand access to high-quality care, authoring 12 publications and 18 studies during 2023. The Ambulatory Monitoring & Diagnostics business unit increased in-network access to ambulatory patient monitoring for an additional 35 million patients in the United States through payer contracting initiatives. Our Image Guided Therapy-Devices team advocated with the Centers for Medicare and Medicaid (CMS) to improve Medicare payment to ambulatory surgery centers for cardiovascular and peripheral vascular treatments, ensuring patients have access to care in the setting that their providers determine is most appropriate.
On June 14, 2021, Philips’ subsidiary, Philips Respironics, initiated a voluntary recall notification in the United States, and field safety notice outside the US, for certain sleep and respiratory care products related to the polyester-based polyurethane (PE-PUR) sound abatement foam in these devices.
Since June 2021, together with five independent, certified testing laboratories and third-party experts, Philips Respironics has conducted extensive testing. Based on the results to date, Philips Respironics and the third-party experts concluded that use of the sleep therapy devices is not expected to result in any appreciable harm to health in patients. Further testing remains ongoing. Following ongoing communications, Philips Respironics agreed in October 2023 to the FDA’s recommendations to implement additional testing on the sleep and respiratory care devices to supplement current test data. Philips Respironics is in discussions with the FDA on the details of that further testing. Further testing remains ongoing. Since the start of the test and research program, Philips Respironics has endeavored to work cooperatively with the FDA on the program and to publish regular test updates as agreed with the FDA.
Following the FDA’s inspection of a Philips Respironics manufacturing facility in the US and the subsequent inspectional observations, the US Department of Justice (DOJ), acting on behalf of the FDA, began discussions with Philips in July 2022 regarding the terms of a proposed consent decree. On January 29, 2024, as part of the announcement of Philips’ fourth quarter and full year 2023 financial results, the company provided an update stating that Philips agrees on the terms of a consent decree with the DOJ and FDA. The consent decree primarily focuses on Philips Respironics’ business operations in the US. The consent decree is being finalized and will be submitted to the relevant US court for approval. The decree will provide Philips Respironics with a roadmap of defined actions, milestones, and deliverables to demonstrate compliance with regulatory requirements and to restore the business.
In the US, Philips Respironics will continue to service sleep and respiratory care devices already with healthcare providers and patients, and supply accessories (including patient interfaces), consumables (including patient circuits), and replacement parts (including repair kits). Until the relevant requirements of the consent decree are met, Philips Respironics will not resume selling new CPAP or BiPAP sleep therapy devices or other respiratory care devices in the US. Outside the US, Philips Respironics will continue to provide new sleep and respiratory care devices, accessories, consumables, replacement parts and services, subject to certain requirements. Further details will become available once the proposed Respironics consent decree has been finalized and submitted to the relevant US court for approval. For more information, refer to Contingencies.
In 2023, we also maintained manufacturing capacity to produce the necessary devices and rework kits required for remediation of the Respironics recall. As of December 31, 2023, over 99% of the sleep therapy device registrations that are actionable had been remediated, while the remediation of the ventilator devices remains ongoing. We expect to continue such remediation activities in 2024.
Philips Respironics regularly communicates on product remediation and testing associated with the recall with global regulators and customers through a variety of channels. Philips Respironics continues to monitor complaints received following the recall/field safety notice via our Quality Management Systems, in accordance with the medical devices regulations and laws.
In October 2017, Philips North America LLC reached agreement on a consent decree with the DOJ, representing the FDA, related to compliance with current good manufacturing practice requirements arising from inspections conducted in 2015 and prior. The consent decree focuses primarily on Philips' Emergency Care and Resuscitation (ECR) business operations in Andover, Massachusetts, and Bothell, Washington.
Following a successful inspection in Bothell, Washington, in April 2020, the FDA determined Philips had met the conditions for resuming manufacturing and distribution of defibrillators in the US. The consent decree remains in effect for several years, during which the Emergency Care (formerly Emergency Care and Resuscitation) business unit will be subject to a series of annual assessments by an independent expert. Hospital Patient Monitoring (formerly Monitoring & Analytics), also named in the consent decree, is also under a heightened level of scrutiny over the same period.
We continue to make substantial progress in our compliance efforts. In October 2022, the FDA inspected Emergency Care in Bothell as a consent decree follow-up. Three observations (Form 483) were issued and subsequently remediated and reported to the FDA. In June 2023, Emergency Care in Bothell received the October 2022 Establishment Inspection Report marking closure. In late October 2023, the FDA conducted a follow-up inspection to the 2022 inspection that resulted in a 483 with two observations, which were rapidly addressed in formal responses and subsequently acknowledged by the FDA the first week of January 2024 as closed. Efforts in 2024 are focused on ensuring the sustained demonstrated state of substantial compliance to support seeking formal relief in the first half of 2025, which is the earliest time allowed in the consent decree.
We cannot predict the outcome of this matter, and the consent decree authorizes the FDA, in the event of any violations in the future, to order us to cease manufacturing and distributing Emergency Care or Hospital Patient Monitoring devices, recall products, pay liquidated damages, and take other actions. We cannot predict whether additional monetary investment will be incurred to resolve this matter or the matter’s ultimate impact on our business.
As a health technology company operating in a highly competitive industry, Philips’ brand reputation depends on the safety, quality and security of our products and services. Failure to meet cybersecurity standards may cause patient harm, negatively impact customer operations and their ability to provide healthcare or provide unauthorized access to patient records and medical devices. Philips furthermore relies on information technology to operate and manage its businesses, as well as store and process confidential data (relating to patients, employees, customers, intellectual property, suppliers and other partners). For a discussion of cybersecurity risks facing our business, see “Products and services may fail quality or security standards, which could adversely affect patient safety or customer operations" and “Philips could be exposed to a significant enterprise cybersecurity breach” in section Operational risks. As of the date of this Annual Report, there are no breaches of cybersecurity or other related risk threats that have, or are reasonably likely to, materially affect our business.
Security risk management is part of our broader risk management processes, and its aim is to protect the confidentiality, integrity, and availability of Philips’ products and services. To this end, the company has established a Group Security function and implemented security management processes, requirements and controls for the assessment, identification and management of material risks from, amongst others, cybersecurity threats. Our Head of Group Security, reporting to our Chief Financial Officer, leads the Group Security function in supporting the Board of Management in evaluating and setting the Group’s security strategy, issuing security policies and evaluating the progress and effectiveness of the deployment of the company’s security management framework. Our Chief Information Security Officer, reporting to our Head of Group Security, has nearly 26 years of technology and information security management experience in the industry, including prior roles with the Dutch Government and multinationals in the Consumer goods, Manufacturing, Chemical and Food processing industries, in various roles ranging from Chief Information Security Officer to IT security officer and Security Architect. Our Chief Information Security Officer is informed of and monitors the prevention, detection, mitigation and remediation of cybersecurity incidents through the Global Security Operations Center.
The company’s security management framework, including its cybersecurity policies and procedures, is maintained by the Group Security function and is designed to implement security requirements into all applicable business processes, information processing systems and infrastructure pertaining to our products and services and our supporting and enabling functions, during the entire lifecycle. The framework includes risk, vulnerability and penetration assessments, mandatory yearly security training for all employees, (including new hires Regular Phishing simulations for all employees three times a year), monitoring and response activities for vulnerabilities identified in products, services and infrastructure.
The Group Security function is also responsible for addressing security risks, including monitoring cybersecurity threats and responding to cybersecurity incidents. Philips’ Global Security Operations Center monitors the prevention, detection, mitigation and remediation of cybersecurity incidents on global enterprise systems, supported by certain external services and periodic/intermittent assessments. The severity and materiality of incidents are assessed through a dedicated security incident reporting process and, if necessary, incidents are escalated through central crisis management and (potentially) to the Philips Disclosure Committee, which assesses the need for public disclosure of (material) incidents. Incidents, where needed, are further escalated to Global Crisis Management.
Additionally, in order to address the security risks associated with our suppliers and the services they provide, security controls are embedded in our procurement and supplier management processes, covering due diligence when engaging with new suppliers, contracting, monitoring and managing existing supplier relationships, and terminating supplier relationships. These security controls check for existing security certificates and assurances reports for the services in scope, validate suppliers’ answers to security questionnaires in due diligence, and ensure that security schedules are part of the signed contracts.
The Board of Management is ultimately responsible for Philips’ cybersecurity management, which is overseen by the Supervisory Board (and specifically its Audit Committee). As part of this process, quarterly reports on cybersecurity risks and incidents are prepared by the IT Audit & Risk Committee (consisting of representatives from the Group Security and Group IT functions, Philips Internal Audit and the external auditor and submitted to the Board of Management and the Supervisory Board. This reporting includes the overall risk level, relevant changes in the risk environment, challenges in reaching and/or maintaining current risk levels and actual risk responses in the form of actions and owners.
Below we show how Philips performed in 2023 on the 21 Core metrics of the WEF ESG reporting framework, mapped to the three dimensions of our ESG commitments, as well as a number of additional Philips-specific metrics that we consider fundamental to the strategy and operation of our business.
On the following pages we show how Philips performed in a number of key countries in 2023 on a subset of the WEF Core metrics, as well as a number of additional Philips-specific metrics that we consider fundamental to the strategy and operation of our business. In this section, revenues are on a stand-alone country basis (unconsolidated).
EUR 271 million revenues
EUR 172 million cost of sales
EUR 65 million tangible assets
EUR 3 million capital expenditure
The I&D Committee has some 115 volunteers engaged in Women, Race, Disabilities & Mental Health and LGBTQIA+, and Well-being. Philips Brazil has over 100 professionals with disabilities, and corporate meetings now have sign language interpreters. Focus remains on actions to increase psychological safety and well-being. in 2023, Philips Brazil delivered an internship program focused on Women in Tech and Race.
Philips Foundation continued to partner with SAS Brazil in bringing specialized healthcare to remote areas through technology and telemedicine. Primary healthcare units are equipped with digital virtual healthcare solutions to provide early diagnosis and remote physician referral. In 2023, new remote regions have been reached through the deployment of mobile health units.
Philips has engaged with health authorities at the federal, state and municipal levels to discuss the digital transformation of health and the development of innovative projects. Philips also attended stakeholder meetings as a board member of local medical technology trade associations.
EUR 2,294 million revenues
EUR 1,502 million cost of sales
EUR 391 million tangible assets
EUR 25 million capital expenditure
We continued to focus on gender diversity and achieved significant progress on women in leadership roles by building out our female talent pipeline. We are cultivating a culture of inclusion by rolling out our ‘be yourself’ storytelling campaign throughout the organization. We were recognized as a ‘Top Employer’ for the third consecutive year.
Through a collaborative effort with the Chinese Red Cross Foundation, Philips Foundation and Tsinghua University introduced high-risk pregnancy referral cards in rural China to reduce neonatal mortality rates. These easy-to-understand visual aids – initially introduced in sub-Saharan Africa – empower expectant mothers to identify potential pregnancy risks and seek timely medical care.
Philips has collaborated with government entities at central and local level, stakeholders from trade associations and academic institutions to discuss how to build up a resilient and sustainable healthcare system. Philips also continues to engage healthcare professionals on green hospital development and raise awareness in the healthcare community.
EUR 381 million revenues
EUR 245 million cost of sales
EUR 53 million tangible assets
EUR 5 million capital expenditure
Philips scored an overall rating of 94/100 in the government index on gender equity at work. There is continued focus on building a pipeline of talented women. Communication efforts around well-being and prevention of mental health problems were intensified with deployment of the project CARE. This project enables employees to attend meetings around mental health, physical health, disability, parenting, charity, and caring for others.
Philips Foundation and Philips France did not deploy specific volunteering activities in 2023. Philips France followed the global initiatives like supporting the recovery from the earthquake in Turkey.
Philips France continued to help accelerate the digital transformation of the healthcare system, contributing to the deployment of the program 'Le Ségur du numérique'. It is also partnering with Assistance Publique-Hôpitaux de Paris, Hôpitaux Civils de Lyon and Incepto (a PACS AI application platform) to make Artificial Intelligence more accessible to radiologists.
EUR 2,114 million revenues
EUR 1,142 million cost of sales
EUR 520 million tangible assets
EUR 16 million capital expenditure
We embedded I&D in the recruitment process to include non-discriminatory gender-equitable language, jobs also being advertised part-time, safeguarding the rights of people with disabilities, and promoting an open-minded mindset among recruiters and decision-makers. We have active Employee Resource Groups at our German locations, including Philips Women Lead.
In Hamburg, a substantial volunteer effort saw 70 Philips employees team up with 60 other volunteers to plant 3,150 native trees and shrub seedlings. Covering an area of 1,050 m2, this initiative is poised to evolve into a self-sustaining forest by 2026. In December, in an initiative with Signify and Versuni, employees fulfilled more than 350 Christmas wishes for children from challenging backgrounds.
Philips has been working closely with industry associations to help shape the Ministry of Health’s drafts for the 'Digital Law', 'Hospital Reform', and 'Health Data Use Act'. These drafts have also been discussed with members of the Bundestag. Philips continues to maintain good relations with hospitals, health institutions, and the Federal State Governments.
EUR 858 million revenues
EUR 440 million cost of sales
EUR 295 million tangible assets
EUR 29 million capital expenditure
ISC Philips Women’s League held PCOS and Cancer awareness sessions and sponsored financial, psychological and medical expert consultations for over 1,000 colleagues. Philips won a Bronze category award in the India Workplace Equality Index for its diversity and inclusion efforts. Psychological Safety Week focused on creating awareness with the launch of the #yourvoicematters campaign.
Employees fulfilled over 1,000 children's wishes through 'The Philips Wish Tree', donated 110 units of blood in a drive with the Armed Forces Medical College, and supported heart surgeries for 300 children. Additionally, they conducted a Telemedicine Drive in Varude Village and partnered with Rotary Indiranagar for pediatric heart surgeries.
Philips continues to work with industry associations and ministries to advance healthcare product regulations, sustainability initiatives, manufacturing and healthcare digital transformation. Furthermore, Philips inaugurated a state-of-the-art R&D facility in Bangalore in the presence of Karnataka's Chief Minister.
EUR 986 million revenues
EUR 765 million cost of sales
EUR 297 million tangible assets
EUR 6 million capital expenditure
To create an inclusive environment, employees from diverse backgrounds are introduced monthly as ‘Our Shining Stars’. In 2023, various I&D initiatives were conducted to raise breast and prostate cancer awareness, learn about LGBTQ+ and psychological safety, and promote internal and external networking.
Employees volunteered at the Yamathon Charity Event in Tokyo, with 21 participants completing a walk of the 30 stations of the JR Yamanote Line within 12 hours. This event raised JPY 8,500,000 for a children's hospice. At an internal event around the UN Sustainable Development Goals, employees focused on environmental efforts, cut fuel consumption by 4%.
Philips has been liaising with the Ministry of Health, Labor and Welfare on topics including reduction of healthcare professionals' working hours, digital transformation of healthcare, and reimbursement. Philips is a member of the European Business Council (EBC), one of Japan's main medical device trade associations, and represents EBC in a public-private study group developing government guidelines on sustainability of medical device supply.
EUR 8,282 million revenues
EUR 5,360 million cost of sales
EUR 1,523 million tangible assets
EUR 58 million capital expenditure
The dedicated Health & Well-being program for the Netherlands was extended with a pilot program for people leaders. The Employability & Vitality program offered Neuro Diversity Coaching, a Generational Differences seminar and Coping with Menopause. Also, Gender Transition Leave was embedded in the new Collective Labor Agreement. Site-specific initiatives continued to develop, with the help of Employee Resource Groups.
The Princess Máxima Center and Philips Foundation developed the KLIK Pain Monitor app. Children with cancer or their parents can self-report 'pain scores' at home 24 hours a day, thereby quickly getting in touch with caregivers from the Máxima Center. This app provides a sense of comfort to families, as they know that someone from the hospital is available to observe and provide advice.
Philips is a member of the European Round Table for Industry (ERT), which strives for a strong, open and competitive Europe. Philips is on the board of, among others, employers’ organization VNO-NCW and trade association FME, as well as public-private committees on innovation, talent, AI, cybersecurity, and health.
In 2023, Philips signed the Green Deal 3.0 'Working together on sustainable healthcare', supported by the Ministry of Health, Welfare and Sport, to share knowledge and contribute to the sustainable transition in healthcare.
EUR 270 million revenues
EUR 140 million cost of sales
EUR 22 million tangible assets
EUR 2 million capital expenditure
We continue to support Philips Women Network Poland, with a focus on coaching to support the career development of women at Philips. We also organized over 200 ultrasound examinations and 40 prostate-specific antigen (PSA) tests for our employees as part of breast and prostate cancer awareness campaigns, Pink October and Movember.
Philips Poland, together with other Eastern European countries, supported Ukrainian war victims by donating three advanced image-guided therapy systems to Ukraine. These systems, vital in performing low-invasive orthopedic and cardiovascular interventions, have been installed at a medical center conducting over 60,000 surgeries annually. Additionally, a new Philips Foundation project was established to create an educational program focused on positive health attitudes for young patients.
Philips Poland partnered 15 high-level representatives of Polish state hospitals on a study visit to the Netherlands, organized by the Think-Thank INNOWO to build awareness about innovative and sustainable healthcare solutions, technologies and processes. The English version of the ‘Green hospitals’ report by United Nations Global Compact Network Poland, of which Philips is a partner, was published. Philips also attended stakeholder meetings as a board member of local medical technology trade associations (POLMED, AmCham, NPCC).
EUR 449 million revenues
EUR 383 million cost of sales
EUR 92 million tangible assets
EUR 15 million capital expenditure
Philips made the ‘Mental Health at Work Commitment’, which is backed by a structured, long-term mental health action plan. Other diversity and inclusion activities included PRIDE, Black History Month and Cultural Awareness. We also achieved the next level of the ‘Disability Confident Committed’ Badge.
The roll-out of Philips UK & Ireland’s refugee program continued in 2023, with opportunities for refugees to attend career workshops and soft-skills training programs at one of Philips' offices. The program provided job-seeking and mentoring support, with opportunities to exchange experiences and build connections with mentoring volunteers. Employees also contributed to communities via volunteering days and events organized by the Philips UKI Armed Forces Network.
Philips continues to champion health system transformation, engaging with the government, AXREM and the NHS to help create a health system fit for the future through medical innovations with sustainable impact. Relations are maintained with the Association of British Health Technology Industries and Office of Life Sciences, and partnerships established with key academic institutions. In October, Philips UKI was named 'Company of the Year' at the Better Society National Sustainability Awards.
EUR 10,162 million revenues
EUR 6,515 million cost of sales
EUR 2,719 million tangible assets
EUR 122 million capital expenditure
We progressed on our I&D strategy, including increasing representation of under-represented talent, with a focus on Black and Latinx talent and women in leadership roles, increasing retention of internal diverse talent, and embedding inclusion, equity and belonging into the employee experience. We received multiple recognitions as a ‘best place to work’, e.g. on Forbes' Best Employer for Women, Best Employers for Diversity, and World’s Best Employers rankings.
Philips Foundation and Philips North America entered into a new partnership with March of Dimes to improve access to and quality of care for women and infants in the US. This collaboration involves equipping three mobile health trucks with handheld ultrasound devices and telehealth capabilities, specifically targeting women of childbearing age in underserved communities.
Philips connected with government leaders and key stakeholders at the federal and state level to advance our maternal health and remote monitoring solutions. Philips also continues to engage with the US Department of Health & Human Services' Office of Climate Change and Health Equity to discuss how to make healthcare more sustainable.
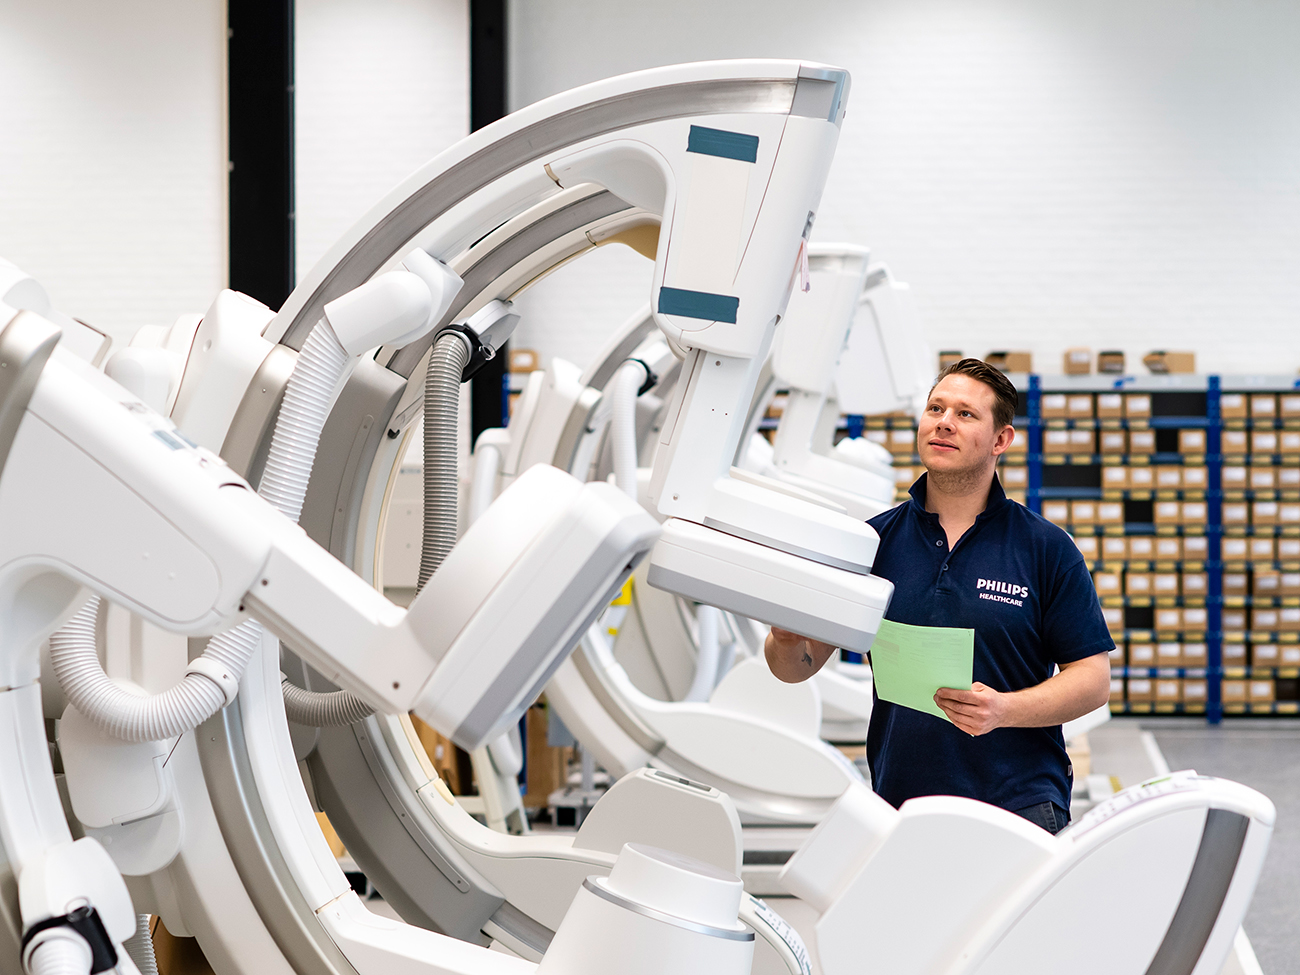
Risk management is integrated into our standard Operating Model
Explicitly connects our strategy and improvement initiatives to risk assessment
Evaluates the risk dynamics that could impact achievement of objectives and our main responses
Puts dedicated focus on risks related to Patient Safety and Quality
Philips approaches risk management as a value-creating activity that is integral to innovation and entrepreneurship. As such, it is part of the Philips Operating Model. The key elements of our risk management and control system are described in this chapter. There can be no absolute assurance that our risk management will avoid or mitigate all risks that Philips faces. The material risks are described in the section Risk factors.
The Board of Management (BoM) is ultimately responsible for identifying, analyzing and managing the risks Philips faces in executing its strategy and activities, for setting the risk appetite of the company, and for the design, implementation and maintenance of our risk management and control system, including the monitoring of its effectiveness. As described below, the Executive Committee (ExCo), several experts, Enterprise functions and committees support the BoM in the discharge of its responsibilities.
The ExCo is primarily responsible for identifying and mitigating materials risks to Philips. The ExCo is supported by the Risk Management Support Team, consisting of experts on various categories of risk, through regular analysis of the enterprise risk profile and enhancement of the risk management framework. In addition, management across the company is responsible for identifying critical risks and implementing appropriate risk responses within their areas of responsibility.
Various Enterprise functions (e.g. Legal & ESG, Patient Safety & Quality, Finance and Group Security) support the ExCo and management with the process of risk identification, risk management, and monitoring of key risk areas. With the support of these functions certain designated frameworks and activities to structurally manage specific risk areas are maintained and deployed, such as:
For further details refer to the section Governance.
To ensure clarity and alignment on the status of, and to make recommendations on key risk areas these functions have recurring items on the BoM meeting agenda. The BoM discusses these topics with participation from relevant ExCo members and other senior executives and subject matter experts. Furthermore, dedicated reports on these key risk areas are shared and discussed with the Supervisory Board and external auditors in the relevant Audit & Risk Committees facilitated by Internal Audit.
The Internal Audit function assesses the quality of risk management and controls through the execution of a risk-based audit plan, as approved by the Audit Committee of the Supervisory Board. The BoM and leadership from Businesses, Regions/Zones and key Functions meet quarterly with Internal Audit in Audit and Risk Committees to discuss strengths and weaknesses of risk management and controls – as evaluated by internal and external auditors and by means of other (self) assessments – and take corrective action where necessary.
The Disclosure Committee oversees the company’s disclosure activities and assists the BoM in fulfilling its responsibilities in this respect. The Disclosure Committee seeks to ensure that the company implements and maintains internal procedures for the timely collection, evaluation, and disclosure of information potentially subject to public disclosure under the legal, regulatory and stock exchange requirements to which the company is subject.
The Supervisory Board oversees Philips’ risk management including the identification of material risks, in relation to the risk appetite of the company, the response measures put in place and the effectiveness thereof. The Audit Committee and the Quality & Regulatory Committee of the Supervisory Board assist the full Supervisory Board in fulfilling its risk management oversight responsibilities. The Audit Committee reviews the quality of risk management and controls, and the reported findings of internal and external audits. The Quality & Regulatory Committee’s role particularly relates to the quality and regulatory compliance of the company’s products (including software), services and systems throughout their lifecycle.
The chapter Corporate governance of this report addresses the main elements of the company’s corporate governance structure, reports on how it applies the principles and best practice provisions of the Dutch Corporate Governance Code and provides other information relevant to risk management governance.
Philips seeks to manage risks consistently within its risk appetite. Risk appetite is set by the BoM, reviewed at least annually and published in the Philips risk management policy. It is effectuated through our Operating Model, of which various elements – such as our strategy, Philips General Business Principles (GBP) and behaviors, authority schedules, policies, process standards and performance management systems – include or reflect risk-taking guidance.
Philips’ risk appetite differs depending on the type of risk, ranging from an averse to a seeking approach. Philips operates within the dynamics of the health technology industry and aims to take the risks needed to ensure we continually revitalize our offerings and the way we work. At the same time, Philips is committed to act with integrity always and is averse to risks impacting our GBP, which include (but are not limited to) the Philips behavior ‘Patient safety, Quality, and Integrity always’. Our employees are expected to ensure compliance with our GBP, laws, and regulations, and to take action in the case of concerns or violations to our GBP. Please refer to the Philips General Business Principles (GBP) for more information. Philips’ risk appetite for the main risk categories is visualized below. Philips does not classify these risk categories in order of importance.
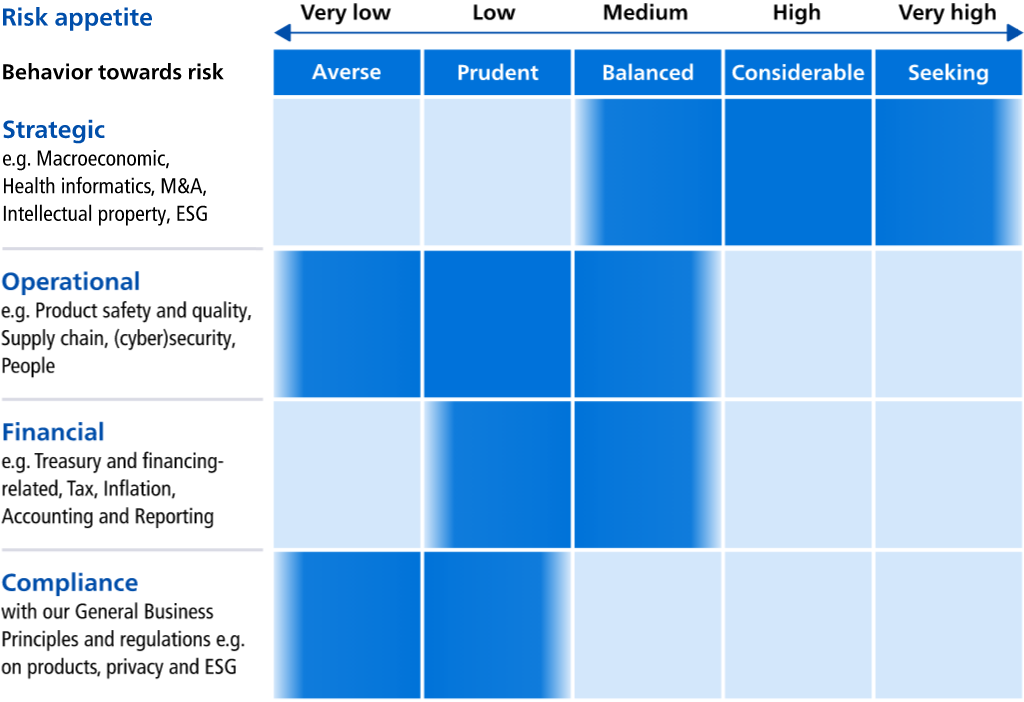
To provide a comprehensive view of Philips’ risks, structured risk assessments take place according to the Philips risk management process standard, applying a top-down and bottom-up approach. Our process standard is designed based on ‘Enterprise Risk Management: Integrating with Strategy and Performance’ (2017) from the Committee of Sponsoring Organizations of the Treadway Commission (COSO) and on ISO 31000 - Risk Management.
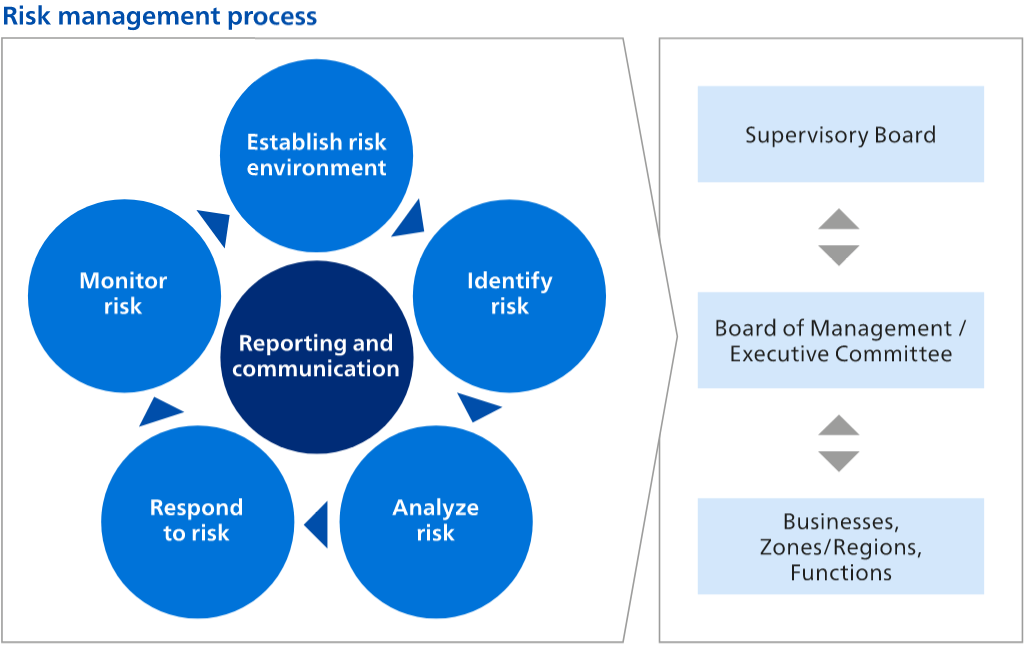
Key elements of the Philips risk management process are:
The measures taken during 2023 to further strengthen risk management include:
Philips believes the risks set out below are the material risks affecting Philips and its securities. These risk factors may not, however, include all the risks that ultimately may affect Philips. Some risks not yet known to Philips, or currently believed not to be material, may ultimately have a major impact on Philips’ business, revenue, income, assets, liquidity, capital resources, reputation and/or ability to achieve its business and ESG objectives. Please note that this section is not intended to describe risks that have materialized, as these are addressed in other sections and referenced where relevant. Philips defines risks in four main categories: Strategic, Operational, Compliance and Financial. Philips presents the risk factors within each category in order of our current view of their expected significance. Compared to the previous year we have further prioritized risk factors relating to patient safety and quality, supply chain, and the simplification of how we work. Although still relevant, we have de-emphasized risk factors related to pandemics. This does not mean that a lower-listed risk factor may not have a material and adverse impact on Philips’ business, revenue, income, assets, liquidity, capital resources, reputation, and/or ability to achieve its business and ESG objectives. Furthermore, other risk factors not listed below may ultimately prove to have more significant adverse consequences than the listed risk factors.
The visual below lists our material risks and how these relate to our plan for creating value with sustainable impact.
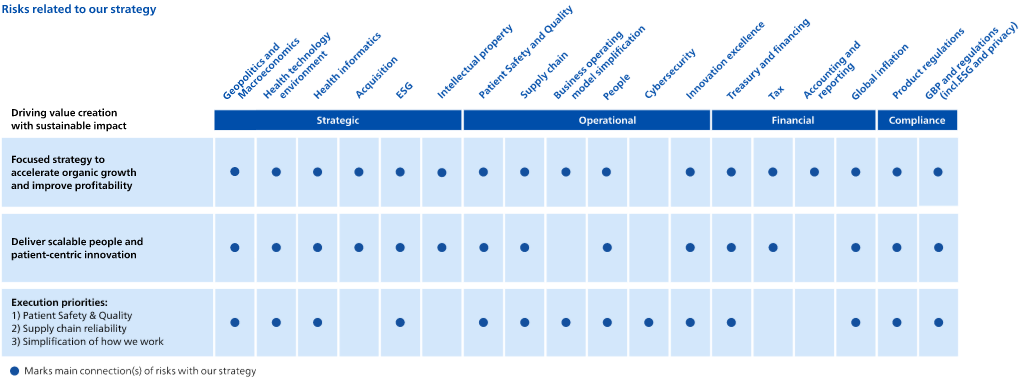
In the following sections we provide a description of each material risk factor, as well as our main risk mitigating responses, which we believe help us to manage these risks. However, we may not be successful in deploying some or all of these mitigating actions effectively, or these actions may not achieve the anticipated effect. If specific circumstances occur or are not sufficiently mitigated, our value creation objectives could be materially adversely affected. In addition, risks and uncertainties could cause actual results to vary from those described (including those described in forward-looking statements), could impact our ability to meet our targets, or could be detrimental to our reputation. The risk responses described below are designed to manage risks toward, and should be read in conjunction with, the Risk appetite as described above.
Philips’ business environment can be adversely impacted by macroeconomic and geopolitical conditions in global and individual markets. In 2023, Mature geographies accounted for 72% of Philips’ revenue, while Growth geographies accounted for the remaining 28%. Mature economies are currently the main source of Philips’ revenues, while growth economies are an increasing source of revenues. Philips produces, sources, and designs its products and services mainly from the United States (US), the European Union (EU) (primarily the Netherlands) and China, and the majority of Philips’ assets are located in these geographies. Changes in politics and monetary, trade and tax policies in the US, the EU and China may trigger reactions and countermeasures and may also have an adverse impact on other economies and international markets in which Philips is active. Philips continues to expect global market conditions to remain highly uncertain and volatile due to geopolitical and macroeconomic factors, whether or not they are related to or caused by the Russia-Ukraine war and/or the current situation in Israel and the larger Middle East region.
Philips observes a trend of geopolitical tensions and deglobalization which intensifies protectionism. Examples of protectionism measures are trade policies, tariffs, sanctions, local value creation and production requirements to obtain market access, custom duties, taxation, technology and data restrictions, cyberattacks, import or export controls, talent mobility restrictions, nationalization of assets, restrictions on repatriation of returns from foreign investments. In addition, there is general uncertainty on the development of local regulations and compliance thereto. Philips observes this trend in the major markets in which it operates and has a particular concern on the development of the US-China relationship and China’s drive to expand its global political footprint and become self-sufficient in critical technologies, including health-related ones.
If this trend continues, geopolitical relations deteriorate, and economies decouple, it is expected that existing global trade and investment restrictions will remain, and further regulatory and compliance challenges for doing business globally may emerge, resulting in continued pressure on market growth and investments.
Uncertainty and challenges regarding various global macroeconomic factors continue to persist. Examples of general factors are an overall weakening economic growth outlook, reduced government spending, declining customer and consumer confidence and spending, high inflation and interest rates, and the emergence of economic impacts related to the climate crisis. Although the ability to manage pandemics (for example, resurgences of COVID-19 or mutations thereof) has improved, pandemics may continue to affect Philips’ operations in the future. Examples of healthcare-specific potential factors include rising uncertainty over the future direction of public healthcare policy and the risk of declining public investment in healthcare ecosystems.
The Russia-Ukraine war has increased global economic and political uncertainty. Governments in the US, the UK, the EU, Canada, and Japan have each imposed export controls on certain products and sanctions on certain industry sectors and institutions in Russia, and additional controls and sanctions could be enacted in the future. Similarly, the conflict in Israel will further increase economic and political uncertainty and may affect the company’s results of operations, financial position and cash flows. Philips is present in Israel with several subsidiaries, mainly in Diagnosis & Treatment and Connected Care, that are primarily involved in manufacturing and research and development (R&D) activities. Upcoming elections in the US, the UK and the EU could also have an impact on the course of these conflicts. The ongoing conflicts may heighten the impact of other risks factors described herein, including but not limited to: volatility in prices for transportation, energy, commodities and other raw materials; disruptions in the global supply chain; decreased customer and consumer confidence and spending; increased cyberattacks; intensified protectionism; political and social instability; increased exposure to foreign currency fluctuations; rising inflation and interest rates; and constraints, volatility or disruptions in the credit and capital markets. It is possible that the conflict in Ukraine may escalate or expand and current or future sanctions and resulting geopolitical and macroeconomic disruptions could be significant. We cannot predict the impact the conflict may have on the global economy in the future.
Changes in geopolitical and macroeconomic conditions are difficult to predict, and the factors described above, or other factors, may lead to adverse impacts on global trade levels and flows, economic growth, and financial market and political stability, all of which could adversely affect the demand for, and supply of, Philips’ products and services. This may result in a material adverse impact on Philips’ business, financial condition, and operating results. These factors could also make it more difficult to budget and to make reliable financial forecasts or could have a negative impact on Philips’ access to funding.
Risk response: Philips monitors economic, political, and general societal changes and, where necessary, develops response strategies to such events. High-risk markets (for example, markets exposed to high volatility) are regularly assessed for emerging risks, and if necessary, capital structure planning is performed. The Philips Group Crisis Operations team has activated response teams that are running programs on Russia and Ukraine as well as Israel. To be less exposed to the uncertainty caused by the Russia-Ukraine war we actively reduced balance sheet exposure in this market. The response to the conflict in Israel is more complex as we also maintain a manufacturing footprint in the country. Developments in Israel are being monitored carefully by the response team to ensure the safety of our workforce in the country.
Philips is active in more than 100 countries, and we believe that this global footprint allows us to better deal with adverse local market developments. Philips establishes a strong local presence in both mature and growth geographies through market-specific strategies (for example for China, the US, and the EU). These market strategies cover various local value-creation aspects such as innovation, manufacturing and assembly; hosting of health data; and capability development. These strategies also leverage our in-depth knowledge of healthcare, Research & Development, Quality Management Systems, sustainable global business models, and brand. This local presence enables Philips to create value and tailor its propositions to local market needs. In addition to local measures, Philips also optimizes its integrated supply chain organization, supplier base, and global manufacturing footprint to enable agile responses to large and rapid shifts in demand and supply globally.
With Philips’ focus on health technology, our business model is transforming from transactional, product-focused business models to customer- and patient-centric, outcome-oriented business models, with multi-year customer partnerships enabled by a portfolio of innovative devices, solutions, platforms, insights and value-added services. If this transformation is made too slowly or is not successful, Philips may not meet the expectations of patients and other stakeholders in the health technology business environment. We may face a loss of customer relevance, fail to capture growth, and lose market share. In addition, because of our health technology focus, Philips may have a reduced ability to offset potential negative impacts (including, but not limited to, impacts on sales, operating results, liabilities, compliance, and financing) on its health technology business by other businesses through a more diversified portfolio. As a result of its focus on health technology, Philips is deepening customer engagement and entering into long-term solutions and services business arrangements and, as a result, is becoming more dependent on a number of key customers for long-term recurring revenues, thus increasing the risk that the loss of, or a significant reduction in, orders from one or more of our key customers could cause a significant decline in our revenues. As Philips looks to increase our use of indirect sales channels, Philips will increasingly rely on successfully leveraging new and existing partners to support end customers and patients. Any of these factors may have a material adverse impact on Philips’ brand value and reputation, business, financial condition, and operating results. More specific health technology risks and their potential impacts are included in the Operational, Financial and Compliance risk sections below as well as in the note Contingencies.
Risk response: Philips is running multiple interconnected initiatives intended to enable, strengthen and accelerate various aspects of our business model to the standards of the health technology solutions business environment including, but not limited to, patient safety, quality, patient-centric innovation, social impact, productivity and compliance. For examples of responses to these various aspects we refer to the related risk factors in this section.
Furthermore, we pursue the end-to-end alignment of our governance, processes and IT systems to maintain a people- and patient-centric portfolio of offerings. We are making our solutions and insights available through software as a service (SaaS) and platform-as-a-service (PaaS). We are also expanding digital customer engagement and e-commerce channels, as well as activation of our offerings in markets, either directly or through our managed network of partners. We run a partner management program aimed to ensure a strong network of committed partners who share our patient-centric mindset. Where Philips engages in long-term service-based business models, we aim to run a disciplined deal process with strict acceptance criteria. Our integrated portfolio of products, solutions and services covers the various stages in health, including healthy living, prevention, diagnosis, treatment and home care, without significant dependence on a single product, solution, service or market.
New digital technologies and ways of conducting business are fundamentally changing the health technology industry, and thus our competitive business environment. A key trend, started in radiology, is the application of artificial intelligence (AI) and machine learning (ML) to drive quality and efficiency in clinical and operational workflows. Customers need workflow-aware solutions that convert data from our imaging and monitoring systems into actionable insights. Another trend, accelerated by the pandemic, is the shift toward cloud-based Software as a Service (SaaS) business models and remotely upgradable and serviceable systems with suites of apps. These new types of offerings are enabled by hybrid cloud/on-premise digital platforms. Our informatics and systems businesses may fall behind established and new ‘born digital’ competitors if Philips fails to, in a timely way, develop the requisite capabilities, adjust its business models, and find ways to globally commercialize new products and services at scale. This could result in an inability to satisfy customer and patient needs, thereby missing out on revenue and margin growth opportunities, which may have a material adverse impact on Philips’ business, financial condition and operating results.
Risk response: In 2023 Philips brought all informatics businesses together into one end-to-end business, called Enterprise Informatics. Taking this enterprise-wide view, Philips unlocks insights at scale from combined imaging and monitoring data pools to improve workflows, enhance the caregiver and patient experience, and elevate care delivery. Enterprise Informatics will position Philips as a global leader and trusted partner in integrated diagnostics, though enterprise imaging capabilities, insights and analytics from patient monitoring and management, service line delivery, virtual care enablement and enterprise operations. The business has a software-oriented operating model, value chain and go-to-market capabilities tailored for informatics, and corresponding business model to enable it to scale. Philips embeds a coherent set of initiatives within this end-to-end Enterprise Informatics business to accelerate the transformation of informatics-enabled propositions. Some examples of these initiatives are mentioned here (without limitation). We are migrating and modernizing existing informatics propositions (such as Radiology Picture Archiving and Communications System (PACS) and image viewing) to the cloud, with a SaaS business model. This is done in an end-to-end approach, including IT backbone and go-to-market adjustments. We are developing new informatics propositions with explicit data and AI strategies, such as acute care management with clinical decision support. We are partnering, with technology providers and others, across our value chain to further enable the business to extend our propositions with state-of-the-art data and AI (including generative AI) capabilities, enabling Philips businesses to easily generate AI-enabled applications that can offer insights at scale to our customers. We are accelerating the rollout of our global cloud strategy, together with leading industry partners, such as Amazon Web Services (AWS). We are also transforming our traditional modality businesses, such as imaging and monitoring, toward offering ‘software defined systems’ with features, functions, and services that are primarily defined in software and continually upgraded over the lifetime to enable continuous value delivery to our customers (such as the enhancement of magnetic resonance systems with AI-based reconstruction or remote sensing capabilities, and preventative maintenance services).
Although Philips focusses on organic growth to deliver patient and people driven innovation at scale, selected acquisitions remain part of Philips’ growth strategy. We may not be able to integrate acquisitions successfully or efficiently with our existing operations, culture and systems, which may expose Philips to risks in areas such as sales and service, logistics, quality, regulatory compliance, legal claims, information technology, and finance. Integration challenges may adversely impact the realization of value creation expectations. Transactions may incur significant costs, result in unforeseen operating difficulties, divert management attention from other business priorities, and may ultimately be unsuccessful. Cost savings expected to be implemented, or other assumptions underlying the business case relating to a particular acquisition, may not be realized. If we are unable to accomplish any of our objectives in respect of any of our new acquisitions, we may not realize the anticipated benefits of such acquisitions and we may experience lower than anticipated profits, or even incur losses. Acquisitions may also lead to a substantial increase in long-lived assets, including goodwill, which may later be subject to write-down if an acquired business does not perform as expected, which may have a material adverse effect on Philips’ earnings.
Risk response: Philips maintains an active Mergers and Acquisitions funnel per business to ensure organizational fit. Philips aims to use a structured and disciplined acquisition process with strict acceptance criteria, budgets and tollgates, and time allocated for critical review of due diligence, including integration risks and expected integration benefits. A broad range of internal and external functional experts are involved in this process. Philips develops and deploys a high-quality post-acquisition integration playbook with set milestones and conducts value-creation progress reviews with the responsible business leader throughout the integration of each acquisition.
Environmental, Social and Governance (ESG) factors may directly and indirectly impact the business environment in which Philips operates. Philips may, from time to time, disclose ESG-related initiatives or aims in connection with the conduct of its business and operations (for example, with respect to reducing greenhouse gas emissions in its supply chain). However, there is no guarantee that Philips will be able to implement such initiatives or meet such aims within anticipated timeframes, or at all. In addition, there is an increasing focus from Philips’ stakeholders – including customers, employees, regulators, and investors – on ESG matters, and those stakeholders may also have ESG-related expectations with respect to Philips’ business and operations. For example, customers may focus on ESG-related criteria in buying our products, and any inability by Philips to address concerns about ESG-related matters could negatively impact sentiment towards Philips and our products and brands. There are an increasing number of regulatory and legislative initiatives in the EU and other jurisdictions to address ESG issues, which will (once implemented) require Philips to significantly increase the scope of mandatory ESG disclosures, including the Corporate Sustainability Reporting Directive (CSRD), European Sustainability Reporting Standards (ESRS) and the SEC’s proposed climate disclosure rules. They will introduce or extend a duty of care, requiring Philips to identify and act on adverse environmental and human rights impacts across the organization and potentially the entire value chain, beyond or different from our current efforts. These regulatory and legislative initiatives, in turn, could also affect how customers or other stakeholders perceive our products or business operations. If our products or business operations do not meet the criteria for sustainability according to, for example, the EU Taxonomy Regulation (including the related delegated regulations) or any other similar regulations, this may negatively affect how customers or other stakeholders view Philips. Philips may fail to fulfill internal or external ESG-related initiatives, aims or expectations, or be perceived to do so, or we may fail to report performance or developments adequately or accurately with respect to such initiatives, aims or expectations. In addition, Philips could be criticized or held responsible for the scope of its initiatives or goals regarding ESG matters. Any of these factors may have an adverse impact on Philips’ reputation and brand value, or on Philips’ business, financial condition and operating results.
Risk response: We have raised our 2025 ESG commitments and have adopted a comprehensive ESG framework. Environmental: We are working to minimize our impact on the planet by taking climate actions, driving the transition to a circular economy, implementing EcoDesign in our products, and partnering with our suppliers to reduce their environmental footprint. Social: We aim to deliver social impact by improving people’s health and well-being, offering the best place to work, and engaging with our suppliers and the communities where we operate. Governance: At Philips, everything we do is anchored by ethical and responsible practices. Our management structure, Operating Model, ethics framework and robust risk management help us maintain the highest standards. Our Board of Management monitors progress and assesses risks in relation to our ESG strategy and makes recommendations for the continuous improvement of our ESG endeavors. For more information, please refer to the chapter Environmental, Social and Governance. For our perspective on ESG-related compliance risk, please refer to this specific risk factor in the section Compliance risks.
Philips is dependent on its ability to obtain and maintain licenses and other intellectual property (IP) rights covering its products and services and its design and manufacturing processes. The IP portfolio is the result of an extensive IP generation process that could be influenced by a number of factors, including innovation and acquisitions. The value of the IP portfolio is dependent on the successful promotion and market acceptance of standards (co-)developed by Philips. This is particularly applicable to the segment ‘Other’, where licenses from Philips to third parties generate IP royalties and are important to Philips’ results of operations. The timing of licenses from Philips to third parties and associated revenues from IP royalties are uncertain and may vary significantly from period to period. Additionally, royalties are often based on sales by third parties, creating an exposure to macroeconomic effects and continuity of these third parties. A loss or impairment in connection with such licenses to third parties could have a material adverse impact on Philips’ financial condition and operating results. Philips is also exposed to the risk that a third party may claim to own IP rights to technology applied in Philips’ products and services. If any such claims of infringement of these IP rights are successful, Philips may be required to pay damages to such third parties or may incur other costs or losses.
Risk response: Philips has an Intellectual Property & Standards organization (IP&S) that proactively pursues the creation of new IP and the protection of existing IP in close co-operation with Philips’ operating businesses and the Innovation & Strategy function. IP&S is a leading industrial IP organization providing IP solutions to Philips’ businesses to support their growth, competitiveness and profitability. In addition, Philips believes our business is not materially dependent on any particular third-party patent or license, or any particular group of third-party patents and licenses.
The safety of patients and our brand reputation depends on the safety and quality of our products and services. Failure to meet product quality and security standards may cause patient harm, negatively impact customer operations and their ability to provide healthcare, provide unauthorized access to patient records and medical devices through cybersecurity incidents, and damage Philips' reputation and brand.
As a health technology innovator, our products and services must comply with rules and regulations that govern our operations, processes, and ways of working. Risks associated with non-compliance with quality, regulatory, and security assessments apply to pre-market activities (such as product design, production and supplier quality activities) and post-market activities. There are risks involving hardware, software and human error, spanning across the lifecycle, and involving third-party suppliers and components. Many of our products have multiple third-party software components, which may be exposed to security threats. We are subject to risk from known issues, and emerging potential issues. Potential consequences of these risks include damage to our brand reputation, competitive disadvantage, consent decrees (for example, the proposed Respironics consent decree described in note Subsequent events to the Consolidated financial statements), and losing our licenses to operate in specific markets, all of which may have a material adverse impact on Philips' business, financial condition, and operating results.
Risk response: Through a variety of Quality Operations improvement efforts, we are working to ensure that our products and services -- new and in-use in the field by our customers -- meet product quality and security standards. All employees across Philips recognize the need to meet product quality or security standards – and that failure could result in patient harm, negative impact to customers delivery of care, unauthorized access to patient records and medical devices and damage to Philips reputation and brand. Through a focus on fostering a culture of quality and patient safety, Philips employees are working together to mitigate operational and compliance risks.
Quality Operations efforts are carried out to strengthen processes involved in the design, development, materials, supplier quality, production manufacturing, installation, monitoring, and servicing of Philips health technology, products, and services. These activities apply to new and in-market products, hardware and software, third-party suppliers and more. Teams are addressing currently known issues and risks and safeguarding against potential emerging issues. For example, we are focused on Design Controls to verify and validate that product designs are robust prior to manufacture. We are emphasizing testing and inspection quality checks across the product lifecycle, which also involve in-process manufacturing, product release, installation, and servicing controls. We are addressing cost of design, yield, non-conformance, market activation and de-activation, stop-use orders, field recalls, repairs, financial claims, and liabilities.
This year, we also focused on strengthening post-market surveillance, implementing a global product safety and surveillance, corrections and removals team that is responsible for identifying issues (including detecting emerging issues), monitoring, and correcting issues related to our devices and software as early as possible. We closely monitor the quality of production and performance of suppliers. Strengthening processes such as Corrective and Preventive Action (CAPA) is contributing to continuous improvement across all businesses of Philips. Moreover, we are investing in improvements to our overall ways of working through our Quality Management Systems (QMS), standardizing where possible, reducing complexity, and reducing the number of QMSs in which we operate for more effective and efficient operations.
For further details refer to the section Quality & Regulatory and patient safety, as well as the notes Provisions and Contingencies.
Most of Philips’ operations are conducted internationally, which exposes Philips to supply chain challenges and uncertainties. Philips produces and procures products and parts in various countries globally. The production and shipping of products and parts, whether from Philips or from third parties, could be interrupted and may face increasing costs by various external factors, such as regional conflicts (e.g. the Middle East region), natural disasters, extreme weather events (the effects of which may be exacerbated by climate change) and geopolitics.
While macro trends around materials availability have improved in 2023, Philips’ medical systems stay in production for longer periods than the lifecycle of their semi-conductors and require continuous rejuvenation of their electronic components. Philips may fail to timely obtain or replace such components from existing supplies, and alternative sources of components could involve significant costs and regulatory challenges and may not be available to us on reasonable terms, adversely affecting our business and financial performance.
Our suppliers and our third-party service providers may also be exposed to labor shortages and potentially worsening macroeconomic and geopolitical trends. These factors may cause increased lead times and adversely impact our production capacity, which may negatively affect the delivery of products and services to customers, for example the postponement of equipment installations in hospitals. If Philips is not able to respond swiftly to those factors, this may result in an inability to deliver on customer needs, ultimately resulting in loss of revenue and margin.
Philips purchases raw materials, including rare-earth metals, copper, steel, aluminum, noble gases and oil-related products. While the macroeconomic trend of improved materials availability also positively impacts the raw materials and energy cost compared to 2022, there is no assurance that these raw materials will be available for purchase in the future or available at current costs.
Commodities have been subject to volatile markets, and such volatility is expected to continue and costs to increase. Costs may also increase as a result of stricter climate-change-related laws and regulations. Such legislation could require investments in technology to reduce energy use and greenhouse gas emissions, beyond what we expect in our existing plans, or could result in additional and increased carbon pricing. If Philips is not able to compensate for increased costs of energy, (sub-)components, (raw) materials, and transportation – either by reducing reliance thereon or passing on increased costs to customers – then price increases could have a material adverse impact on Philips’ business, financial condition, and operating results.
Philips may increase its dependency on a concentration of external suppliers, as a result of the continuing process of creating a leaner supply base and launching initiatives to replace internal capabilities with less costly outsourced products and services. These initiatives also need to be balanced with local-market value-creation requirements, including those relating to local manufacturing and data storage.
Although Philips works closely with its suppliers to avoid supply discontinuities, there can be no assurance that Philips will not encounter future supply issues, causing disruptions or unfavorable conditions. Furthermore, while the materials supply has improved in 2023, the challenges in our capability for the planning and synchronization of supply with demand continue, which combined with a drive for inventory reduction and cash flow improvements, can lead to further materials running out of stock, which could have a material adverse impact on Philips’ business, financial condition and operating results.
Risk response: Philips has put in place a process to assess and reduce the supply risk of its critical products. The two-pronged mitigation approach addresses the supplier risk and the component obsolescence risk of its printed circuit board assembly (PCBA). The supplier risk management framework assesses and manages suppliers from various perspectives, such as strategic fit, financial stability, operational performance and quality, sustainability, compliance, and location. We also maintain close relationships with our suppliers and maintain an ongoing dialogue on our forecast. The PCBA Refresh process identifies components that are either obsolete or that have an announced future obsolescence date, and proactively replaces them, ensuring continuous availability of active components. Furthermore, Philips is engaging with senior government officials, strategic suppliers and foundries to prioritize healthcare supplies, directly working on component issues across all tiers of suppliers and diversifying sourcing of high-risk components. These actions, together with a trend in improved materials availability in markets, have yielded a normalized materials supply in 2023 and have reduced the cost of spot buys. Internally, Philips is making balanced investments in global and local supply chain capabilities to improve end-to-end planning, synchronization of supply with demand, and data management.
We continue to deploy our strategy for a more regional versus global approach to our end-to-end network design, taking into account factors such as customer proximity, leveraging manufacturing capabilities, our environmental footprint, and efficiency. We are using our multi-modality sites, in combination with contract manufacturing partners, to regionally ‘multi-source’ many of our products.
Philips manages carbon pricing risk by reducing its full value-chain carbon footprint, as well as partnering with suppliers to reduce their environmental footprint and closely monitor carbon regulations, including carbon taxes. Philips manages the risk of rising commodity prices by several means, including engaging in long-term contracts and keeping physical inventories. Philips closely monitors price developments and takes pricing action where appropriate. Philips conducts various scenario assessments and develops response strategies to events potentially impacting its supply chain, such as geopolitical changes, regional conflicts, natural disasters, emerging markets volatility, and pandemics. We run various global warming and weather scenarios on the geographical footprint of our facilities, as well as our suppliers’ facilities, in line with the recommendations of the Task Force on Climate-Related Financial Disclosures.
As announced in January 2023, a simplified, more agile operating model is a priority to improve the execution of our strategy. If we do not effectively simplify the organization and our ways of working, which changes include, but are not limited to, changes in governance, roles, processes, and IT landscape and architecture, this may result in limiting our ability to fully realize our business ambitions with respect to delivering sustainable impact, meeting critical patient and customer needs, delivering integral value proposition, growing the business, and/or maintaining business continuity. While Philips has implemented a new operating model to simplify the organization and improve its ways of working, Philips may need to undertake further changes and related restructuring in the future if the operating model ultimately proves to be wholly or partly unsuccessful.
To simplify ways of working and improve performance, Philips continuously seeks to create a more open, standardized, and cost-effective IT landscape. Approaches include outsourcing, offshoring, integration, and consolidation of IT systems. These changes may elevate third-party dependency risks regarding the delivery of IT services, the availability of IT systems, and the functionality offered by IT systems. Although Philips has sought to strengthen security measures and quality controls related to these systems, these measures may prove to be insufficient or unsuccessful, which may lead to a material adverse impact on Philips’ business, financial condition, and operating results.
Risk response: By implementing the new Operating Model, Philips strengthened the governance and clarified roles and responsibilities in the organization. In addition, Philips makes multiple focused efforts to simplify the way we work; drive accountability, increase agility; and realize significant productivity gains. Simplification of the organization and ways of working is a primary enabler for better orchestrated execution. Philips has established an Enterprise Excellence organization to drive end-to-end orchestration of this change. The Enterprise Excellence organization comprises, among others, Enterprise Process excellence, IT, and Global Business Services (GBS), and it works closely with the established Process & System Excellence teams in Business Units and Centers of Excellence to ensure effective implementation of the strategy. In addition, the Enterprise Excellence organization provides best practices such as Lean, Agile, and Project and Performance Management to support Business Units, Regions, and Functions in simplifying ways of working and realizing their strategic ambitions. The regional organization is execution-focused, with account management, indirect partner management, local (service) delivery, government relations, and local infrastructure to support an integral customer approach.
Philips will simplify its Process Framework to provide critical enterprise standards and best practices to secure quality and compliance, while at the same time enabling Business Units and Regions to simplify and optimize ways of working to meet to specific patient, customer, consumer and business needs.
Philips uses structured IT risk management methodologies to identify and address risks to our critical business applications. Our ongoing IT Business Continuity Management activities include real-time monitoring of availability and redundancies, as well as testing and upgrading of applications. We regularly validate IT systems with our IT change management capabilities, we make sure that changes of an IT system are executed in a controlled way and sufficiently tested to minimize the impact of business disruptions in the case of failures of the system.
The attraction and retention of talented employees is critical to Philips’ success, and the loss of employees with specialized skills could result in business interruptions. There is strong competition for talent in key capability segments, and Philips needs to attract and retain critical talent. If employees perceive the workload following the recent operating model transformation and workforce reduction to be overly burdensome or prefer more flexibility than offered by our hybrid working policies, to mention two, employees may choose to terminate their employment with us. In this case, efficiencies in workflow may be impacted, or we may experience employee unrest, slowdowns, stoppages or other demands, such as overburden of the remaining employees. Philips is competing for the best talent and most sought-after skills, and there is no assurance of succeeding compared to other companies in attracting and retaining the highly qualified employees needed in the future. Wage inflation is increasing the competition for talent as well as the cost of labor. This may negatively impact our ability to realize our plan for creating value with sustainable impact, and if we are unable to offset the increased costs of labor through higher selling prices and increased productivity, then rising costs could also have a material adverse impact on Philips’ business, financial condition and operating results.
Risk response: Philips continuously assesses capability gaps for its key positions and has initiatives in place to close any employee capability gaps. This includes monitoring and understanding the drivers behind attrition, maintaining appropriate remuneration structures aimed at attracting and retaining talent, and leveraging its purpose and contribution to societal and environmental challenges, as a differentiating proposition for employees. Philips measures employee engagement through regular surveys and benchmarks the results across the organization against high-performing external norms. Philips performs deep-dives where necessary and drives improvement actions to address any gaps. For example, the company is running a Future of Work program to drive a hybrid-model approach, with continued emphasis on embracing flexibility, being at our best, and engaging in impactful collaboration.
Philips relies on information technology to operate and manage its businesses, as well as store and process confidential data (relating to patients, employees, customers, intellectual property, suppliers and other partners). Philips’ products, solutions and services increasingly contain sophisticated and complex information technology. The healthcare industry is subject to strict privacy, security and safety regulations with regard to a wide range of health information. At the same time, geopolitical conflicts and criminal activity continue to drive increases in the number, severity, and sophistication of cyberattacks globally. Considering the general increase in cybercrime, our customers and other stakeholders are becoming more demanding regarding the cybersecurity of our products and services. As a global health technology company, Philips is inherently and increasingly exposed to the risk of cyberattacks and potential impact of attacks on our suppliers. Information systems may be damaged, disrupted (including the provision of services to customers), or shut down due to cyberattacks. In addition, breaches in the security of our systems (or the systems of our customers, suppliers, or other partners) could result in the misappropriation, destruction, or unauthorized disclosure of confidential information (including intellectual property) or personal data belonging to us or our employees, customers, suppliers or other partners. These risks are particularly significant with respect to patient medical records. Cyberattacks may result in substantial costs and other negative consequences, which may include, but are not limited to, lost revenues, reputational damage, remediation and enhancement costs, penalties, and other liabilities to regulators, customers and other partners. Philips has not encountered any material breaches or other significant cybersecurity incidents in 2023. While Philips deals with the operational threat of cybercrime on a continuous basis and has so far been able to prevent significant damage or significant monetary cost in taking corrective action, there can be no assurance that future cyberattacks will not result in material or other consequences than as described above, which may result in a material adverse impact on Philips’ business, financial condition and operating results.
Risk response: Philips has established a Group Security function and implemented security management processes and controls, and monitors risk trends on material security topics, such as the risk of security breaches and ransomware attacks, in our information systems and our products and services. The Philips Board of Management continually monitors the risks, as well as required investments and progress made on the programs to reduce security risk. Risk workshops are held across the company to calibrate cybersecurity risks. Philips is deploying security risk management further into our Businesses and Functions to enhance the completeness and quality of overall risk reporting, and to manage identified improvement actions.
Philips assesses and continuously improves key security controls (e.g., strengthening endpoints, email security, and network security, and conducting global vulnerability scans, including mitigation of vulnerabilities). We have strengthened the IT function to ensure IT systems are kept up to date and applications are designed and developed with security in mind. We run initiatives to enhance security awareness for all Philips staff. For example, there are mandatory security trainings and specific phishing trainings, and we give additional focus to groups who need it across the company. Philips evaluates its supply chain and continuously monitors the security maturity of critical suppliers, as well as their performance against contractually agreed security standards. Philips continuously improves the Philips Operating Model to ensure adequate security management of products and services via the Quality Management Systems. Philips maintains relationships and cooperates with several government intelligence and law enforcement agencies, as well as with healthcare-specific Information Sharing and Analysis Centers (ISACs) and Cyber Emergency Response Teams (CERTs), to remain abreast of new threats.
To gain sustainable competitive advantage and create value with sustainable impact, Philips aims to deliver scalable, people-centric, and patient-centric innovations. It is important that Philips innovates and delivers these innovations in close collaboration with its customers on a timely basis and at scale. The emergence of new low-cost competitors, particularly in Asia, the rise of artificial intelligence (AI) and data driven solutions, and the increasing importance of product and cyber security, further underlines the importance of improvements in the innovation process. Success in launching innovations depends on a number of factors, including development of value propositions, architecture and platform creation, product development, market acceptance, production, and delivery ramp-up. It is also dependent on addressing potential quality issues or other defects in the early stages of introduction, and on attracting and retaining skilled employees. Costs of developing new products and solutions may partially be reflected on Philips’ balance sheet and may be subject to write-down or impairment depending on the performance of such products or services. The significance and timing of such write-downs or impairments are uncertain, as is the ultimate commercial success of new product introductions. Accordingly, Philips cannot determine in advance the ultimate effect that innovations will have on its financial condition and operating results. If Philips fails to create and commercialize its innovations at scale, it may lose market share and competitiveness, which could have a material adverse effect on its financial condition and operating results.
Risk response: In 2023, innovation activities have moved from the central Innovation & Strategy function to Business Units and as such closer to the customer. Philips is in continuous dialogue with customers to understand their needs and to reaffirm that its strategy is translated into a balanced portfolio of products, software, services and integrated solutions with a corresponding innovation pipeline close to its strategic core. Ways of working are anchored in standardized processes and tools in all aspects of customer-needs-focused innovation (from exploration to launch in the market and eventually customer success management). In addition, a number of initiatives are running to improve innovation capabilities, in areas such as software and systems engineering, data and AI, product and cybersecurity, and usability. These initiatives, taken together, will improve innovation effectiveness, efficiency, quality, and regulatory compliance.
Negative developments impacting the liquidity of global capital markets could affect Philips’ ability to raise or re-finance debt in the capital markets or could lead to significant increases in the cost of such borrowing in the future. If the markets expect a downgrade by the rating agencies, or if such a downgrade has actually taken place, this could increase the cost of borrowing, reduce our potential investor base and adversely affect our business.
Philips’ financing and liquidity position may also impact its ability to implement or complete any share-buyback program or distribute any dividends in accordance with its dividend policy or at all. Any announced share-buyback program or dividend policy may also be amended, suspended or terminated at any time, including at Philips’ discretion or as a result of applicable law, regulation or regulatory guidance, and any such amendment, suspension or termination could negatively affect the trading price of, increase trading price volatility of, or reduce the market liquidity of Philips’ shares or other securities. Additionally, any share-buyback program or distribution of dividend could diminish Philips’ cash or other reserves, which may impact its ability to finance future growth and to pursue potential future strategic opportunities. Any share-buyback program or dividend payment will depend on factors such as availability of financing, liquidity position, business outlook, cash flow requirements and financial performance, the state of the market and the general economic climate, and other factors, including tax and other regulatory considerations. Philips and its subsidiaries may also be subject to limitations on the distribution of shareholders’ equity under applicable law.
Philips operates in over 100 countries and its reported earnings and equity are therefore inevitably exposed to fluctuations in the exchange rates of foreign currencies against the euro. Philips’ sales and net investments in its foreign subsidiaries are sensitive in particular to movements in the US dollar, Japanese yen, Chinese renminbi, and a wide range of other currencies from developed and emerging economies. Philips’ sourcing and manufacturing spend is concentrated in the EU, the US and China. Income from operations is particularly sensitive to movements in currencies of countries where Philips has no or very small-scale manufacturing/local sourcing activities but significant sales of its products or services, such as Japan, Canada, Australia, the United Kingdom, and a range of emerging markets, such as South Korea, Indonesia, India and Brazil.
In view of the long lifecycle of health technology solution sales and long-term strategic partnerships, the financial risk of counterparties with outstanding payment obligations creates exposure risks for Philips, particularly in relation to accounts receivable from customers, liquid assets, and the fair value of derivatives and insurance contracts with financial counterparties. A default by counterparties in such transactions can have a material adverse effect on Philips’ financial condition and operating results.
Contingent liabilities may have a significant impact on the company’s consolidated financial position, results of operations and cash flows. For an overview of current cases please refer to the note Contingencies.
Risk response: At Philips, liquidity is monitored by the Group Treasury department, which tracks the actual cash flow for the Group against forecasts of the liquidity requirements on both a short- and longer-term basis. This includes regular reviews of liquidity versus credit rating constraints and scenario analysis to assess the risk of potential downgrades in credit ratings. Philips manages the available liquidity for the Group in several ways, e.g., by spreading maturities of external debt over time and by having appropriate standby credit facilities available. As an example, on August 30, 2023, Philips issued EUR 500 million fixed rate notes due 2031 under its Euro Medium Term Note program. Proceeds were used to repay an outstanding term loan in the same amount. Weighted average maturity of long-term debt increased from 6.5 years to 7.1 years. Additionally, in the first quarter of 2023 the maturity of the EUR 1bn revolving standby credit facility was extended by one year to March 2028.
Philips hedges the anticipated net exposure of developed-market foreign currencies resulting from sales, purchases and net investments in its foreign subsidiaries in those currencies. For emerging markets, Philips mainly relies on pricing adjustments for its products and services to counteract any expected depreciation of emerging-market currencies. Philips performs ongoing evaluations of the financial and non-financial condition of its customers and other counterparties and uses various tools to manage credit risks.
Please also refer to the note Details of treasury and other financial risks.
Philips is exposed to tax risks that could result in double taxation, penalties and interest payments. The source of the risks could originate from local tax laws and regulations as well as international and EU regulatory frameworks. These include transfer pricing risks on internal cross-border deliveries of goods and services, as well as tax risks relating to changes in the transfer pricing model. Examples of initiatives that may result in changing tax rules include, but are not limited to, the plans adopted by the Dutch parliament to abolish the tax exemption for dividend withholding tax on share buy backs with effect from 2025 and the OECD/G20 Inclusive Framework to address the allocation of income to user markets (Pillar One) and a 15% minimum corporate income tax rate (Pillar Two). The formal adoption of Council Directive (EU) 2022/2523 (the Pillar Two Directive) in December 2022 aims to achieve a coordinated implementation of Pillar Two in EU member states. The Dutch government adopted the Minimum Tax Rate Act 2024 (MTR Act) in December 2023 and the Pillar Two legislation will be applicable in local law with effect from 2024. As for Pillar One, it is too early to assess the potential impact. Philips is closely following the developments of this initiative.
As Philips maintains substance in the form of relevant assets and personnel in the countries in which it operates, and with the recently provided transitional safe harbor rules (based on Country-by-Country report) enacted by OECD, Philips currently expects to have limited exposure to taxation under Pillar Two. Pillar Two may still impose an additional tax burden on a jurisdiction-by-jurisdiction basis (which do not meet the transitional safe harbor rules) and increase Philips’ tax compliance burden significantly.
Furthermore, Philips is exposed to tax risks related to acquisitions and divestments, permanent establishments, tax loss, interest and tax credits carried forward, and potential changes in tax law that could result in higher tax expenses and payments. The risks may have a significant impact on local financial tax results, which could adversely affect Philips’ financial condition and operating results. The value of the deferred tax assets, such as tax losses carried forward, is subject to the availability of sufficient taxable income within the tax loss-carry-forward period. The ultimate realization of the company’s deferred tax assets is uncertain. Accordingly, there can be no absolute assurance that all deferred tax assets, such as (net) tax losses and credits carried forward, will be realized.
Risk response: Philips has a globally organized and experienced tax function, which is accountable for the definition and execution of the tax strategy and for the tax position of Philips worldwide. It advises management on the tax implications of intended decisions, performs appropriate tax planning to support business goals, and ensures compliance with all local and international tax laws. Philips has a Tax Control Framework in place, which creates awareness of and ensures adherence to current tax policies.
Philips will be in full compliance with Pillar Two whereby we will be leveraging our existing digital tax systems to ensure an efficient and high-quality process to determine countries in scope, calculate the additional tax liability (if any) and enable timely filing.
Potential risks are carefully monitored and dealt with by tax specialists from relevant areas (e.g., corporate income tax, transfer pricing, indirect taxes, wage tax and tax accounting). There are extensive controls in place on processes and systems to address these risks, which are discussed in detail in the Country Activity and Tax Report and in the note Income taxes.
Accurate disclosures provide investors and other market professionals with significant information for a better understanding of Philips’ businesses. Failures in internal controls or other issues with respect to Philips’ public disclosures, including disclosures with respect to cybersecurity risks and incidents, could create market uncertainty regarding the reliability of the information (including financial data) presented. This could have a negative impact on the price of Philips securities. In addition, the reliability of revenue and expenditure data is key for steering the businesses and for managing top-line and bottom-line growth. The long lifecycle of health technology solution sales, from order acceptance to accepted installation and servicing, together with the complexity of the accounting rules recognizing revenue in the accounts, presents a challenge in terms of ensuring consistent and correct application of the accounting rules throughout Philips’ global business. Significant changes in the way of working, such as the changes made to our operating model, restructurings, and shifting processes to remote Global Business Services locations, may have an adverse impact on the environment under which controls are executed, monitored, reviewed, and tested. Any flaws in internal controls, or regulatory or investor actions in connection with flaws in internal controls, could have a material adverse effect on Philips’ business, financial condition, operation results, and reputation and brand.
Risk response: The Philips’ Business Control Framework (PBCF) sets the standard for risk management and internal control over financial reporting. Key components of the PCBF are the standards on management, testing of controls, and our Financial Code of Ethics. The code is designed to deter wrongdoings; to promote honest and ethical conduct; to ensure full, fair, accurate, timely, and understandable disclosures; and to encourage internal reporting of (suspected) violations. Please also refer to the section Our approach to risk management for more information on the PBCF.
Changes in macroeconomic conditions, supply chain constraints, labor shortages, the conflict in Ukraine, and steps taken by governments and central banks, including in response to the COVID-19 pandemic as well as recent stimulus and spending programs, have led to higher inflation, which is likely, in turn, to lead to increased interest rates and adverse changes in the availability and cost of capital. These inflationary pressures could affect our manufacturing costs, operating expenses (including wages), and other expenses. We may not be able to compensate for increased costs by driving productivity to reduce costs and by passing these cost increases on through price measures in a timely manner, if at all, which could have an impact on our gross margins and profitability. Our business also operates in certain countries that have experienced hyperinflation, including Argentina and Turkey, and hyperinflationary conditions in any of the markets in which we operate may have a material adverse effect on our business, result of operations and financial condition. Inflation may also cause our customers to reduce or delay orders for our products, which could have a material adverse effect on our business, results of operations, and cash flows.
Risk response: To improve agility and productivity, Philips has stepped up its performance initiatives to remove organizational complexity, optimize quality and simplify ways of working. The following sentences summarize key initiatives. Procurement spend reduction through consolidation of suppliers and leveraging low-cost locations. Investing in the relationships with our suppliers and maintain an ongoing dialogue to align our demand forecast to their supply allocation and manage the risk of rising prices by several means, including engaging in long-term contracts and keeping physical inventories. Reductions of Supply chain cost through rationalization of manufacturing, warehousing, logistics providers, digitalization, and remote servicing. R&D productivity increases through platforms and footprint simplification, and simplification of our product designs. And general productivity measures, including organizational restructuring, headcount reduction, real estate optimization and the expansion of our Global Business Services and automation initiatives.
Refer to the note Details of treasury and other financial risks for financing costs management examples.
Furthermore, we closely monitor inflation development to enable timely action if needed. Currently Philips mainly relies on pricing adjustments for its products and services, as well as periodic indexation clauses in long-term contracts, to counteract cost increases as well as to build capabilities to drive value extraction and handle inflation for the foreseeable future, for example, through training of commercial teams.
Our reputation and license to operate depends on our compliance with global regulations and standards. Operating in a highly regulated health-technology industry, our products and services, including parts and materials from suppliers, are subject to regulation by various government and regulatory agencies, e.g., FDA (US), EMA (Europe), NMPA (China), MHRA (UK), ASNM (France), BfArM (Germany), and IGZ (the Netherlands). In the EU, the Medical Device Regulation (EU MDR) became effective in May 2021 and imposes significant additional pre-market and post-market requirements. Examples of other product-related regulations are the EU’s Waste from Electrical and Electronic Equipment (WEEE), Restriction of Hazardous Substances (RoHS), Registration, Evaluation, Authorization and Restriction of Chemicals (REACH) and Energy-using Products (EuP) regulations. We are subject to various European, United States, and domestic, and foreign environmental laws and regulations, which are continuing to develop. Any failure to comply with such laws and regulations could jeopardize product quality, safety, and security or expose us to lawsuits, administrative penalties, and civil remedies, all of which may have a material adverse impact on Philips’ business, financial condition, and operating results.
Philips has observed an increase in safety and security requirements in a variety of new and upcoming legislation dealing with market access of consumer goods, medical devices, information and communication technology products, Cloud services, and specific areas such as data protection, cybersecurity, AI, and supply chain.
Both regulators and customers require us to demonstrate legal compliance and adequate security management using national and international standards and associated certifications. Non-compliance with conditions imposed by regulatory authorities, including in connection with the proposed Respironics consent decree relating to the Respironics recall or any similar regulatory undertakings, could result in product recalls, a temporary ban on products, stoppages at production facilities, remediation costs, fines, disgorgements of profits, and/or claims for damages. Product safety incidents or user concerns could jeopardize patient safety and/or trigger inspections by the FDA or other regulatory agencies, which, depending on the results of such inspections, could trigger the impacts described above, as well as other consequences. These issues could adversely impact Philips’ financial condition or operating result through lost revenue and cost of any required remedial actions, penalties or claims for damages. They could also negatively impact Philips’ reputation, brand, relationship with customers and market share. In particular, Philips is exposed to the ongoing impact of the Respironics voluntary recall/field action and related matters. Please refer to the section Quality & Regulatory and patient safety and the note Contingencies.
Risk response: Philips is committed to complying with all applicable laws, regulations, and standards as a means of delivering safe, effective, and high-quality products, services, and solutions. Our Regulatory Affairs team closely monitors developments across the regulatory landscape, with specialist teams operating at central, business, and regional levels. A new Regulatory Science and Policy team is helping to shape and define industry standards. Additionally, this team is involved with improving processes, and offers programs to ensure that employees are aware of and able to comply with requirements. In the event of compliance issues, we actively engage with the regulatory authorities to resolve, mitigate, and work on remediation, as required.
We are actively working on remediation related to the June 2021 voluntary recall notification for certain sleep and respiratory care products by our subsidiary, Respironics. Philips is actively collaborating with United States Department of Justice, acting on behalf of the FDA, to finalize the proposed Respironics consent decree. We publish updates on the Respironics field action on our corporate website,www.philips.com.
For more information, refer to the sub-section Quality & Regulatory and patient safety in the Governance section of the ESG chapter in this report and the notes Provisions and Contingencies
In the execution of its strategy, Philips could be exposed to the risk of non-compliance with business conduct rules and regulations and our General Business Principles, including, but not limited to, patient safety, quality, anti-bribery, healthcare compliance, privacy and data protection, as well as upcoming ESG disclosure requirements and due diligence requirements. This risk is heightened in Growth geographies, as the legal and regulatory environment is less developed compared to Mature geographies. Examples of compliance risk areas include commission payments to third parties and remuneration payments to agents, distributors, consultants and similar entities, as well as the acceptance of gifts, which may be considered in some markets to be normal local business practice. The ongoing digitalization of Philips’ products and services, including its processing of personal data, increases the importance of compliance with privacy, data protection and similar laws. These risks could adversely affect Philips’ financial condition, reputation and brand and trigger the additional risk of exposure to governmental investigations, inquiries and legal proceedings and fines. In various jurisdictions, ESG disclosure requirements are currently being drafted. In Europe, the Corporate Sustainability Reporting Directive and European Sustainability Reporting Standards have been approved. The latter will significantly increase the scope of mandatory ESG disclosures. Philips needs to report over FY 2024 in line with the requirements of the CSRD and the ESRS. In addition, the proposed European Corporate Sustainability Due Diligence Directive and similar regulations and directives or other rules will (if implemented) require companies to identify and act on adverse environmental and human rights impacts across their organization – and potentially their entire value chain. Failure to meet these requirements could trigger the additional risk of exposure to inquiries from supervisory bodies and adversely affect Philips’ reputation and brand or could adversely impact Philips’ financial condition or operating result through lost revenue and cost of any required remedial actions, penalties or claims for damages.
For further details, please refer to the sub-section Legal proceedings within the note Contingencies.
Risk response: Over the years, we have extensively transformed the company and strengthened our business processes. As part of that, we have invested substantially in adherence to our General Business Principles (patient safety, quality and integrity always) through the deployment of compliance and awareness programs, as well as the establishment of policies and processes that reinforce adherence. With respect to privacy and data protection, Philips has established a privacy compliance framework, which includes policies, standards and procedures (such as the Binding Corporate Rules), with the aim of ensuring and demonstrating compliance with applicable data protection laws and regulations. Philips has a strong track record on ESG disclosures, often ahead of legislation, and has been closely involved in the development of ESRS. The company already has reasonable assurance on all its ESG disclosures and runs a project to meet the increased requirements of ESRS.
In the two-tier corporate structure under Dutch law, the Supervisory Board is a separate body that is independent of the Board of Management and the company. The Supervisory Board supervises the policies, management and general affairs of Philips, and assists the Board of Management and the Executive Committee with advice. Please also refer to Supervisory Board within the chapter Corporate governance.
Former Group CEO of Singapore Telecommunications Limited and currently member of the Board of Directors of Prudential plc, Bharti Airtel Limited, Bharti Telecom Limited and Ayala Corporation. Member of the Council of Presidential Advisors of Singapore, Deputy Chairman of the Public Service Commission of Singapore.
Former CFO, President, Chairman and CEO of PepsiCo. Currently member of the Board of Directors and Chair of the Audit Committee of Amazon, Inc. Member of the International Board of Advisors of Temasek, member of the Board of Trustees of the Memorial Sloan Kettering Hospital, trustee of the national gallery of art.
Former Chief Operating Officer at VMware and President at SAP. Currently CEO and President of Cohesity and member of the Board of Directors of Snyk.
Currently CEO of PostNL, member of the Supervisory Board of ING Groep N.V., member of the Supervisory Board of Het Concertgebouw N.V. and member of the Advisory Board of Goldschmeding Foundation.
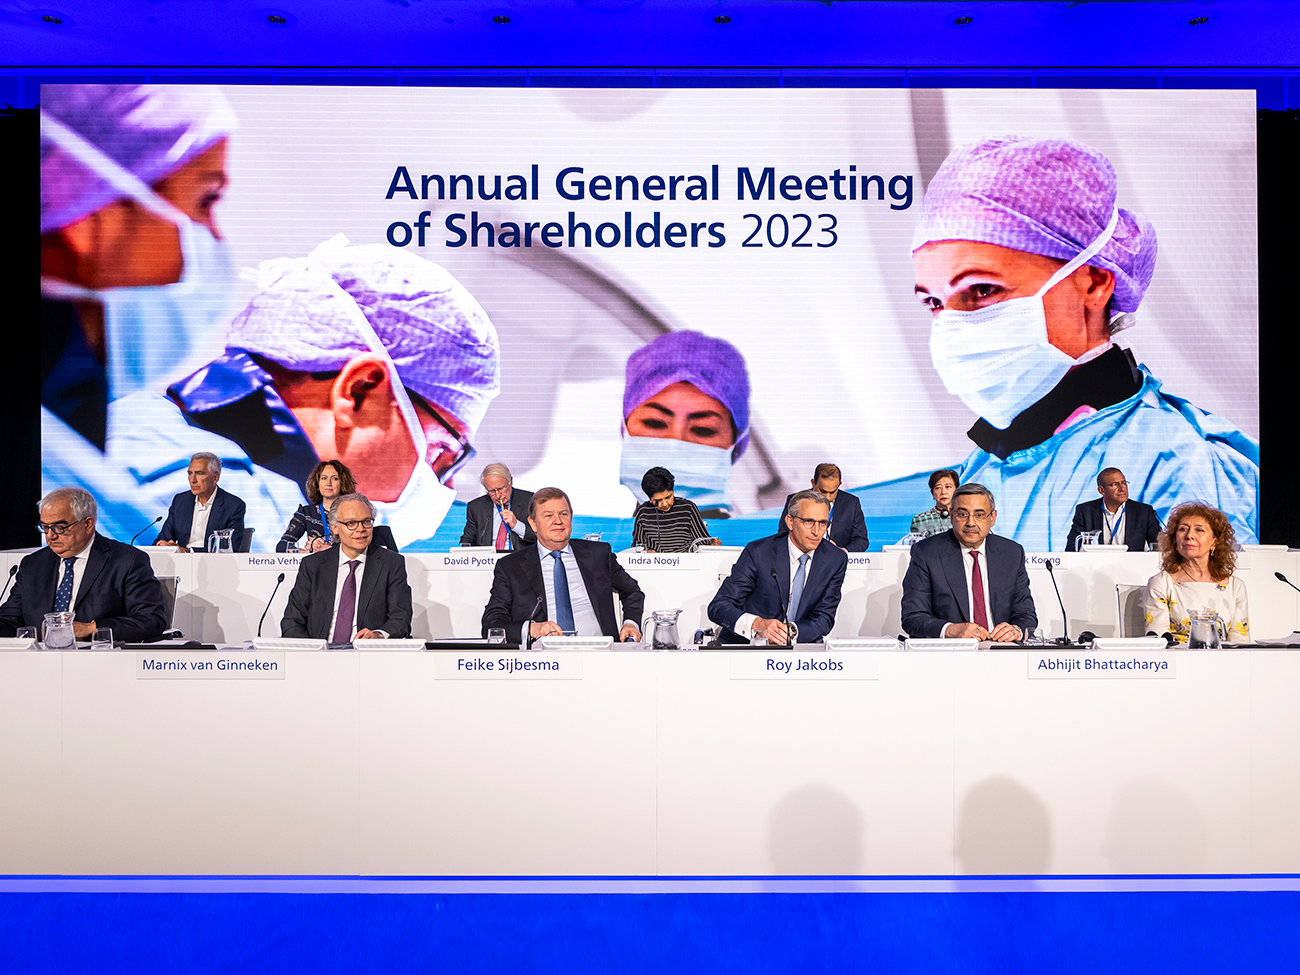
Strong focus on patient safety, quality, supply chain, business and financial performance, organization, succession planning and strategy
Exor stake in share capital a sign of confidence in Philips’ growth and value potential; provides for Exor to nominate one member to the Supervisory Board
Changes in Supervisory Board composition
Reports of Supervisory Board committees
2023 was a challenging as well as an encouraging year for Philips, as the company started to deliver on its three-year plan to create value with sustainable impact. Improved operational performance was driven by a strong focus on execution to enhance patient safety and quality, strengthen supply chain reliability, and establish a simplified operating model. The company succeeded in achieving its raised 2023 outlook with strong sales growth, improved profitability, and strong cash flow. All despite the uncertainties brought about by an increasingly volatile geopolitical environment. That said, order intake and the Respironics recall, including litigation and the investigation by the US Department of Justice (DOJ), remain key areas of attention.
The Supervisory Board remains fully committed to its responsibilities to supervise and advise management in leading the company towards a future of progressive value creation with sustainable impact. As we explain in our Report, we spent many sessions in 2023 engaging with the Board of Management and closely and actively reviewing key priority issues and actions to build further momentum and keep Philips on a value creation track for its stakeholders. The main topics discussed were patient safety and quality, supply chain strengthening, the workforce reduction, the new operating model and strategy for future business growth, as well as the composition of the Board of Management and Supervisory Board, the remuneration of the Board of Management, and the succession slate/bench across the organization.
Strengthening patient safety and quality across Philips is the highest priority, and resolving the consequences of the Respironics recall for our patients and customers is a key focus area. We feel encouraged by the progress made on the recall, as the company completes remediation of the sleep devices and strives to finalize remediation of the ventilator devices. Philips is fully committed to complying with the terms of the consent decree agreed with the DOJ, representing the US Food and Drug Administration (FDA), which primarily focuses on Philips Respironics in the US. The consent decree will provide Philips Respironics with a roadmap of defined actions, milestones, and deliverables to demonstrate compliance with regulatory requirements and to restore the business. In 2023, the Supervisory Board spent time on further anchoring patient safety and quality in the organization, and it remains actively involved in the further outstanding steps which are expected to follow in respect of litigation and the investigation by the DOJ. For more information, please refer to Quality & Regulatory and patient safety.
We also discussed developments around the supply chain frequently and in depth – both the external situation and the further improvements planned internally to improve business and financial performance. The progress made in this area has been a strong driver of the company's increased growth.
The Supervisory Board endorses the simplification of Philips’ organizational structure, where the Businesses are leading, supported by the Regions and global Functions, with more focused KPIs. The workforce reduction of approximately 8,000 roles to date, out of the planned reduction of 10,000 roles by 2025, was an impactful and difficult, yet necessary, measure as the company drives a major step-up in productivity, including focusing its R&D activities on fewer, yet more impactful projects. The impact of this reduction became visible in the P&L in 2023. Philips will strive to implement the remaining reductions with due respect for every employee affected and in line with all local rules and regulations.
We welcome the decision by Exor, the Netherlands-based diversified holding company, to become a long-term investor in Philips, supporting the company’s strategy. Their purchase of a 15% shareholding underlines their confidence in Philips’ growth and value potential, and their trust in the leadership, and provides for Exor to nominate one member to our Supervisory Board. We are pleased with the availability of Mr. Benoît Ribadeau-Dumas as Exor nominee, and we will propose his appointment at the upcoming 2024 General Meeting of Shareholders.
We appreciate the support expressed by the shareholders for the current management and direction of Philips. The Supervisory Board has every confidence in CEO Roy Jakobs and his leadership team, as they focus on implementing the plan to create value with sustainable impact for our shareholders and all other stakeholders.
Together with my fellow members of the Supervisory Board, I look forward to providing continued oversight of Philips as the company continues its value creation trajectory and delivers on its purpose of improving people’s health and well-being through meaningful innovation.
Feike Sijbesma
Chairman of the Supervisory Board
The Supervisory Board supervises, advises and challenges the Board of Management in performing their management tasks as well as setting and executing the strategy of the Philips Group. The members of the Supervisory Board act in the interests of Royal Philips, its businesses and all its stakeholders. This report includes a more specific description of the Supervisory Board’s activities during the financial year 2023 and other relevant information on its functioning.
Against the background set forth in the Chairman’s letter above, the Supervisory Board was regularly updated by management on the company’s performance and outlook. The Supervisory Board engaged in discussions with management on improving performance and increasing productivity and agility, by addressing the enhancement of patient safety and accelerating the focus on quality, strengthening the supply chain reliability and establishing a simplified operating model at Philips. Progress, as well as the near-term and longer-term actions on those three priorities were reviewed and monitored by the Supervisory Board.
In this context, the Supervisory Board and management also discussed the external environment in which the company operates, and the impact that the macro-economic outlook has on its performance.
In 2023, the Supervisory Board devoted considerable time to the Respironics recall, as a recurring agenda item for each of its (regular) meetings. The Supervisory Board was kept apprised of the progress made with the repair and replacement program, and in particular discussed and tracked the comprehensive test and research program for the affected CPAP, BiPAP and mechanical ventilator devices. Putting the interest of patients first, the Supervisory Board challenged management to remain focused on keeping patients regularly updated on the status of the repair or replacement of their devices and to accelerate the repair and replacement program where possible, despite operational and supply challenges.
The Supervisory Board was also regularly updated on other aspects of the recall. This includes, amongst other things, the negotiations and preliminary approval of the economic loss class settlement, the ongoing engagements with the FDA and other competent authorities globally, and the discussions with the DOJ, acting on behalf of the FDA, regarding a proposed consent decree. It also includes the criminal and civil investigation opened by the DOJ’s Consumer Protection Branch and Civil Fraud Section, and the US Attorney’s Office for the Eastern District of Pennsylvania to which Philips Respironics is subject and the ongoing class-action lawsuits and individual personal injury claims in which Philips Respironics and other entities are defendants. The Supervisory Board specifically engaged with management on the potential impact of the consent decree as well as the litigation and investigations on the Philips Respironics business, both in North America and the rest of the world, and reviewed its plans to keep on serving patients with affected devices until market re-entry.
Recognizing the importance of patient safety and quality of products and solutions sold by the Philips Group generally, significant time was spent in 2023 on reviewing and tracking progress of the company-wide program Accelerating Patient Safety and Quality to improve and foster a culture, behaviors and a mindset that puts quality and patient safety first. In the context of this program, the Supervisory Board also discussed the process framework for product design and production controls in the company.
As presented on January 30, 2023, the Supervisory Board and the Board of Management together with the Executive Committee interacted on the company’s overall strategy to extend its leadership as a health technology company and its plan to create value with sustainable impact towards 2025 and beyond, based on focused organic growth and scalable innovation with improved execution as the key value driver. This plan is designed to restore Philips' value creation based upon sales growth and improvement of profitability and cash generation by strong focus on execution. It includes, amongst other things, the strategic plans and priorities of each of the Segments and Regions and at Enterprise level. The Supervisory Board engaged in multiple deep dive sessions on the strategy. These interactions led to more detailed strategy plans that were reviewed and signed-off by the Supervisory Board. Each strategic plan is supplemented with milestones and an execution plan to achieve the company’s ambitions. Specific attention was given to the role of China in the strategy moving forward given the dynamics of the China market.
Our oversight over the company’s overall strategy also included the restructuring and other actions designed to improve the operations and performance, to invest in quality, to simplify ways of working, to remove organizational complexity by putting businesses with single accountability in the lead enabled by strong Regions and lean Functions, and to reduce operational expenses in close alignment with the respective works councils and unions and with respect for the impacted employees and their colleagues.
The overview below indicates other key matters that were reviewed and/or discussed during one or more meetings in the course of 2023:
The Supervisory Board conducted four dedicated dialogues on Philips' positioning in the market and versus its competitors. Subsequently, the Supervisory Board ’deep dived’ into the overall Philips strategy and the strategy and performance of:
The Supervisory Board reviewed Philips’ annual and interim financial statements, including information related to ESG, prior to publication.
In 2023, the members of the Supervisory Board convened for seven regular meetings and four extraordinary meetings. Moreover, the Supervisory Board members collectively and individually interacted with members of the Board of Management, with members of the Executive Committee and with senior management outside the formal Supervisory Board meetings. The Chairman of the Supervisory Board and the CEO frequently had bilateral discussions about the company’s progress on a variety of matters.
The Supervisory Board meetings were well attended in 2023. All Supervisory Board members were present during the Supervisory Board meetings in 2023. The committees of the Supervisory Board also convened regularly (see the separate reports of the committees below) and the committees reported back on their activities to the full Supervisory Board. In addition, the Supervisory Board and Committees held private meetings. The members of the Supervisory Board concluded that they devoted sufficient time to engage (proactively if the circumstances so required) in their supervisory responsibilities.
In March 2023, a Supervisory Board member visited the European Congress of Radiology in Vienna, Austria. In June 2023, the Supervisory Board members visited Philips’ Image Guided Therapy-Devices site in Plymouth, Minnesota, USA. In the course of 2023, various Supervisory Board members visited Philips’ Diagnosis & Treatment manufacturing site in Best, the Netherlands.
The Supervisory Board is a separate corporate body that is independent of the Board of Management and the company. Its independent character is also reflected in the requirement that members of the Supervisory Board can be neither a member of the Board of Management nor an employee of the company. The Supervisory Board considers all its members (i.e. 100%) to be independent under the Dutch Corporate Governance Code. Furthermore, the members of its Audit Committee are independent under the rules of the US Securities and Exchange Commission, applicable to the Audit Committee.
The Supervisory Board currently consists of 10 members. Effective as per (the end of) the 2023 Annual General Meeting of Shareholders, David Pyott was re-appointed for a term of two years and Liz Doherty was re-appointed for a term of four years. The agenda for the upcoming 2024 Annual General Meeting of Shareholders will include proposals to re-appoint Feike Sijbesma and Peter Löscher as members of the Supervisory Board. The agenda will also include the proposal to appoint Benoît Ribadeau-Dumas as new member of the Supervisory Board, who will be nominated pursuant to the commitment of Exor N.V. to be a long-term minority investor in Philips and its right to propose one member to the Supervisory Board. We are very pleased with the availability of Mr. Benoît Ribadeau-Dumas and welcome him as new member of our Board (subject to his appointment at the 2024 AGM).
The Supervisory Board attaches great value to diversity in its composition and has adopted a Diversity Policy for the Supervisory Board, Board of Management and Executive Committee. For more information on the Diversity Policy, please refer to Report of the Corporate Governance and Nomination & Selection Committee. The Supervisory Board spent time in 2023 considering its composition, as well as the composition of the Executive Committee (including the Board of Management), taking into account the criteria set forth in the Diversity Policy.
The composition of the Supervisory Board furthermore follows its profile (which was updated in early 2023), as included in the Rules of Procedure of the Supervisory Board. The profile aims for an appropriate combination of knowledge and experience among the members of the Supervisory Board, encompassing general management, international business, environmental, social and governance (ESG) and sustainability, (consumer) health and medical technology, quality and regulatory, finance and accounting, human resources, manufacturing and supply chain, information technology and digital, marketing, and governmental and public affairs, all in relation to the global character of Philips’ businesses. The Supervisory Board also aims for having members with different nationalities and (cultural) backgrounds, working experiences or otherwise diverse qualities, as well as one or more members with an executive or similar position in business or society no more than five years ago. The composition of the Supervisory Board shall furthermore be in accordance with the Dutch Corporate Governance Code best practice provisions on independence, and each member of the Supervisory Board shall be capable of assessing the broad outline of the overall policy of the company. The size of the Supervisory Board may vary as it considers appropriate to support its profile.
Any (re-)appointments of members of the Supervisory Board must meet the gender quota, in accordance with Dutch law, requiring that at least one-third of the supervisory board members are women and at least one-third are men. (For calculation purposes, a total number of board members that cannot be divided by three, must be rounded up to the next number that can be divided by three.) Currently, the statutory quota is met, as out of ten Supervisory Board members, four members are female and six members are male.
In 2023, each member of the Supervisory Board completed a questionnaire to verify compliance with the applicable corporate governance rules and the Rules of Procedure of the Supervisory Board. The outcome of this survey was satisfactory.
An independent external party facilitated the 2023 self-evaluation process for the Supervisory Board and its committees. This included drafting and submitting relevant questionnaires, interviewing members of the Supervisory Board and aggregating and reporting on the results. The members of the Board of Management also provided their input. The questionnaires covered various topics such as composition, size, skills and experience, geographical coverage and diversity of the Supervisory Board, dynamics and focus of the meetings of the Supervisory Board, the effectiveness of the Supervisory Board’s oversight of various aspects such as strategy, business performance, risk management, succession planning and people, and engagement with management. All members of the Supervisory Board were invited to share recommendations to improve the Supervisory Board’s functioning and ways of working going forward. Furthermore, the performance of the Chairman, the other Supervisory Board members individually, and of the Supervisory Board’s committees was evaluated separately.
The reports on the results of the evaluation were discussed in a meeting of the Supervisory Board. The results of the self-evaluation indicated that the Supervisory Board is a well-functioning team of appropriate size that benefits from different expertise, diversity, and international geographical representation. The meetings and meeting dynamics were rated positively with good interactions, discussions and feedback and a strong relationship with management, and suggestions were made to further improve meeting efficiency. Board members also noted the importance of being challenged constructively and of the need to maintain a collective understanding of priorities and options for any relevant matters. The composition of the Supervisory Board and its succession plan is considered adequate. Already anticipating the expiry of the third term of appointment of Mr. Pyott in 2025, the Supervisory Board is tasked with identifying a candidate with equivalent MedTech expertise. In addition, attracting candidates with expertise in artificial intelligence will be part of the Supervisory Board’s succession planning. Supervisory Board members further noted the potential benefit from getting external views from various stakeholders, such as Exor, regulators, suppliers, employees, patients, and investors, to enhance its oversight and decision-making. Finally, the Supervisory Board members confirmed a number of current focus areas, such as Patient Safety and Quality, senior executive succession planning, strategy execution and value creation. Early 2024, the Chairman of the Supervisory Board had several meetings with individual members of the Supervisory Board to discuss ways to further enhance the functioning of the Supervisory Board and its individual members going forward. The Chairman also discussed the evaluation of his own functioning with the Vice-Chairman.
Supervisory Board composition
| Feike Sijbesma | Paul Stoffels | Chua Sock Koong | Liz Doherty | Marc Harrison | Peter Löscher | Indra Nooyi | Sanjay Poonen | David Pyott | Herna Verhagen | |
| Year of birth | 1959 | 1962 | 1957 | 1957 | 1964 | 1957 | 1955 | 1969 | 1953 | 1966 |
| Gender | Male | Male | Female | Female | Male | Male | Female | Male | Male | Female |
| Nationality | Dutch | Belgian | Singaporean | British/Irish | American | Austrian | American | American | British/American | Dutch |
| Initial appointment date | 2020 | 2018 | 2021 | 2019 | 2018 | 2020 | 2021 | 2022 | 2015 | 2022 |
| Date of (last) (re-)appointment | n/a | 2022 | n/a | 2023 | 2022 | n/a | n/a | n/a | 2023 | n/a |
| End of current term | 2024 | 2026 | 2025 | 2027 | 2026 | 2024 | 2025 | 2026 | 2025 | 2026 |
| Independent | yes | yes | yes | yes | yes | yes | yes | yes | yes | yes |
| Committee memberships1) | RC & CGNSC | RC & CGNSC | AC | AC | QRC | AC & QRC | CGNSC | AC | RC & QRC | RC |
| Attendance at Supervisory Board meetings | (11/11) | (11/11) | (11/11) | (9/11) | (11/11) | (10/11) | (11/11) | (10/11) | (10/11) | (11/11) |
| Attendance at committee meetings | RC (8/8) CGNSC (6/6) | RC (8/8) CGNSC (6/6) | AC (6/6) | AC (6/6) | QRC (4/4) | AC (6/6) QRC (4/4) | CGNSC (6/6) | AC (6/6) | RC (7/8) QRC (4/4) | RC (8/8) |
| General management | yes | yes | yes | yes | yes | yes | yes | yes | yes | yes |
| International business | yes | yes | yes | yes | yes | yes | yes | yes | yes | yes |
| ESG & sustainability | yes | yes | yes | yes | ||||||
| (Consumer) health and medical technology | yes | yes | yes | yes | yes | yes | ||||
| Patient safety, quality & regulatory and product development | yes | yes | yes | yes | ||||||
| Finance and accounting | yes | yes | yes | yes | yes | yes | yes | yes | yes | yes |
| Human Resources | yes | yes | yes | yes | yes | yes | yes | yes | yes | |
| Manufacturing and supply chain | yes | yes | yes | yes | yes | |||||
| Information technology and digital | yes | yes | yes | yes | yes | yes | yes | yes | yes | |
| Marketing | yes | yes | yes | yes | yes | yes | yes | |||
| Governmental and public affairs | yes | yes | yes | yes | yes | yes | yes | yes |
While retaining overall responsibility, the Supervisory Board has assigned certain of its tasks to the three long-standing committees, also referred to in the Dutch Corporate Governance Code: the Corporate Governance and Nomination & Selection Committee, the Remuneration Committee and the Audit Committee. In 2015, the Supervisory Board also established the Quality & Regulatory Committee. The separate reports of these committees are part of this Supervisory Board report and are published below.
The function of all of the Supervisory Board’s committees is to prepare the decision-making of the full Supervisory Board, and the committees currently have no independent or assigned powers. The full Supervisory Board retains overall responsibility for the activities of its committees.
The financial statements of the company for 2023, as presented by the Board of Management, have been audited by Ernst & Young Accountants LLP, the independent external auditor appointed by the General Meeting of Shareholders. We have approved these financial statements, and all individual members of the Supervisory Board have signed these documents (as did the members of the Board of Management).
Finally, we would like to express our thanks to the members of the Board of Management, the Executive Committee and all other employees for their continued contribution throughout 2023.
The Supervisory Board
Feike Sijbesma
Paul Stoffels
Chua Sock Koong
Liz Doherty
Marc Harrison
Peter Löscher
Indra Nooyi
Sanjay Poonen
David Pyott
Herna Verhagen
The Corporate Governance and Nomination & Selection Committee is chaired by Feike Sijbesma. Its other members are Paul Stoffels and Indra Nooyi. The Committee is responsible for the review of the overall corporate governance, the selection criteria and appointment procedures for the Board of Management, the Executive Committee, certain other key management positions, as well as the Supervisory Board.
In 2023, the Corporate Governance and Nomination & Selection Committee held six meetings and all Committee members attended these meetings.
The Committee devoted time to the appointment or reappointment of candidates to fill current and future vacancies on the Supervisory Board. Following those consultations, it prepared decisions and advised the Supervisory Board, which resulted in the re-appointments of David Pyott and Liz Doherty as members of the Supervisory Board at the 2023 Annual General Meeting of Shareholders. This also resulted in the proposals to re-appoint Feike Sijbesma and Peter Löscher as members of the Supervisory Board, and to appoint Exor nominee Benoît Ribadeau-Dumas as new member of the Supervisory Board at the upcoming 2024 Annual General Meeting of Shareholders.
Under its responsibility for the selection criteria and appointment procedures for Philips’ senior management, the Committee reviewed the functioning of the Board of Management and its individual members, the Executive Committee succession plans and emergency candidates for key roles in the company. The review and evaluation consists of periodical performance review meetings with the individual members of the Board of Management and the Executive Committee, and evaluation of the results of these meetings by the Committee. The main findings and conclusions from these reviews were also shared with the Supervisory Board and the Remuneration Committee, and were taken into account in the performance evaluation of the Board of Management and Executive Committee members and the selection of succession candidates. Reference is made to 2023 Annual Incentive, setting out the performance review of the Board of Management members by the Remuneration Committee.
The Committee devoted time in 2023 to the selection and/or appointment of candidates to fill other current and future vacancies on the Board of Management and the Executive Committee. This resulted in the re-appointment, at the 2023 Annual General Meeting of Shareholders, of Abhijit Bhattacharya for a two-year’s term to his tenure as CFO that started in 2015, thereby ensuring continuity and enabling a smooth succession process in parallel. The Committee’s work furthermore resulted in appointments of four new members of the Executive Committee: Steve C. de Baca and Jeff DiLullo were appointed, effective February 6, 2023, as Chief Patient Safety & Quality Officer and Chief Market Leader of Philips North America, respectively. Furthermore, Julia Strandberg was appointed as the Chief Business Leader of the Connected Care segment, effective April 24, 2023, and Heidi Sichien was appointed as Chief People Officer, effective August 1, 2023. Philips expects to announce a new leader for its Precision Diagnosis business in 2024, which business is currently under the temporarily extended leadership of Bert van Meurs (Chief Business Leader for the Image Guided Therapy business).
With respect to corporate governance matters, the Committee discussed developments around the revised Dutch Corporate Governance Code, relevant legislation under consideration in the Netherlands and the regulatory regimes around disclosure requirements related to ESG. Finally, the Committee reviewed the Charter of the Corporate Governance and Nomination and Selection Committee and concluded it remains appropriate.
With respect to the productivity initiatives and other actions to improve the company’s performance (including the unfortunate but necessary reduction of roles), the Committee was updated by management on the impact on employees and the phased deployment approach and reviewed the simplification of the organization.
The Diversity Policy for the Supervisory Board, Board of Management and Executive Committee was adopted in 2017 and revised in early 2023, and is published on the company website. The Committee periodically assesses the Diversity Policy and the size and composition of the Supervisory Board and makes recommendations, if relevant, relating to the profile for the Supervisory Board.
The criteria in the Diversity Policy aim to ensure that the Supervisory Board, the Board of Management and the Executive Committee have a sufficient diversity of views and the expertise needed for a good understanding of current affairs and longer-term risks and opportunities related to the company’s business. The nature and complexity of the company’s business is taken into account when assessing optimal diversity, as well as the social and environmental context in which the company operates.
Pursuant to the Diversity Policy, the selection of candidates for appointment to the Supervisory Board, Board of Management and Executive Committee is based on merit. With due regard to the criteria set forth in the Diversity Policy, the company shall seek to fill vacancies by considering candidates that represent a diversity of (among others) ages, gender, identities and educational and professional backgrounds. Please refer to the Supervisory Board report for more information on the diversity of the Supervisory Board.
The Diversity Policy includes the Supervisory Board’s aim that the Board of Management and the Executive Committee comprise members with different nationalities and (cultural) backgrounds, working experiences or otherwise diverse qualities. Effective 2022, Dutch law requires listed companies to set appropriate and ambitious gender diversity targets for the Board of Management and for a management level of a seniority to be determined by the company. To this end, the Diversity Policy includes the Supervisory Board’s aim that at least one-third of the members of each of the Board of Management and the Executive Committee are women and at least one-third are men. For more information, please refer to Diversity, Inclusion and Well-Being.
On behalf of the Remuneration Committee, I am pleased to report on the Committee’s activities in 2023 and to present the 2023 Remuneration Report, providing a comprehensive overview of the remuneration paid and owed to the individual members of the Board of Management and the Supervisory Board, respectively, in the financial year 2023.
2023 was a challenging as well as an encouraging year for Philips, as the company started to deliver on its three-year plan to create value with sustainable impact. Improved operational performance was driven by a strong focus on execution to enhance patient safety and quality, strengthen supply chain reliability, and establish a simplified operating model. The company succeeded in achieving its raised 2023 outlook with strong sales growth, improved profitability, and strong cash flow. All despite the uncertainties brought about by an increasingly volatile geopolitical environment. That said, order intake and the Respironics recall, including litigation and the investigation by the US Department of Justice, remain key areas of attention. Please refer to Financial performance and Environmental, Social and Governance of our 2023 Annual Report for a detailed review of the company’s financial performance and its ESG performance in the year 2023.
For the awards granted under our Long-Term Incentive Plan in 2021, the company performance resulted in a realization significantly above target for the sustainability objectives. For the relative TSR and adjusted EPS metrics in our Long-Term Incentive Plan, however, there was a below-threshold realization based on the performance since the start of the performance period in 2021. In respect of the financial metrics 2023 Annual Incentive, performance was also significantly above target. Nevertheless, to acknowledge the decrease in order intake in 2023, the Supervisory Board decided (upon the proposal of the Remuneration Committee) to lower the Annual Incentive payout. Please refer to our 2023 Remuneration Report for more details.
Considering the fact that 2022 had been a disappointing year for Philips, the Supervisory Board followed the proposal of the Remuneration Committee to not apply any base salary increases for the members of the Board of Management during the 2023 compensation review in April 2023.
During the Annual General Meeting of Shareholders held in May 2023, our Chief Financial Officer Abhijit Bhattacharya was re-appointed, adding a two-year’s term to his tenure as CFO that started in 2015, thereby ensuring continuity and enabling a smooth succession process in parallel. The company and Mr Bhattacharya entered into a new service agreement that was prepared by the Remuneration Committee and published on the company’s website.
Starting in May 2023, the Remuneration Committee carried out a review of the Remuneration Policy and the Long-Term Incentive Plan for the Board of Management, and the Remuneration Policy for the Supervisory Board. Dutch law requires the renewal of our policies at least every four years, and we also considered this a good opportunity to test the alignment of our policies with our company’s strategy, to review how they compare to market practice and to ensure our compliance with updated regulatory and corporate governance requirements. Building on our stakeholder engagements during the past years, we engaged with stakeholders through a dedicated remuneration roadshow and other interactions to solicit their feedback on, and support for the proposals. This process resulted in the proposals to adopt an amended Remuneration Policy for the Board of Management and an amended Remuneration Policy for the Supervisory Board, respectively, that will be submitted for adoption at the upcoming Annual General Meeting of Shareholders to be held on May 7, 2024. Upon convocation of the 2024 AGM (in March 2024), the proposals will be published on our website and the main changes following from these proposals, compared to each of the current 2020 Remuneration Policies, as well as other relevant information will be explained in the explanatory notes to the relevant agenda items. Please note that, subject to their adoption, the 2024 Remuneration Policies will have retrospective effect for the full year 2024, and for that reason our 2023 Remuneration Report includes certain ex-ante disclosures in respect of the performance metrics for the 2024 Annual Incentive and 2024 Long-Term Incentive.
The Remuneration Committee is chaired by Paul Stoffels. Its other members are David Pyott, Herna Verhagen and Feike Sijbesma. The Committee is responsible for preparing decisions of the Supervisory Board on the remuneration of individual members of the Board of Management and the Executive Committee, as well as the policies governing this remuneration. In performing its duties and responsibilities, the Remuneration Committee is assisted by an external consultant and an in-house remuneration expert. For a full overview of the responsibilities of the Committee, please refer to the Charter of the Remuneration Committee, as set forth in Chapter 3 of the Rules of Procedure of the Supervisory Board (which are published on the company’s website). Our annual Remuneration Committee cycle enables us to have an effective decision-making process supporting the determination, review and implementation of the Remuneration Policy. The Committee met eight times in 2023. All Committee members were present during these meetings.
I look forward to presenting our 2023 Remuneration report and our proposals for the renewed 2024 Remuneration Policies at our upcoming Annual General Meeting of Shareholders.
On behalf of the Remuneration Committee,
Paul Stoffels
Chairman of the Remuneration Committee
In this Remuneration Report, the Supervisory Board provides a comprehensive overview, in accordance with article 2:135b of the Dutch Civil Code, of the remuneration paid and owed to the individual members of the Board of Management and the Supervisory Board, respectively, in the financial year 2023. The report will also be published as a stand-alone document on the company’s website after the 2024 Annual General Meeting of Shareholders, the agenda of which will include an advisory vote on this Remuneration Report.
The Remuneration Policy and Long-Term Incentive Plan for the Board of Management have been adopted and approved, respectively, by the Annual General Meeting of Shareholders 2020, which took place on April 30, 2020.
The objectives of the Remuneration Policy for the Board of Management are: to focus them on delivering on our purpose and strategy, to motivate and retain them, and to create stakeholder value.
Thus, the Remuneration Policy:
Compensation element | Purpose and link to strategy | Operation | Policy Level |
|---|---|---|---|
Total Direct Compensation | To support the Remuneration Policy’s objectives, the Total Direct Compensation includes a significant variable part in the form of an Annual Incentive (cash bonus) and Long-Term Incentive in the form of performance shares. As a result, a significant proportion of pay is ‘at risk’. | The Supervisory Board ensures that a competitive remuneration package for Board-level executive talent is maintained and benchmarked. The positioning of Total Direct Compensation is reviewed against benchmark data on an annual basis and is recalibrated if and when required. To establish this benchmark, data research is carried out each year on the compensation levels in the Quantum Peer Group. | Total direct remuneration is aimed at or close to, the median of the Quantum Peer Group. |
Annual Base Compensation | Fixed cash payments intended to attract and retain executives of the highest caliber and to reflect their experience and scope of responsibilities. | Annual Base Compensation levels and any adjustments made by the Supervisory Board are based on factors including the median of Quantum Peer Group data and performance and experience of the individual member. The annual review date for the base salary is typically before April 1. | The individual salary levels are shown in this Remuneration Report. |
Annual Incentive | Variable cash bonus incentive of which achievement is tied to specific financial and non-financial targets derived from the company’s annual strategic plan. These targets are set at challenging levels and are partly linked to the results of the company (80% weighting) and partly to the contribution of the individual member (20% weighting). | The payout in any year relates to the achievements of the preceding year. Metrics are disclosed ex-ante in the Remuneration Report and there will be no retroactive changes to the selection of metrics used in any given year once approved by the Supervisory Board and disclosed. | President & CEO Other BoM members |
Long-Term Incentive | Our Long-Term Incentives form a substantial part of total remuneration, with payouts contingent on achievement of challenging EPS targets, relative TSR performance against a high-performing peer group and sustainability objectives that are directly aligned with our purpose to make the world healthier and more sustainable through innovation. | The annual award size is set by reference to a multiple of base salary. The actual number of performance shares to be awarded is determined by reference to the average of the closing price of the Royal Philips share on the day of publication of the first quarterly results and the four subsequent trading days. Dependent upon the achievement of the performance conditions, cliff-vesting applies three years after the date of grant. During the vesting period, the value of dividends will be added to the performance shares in the form of shares. These dividend-equivalent shares will only be delivered to the extent that the award actually vests. | President & CEO Other BoM members |
Mandatory share ownership and holding requirement | To further align the interests of executives to those of stakeholders and to motivate the achievement of sustained performance. | The guideline for members of the Board of Management is to hold at least a minimum shareholding in the company. Until this level has been reached the members of the Board of Management are required to retain all after-tax shares derived from any Long-Term Incentive Plan. All Board of Management members have reached the required share ownership level. The shares granted under the Long-Term Incentive Plan shall be retained for a period of at least 5 years or until at least the end of their contract period if this period is shorter. | The minimum shareholding requirement is 400% of annual base compensation for the CEO and 300% for other members of the Board of Management. |
Pension | Pension plan and pension contribution intended to result into an appropriate level at retirement. |
| |
Additional arrangements | To aid retention and remain competitive within the marketplace | Additional arrangements include expense and relocation allowances, medical insurance, accident insurance and company car arrangements, which are in line with other Philips executives in the Netherlands. The members of the Board of Management also benefit from coverage under the company’s Directors & Officers (D&O) liability insurance. The company does not grant personal loans to members of the Board of Management. |
We use a Quantum Peer Group for remuneration benchmarking purposes, and therefore we aim to ensure that it includes business competitors, with an emphasis on companies in the healthcare, technology-related or consumer products area, and other companies we compete with for executive talent. The Quantum Peer Group consists of predominantly Dutch and other European companies, plus a minority (up to 25%) of US-based global companies, of comparable size, complexity and international scope.
Philips Group
Quantum Peer Group
2023
| European companies | Dutch companies | US companies | |
|---|---|---|---|
| Alcon | Reckitt Benckiser | Ahold Delhaize | Baxter |
| BAE Systems | Roche | AkzoNobel | Becton Dickinson |
| Capgemini | Rolls-Royce | ASML | Boston Scientific |
| Ericsson | Safran | Heineken | Danaher |
| Fresenius Medical Care | Siemens Healthineers | Medtronic | |
| GlaxoSmithKline | Smith & Nephew | Stryker | |
| Nokia | Thales | ||
In addition, we use a TSR Performance Peer Group to benchmark our relative Total Shareholder Return performance for LTI purposes and against our business peers in the health technology market and other markets in which we compete. The companies we have selected for this peer group include predominantly US-based healthcare companies. Given that a substantial number of relevant competitors are US-headquartered, the weighting of US-based healthcare companies is more notable than for the Quantum Peer Group.
Philips Group
TSR Performance Peer Group
2023
| US companies | European companies | Japanese companies |
|---|---|---|
| Baxter | Alcon | Canon |
| Becton Dickinson | Elekta | Terumo |
| Boston Scientific | Fresenius Medical Care | |
| Danaher | Getinge | |
| GE Healthcare | Reckitt Benckiser | |
| Hologic | Siemens Healthineers | |
| Johnson & Johnson | Smith & Nephew | |
| Medtronic | ||
| Resmed | ||
| Stryker |
The Remuneration Policy and the LTI Plan allow changes to the peer groups to be made by the Supervisory Board without further approval from the General Meeting of Shareholders in respect of up to three companies on an annual basis (for instance: following a delisting of a company or, a merger of two peer companies), or six companies in total during the four years following adoption and approval of the Remuneration Policy and the LTI Plan respectively (or, if earlier, until the adoption or approval of a revised Remuneration Policy or revised LTI Plan).
The members of the Board of Management are engaged by means of a services agreement (overeenkomst van opdracht). Termination of the contract by either party is subject to six months’ notice period. The severance payment is set at a maximum of one year’s annual base compensation. No severance payment is due if the agreement is terminated early on behalf of the Board of Management member or in the case of urgent cause (dringende reden) as defined in article 7:678 and further of the Dutch Civil Code. The term of the services agreement is aligned with the term for which the relevant member has been appointed by the General Meeting of Shareholders (which is a maximum period of four years, it being understood that this period expires no later than at the end of the Annual General Meeting of Shareholders (AGM) held in the fourth year after the year of appointment).
Philips Group
Contract terms for current members
2023
| end of term | |
|---|---|
| Roy Jakobs | AGM 2026 |
| Abhijit Bhattacharya | AGM 2025 |
| Marnix van Ginneken | AGM 2025 |
The Supervisory Board has determined the 2023 pay-outs and awards to the members of the Board of Management, upon the proposal of the Remuneration Committee, in accordance with the 2020 Remuneration Policy and the 2020 LTI Plan. In addition, the Supervisory Board has determined the 2023 vesting of the 2021 LTI grant, of which the performance period ended on December 31, 2023. This was done in accordance with the LTI Plan as approved during the 2020 Annual General Meeting of Shareholders.
The Remuneration Committee annually conducts a scenario analysis. This includes the calculation of remuneration under different scenarios, whereby different Philips performance assumptions and corporate actions are examined. The Supervisory Board concluded that the relationship between the strategic objectives and the chosen performance criteria for the 2023 Annual Incentive, as well as for the 2021 LTI, were adequate.
The annual base compensation of the members of the Board of Management has been reviewed as part of the regular remuneration review. No increase was applied to acknowledge the disappointing company performance in 2022 and to reflect the limited budget available for the annual compensation review for the wider population. As a result, the annual base compensation of Roy Jakobs, Abhijit Bhattacharya and Marnix van Ginneken remained unchanged in 2023.
The Annual Incentive performance has been assessed based on company financial results as well as individual results. Details are as follows:
In line with the Remuneration Policy, the company sets financial targets in advance of the year for all members of the Board of Management. For the year 2023, the financial targets set at Group level cover Comparable Sales Growth*), Adjusted EBITA*) and Free Cash Flow*). The realized performance for all three metrics was above target. Realized performance levels presented in the table below include the financial impact connected with the Respironics consent decree, and excluding this impact the Comparable Sales Growth*) and Adjusted EBITA*) would have been 7.0% and 10.5% respectively. Reviewing these performance levels, the Supervisory Board decided to apply two downward adjustments. First, to acknowledge the decrease in comparable order intake reported over 2023, the Supervisory Board lowered the payout on the Comparable Sales Growth metric from 200% to 175% of target . Second, to account for the upward effect on Adjusted EBITA resulting from not excluding the financial impact connected with the proposed Respironics consent decree, the Supervisory Board also lowered the payout from 180% to 175% of target for this metric (corresponding to an Adjusted EBITA performance of 10.5% which excludes the financial impact referred to).**)
| Financial performance metric | Weighting as % of target Annual Incentive | Assessment of performance | Weighted pay-out as % of target Annual Incentive | ||||
|---|---|---|---|---|---|---|---|
| threshold performance | target performance | maximum performance | realized performance | resulting payout as % of target | |||
| Comparable Sales Growth1) | 30% | 0.0% | 1.5% | 3.5% | 6.0% | 175.0% | 52.5% |
| Adjusted EBITA margin1) | 30% | 7.5% | 9.0% | 11.0% | 10.6% | 175.0% | 52.5% |
| Free Cash Flow1) | 20% | 571 | 871 | 1,171 | 1,582 | 200.0% | 40.0% |
| Total | 80% | 145.0% | |||||
The individual performance criteria and assessment targets set at the beginning of the year have been disclosed in the following table. To determine the payout levels for the individual goals, the Supervisory Board typically applies a holistic assessment as to the performance against the set goals as well as the relative weighting of the goal categories. These relative weightings are not in all cases equal, but such that any goal category remains relevant and aligned with the strategic priorities for the year.
| Board of Management Member | Individual Performance criteria | Assessment of performance | Weighted pay-out as% of target Annual Incentive |
|---|---|---|---|
| Roy Jakobs | Strategy execution |
| 22.0% |
Quality & operational excellence |
| ||
People & organization |
| ||
Customer results |
| ||
ESG/Sustainability |
| ||
| Abhijit Bhattacharya | Strategy execution |
| 21.0% |
| Quality & operational excellence |
| ||
| People & organization |
| ||
| Customer results |
| ||
| ESG/Sustainability |
| ||
| Marnix van Ginneken | Strategy execution |
| 23.0% |
| Quality & operational excellence |
| ||
| People & organization |
| ||
| Customer results |
| ||
| ESG/Sustainability |
|
Overall, this leads to the following total Annual Incentive realization:
Annual Incentive realization 2023
in EUR unless otherwise stated
| Annual incentive opportunity | Realized annual incentive | |||||
|---|---|---|---|---|---|---|
| Target as a % of base compensation | Target Annual Incentive | Financial performance (weighted pay-out %) | Individual performance (weighted pay-out %) | Payout as % of target Annual Incentive1) | Realized annual incentive | |
| Roy Jakobs | 100% | 1,200,000 | 145.0% | 22.0% | 167.0% | 2,004,480 |
| Abhijit Bhattacharya | 80% | 648,000 | 145.0% | 21.0% | 166.0% | 1,075,939 |
| Marnix van Ginneken | 80% | 504,000 | 145.0% | 23.0% | 168.0% | 846,922 |
This section presents incentive performance metrics under the proposed 2024 Remuneration Policy for the Board of Management. In the event that the proposed 2024 Remuneration Policy would not be adopted by the 2024 AGM, the current 2020 Remuneration Policy would continue to apply.
In the proposed 2024 Remuneration Policy, the weighting of the non-financial element has increased to 30% (from 20%) and, correspondingly, the weighting of the financial element has decreased to 70% (from 80%). This change reflects the increased relative importance of factors relating to strategic priorities (such as patient safety and quality, supply chain reliability, and a simplified operating model), as well as our Environmental, Social and Governance (ESG) performance.
For the year 2024, the following financial performance metrics are selected to ensure alignment with the key (strategic) priorities in the year:
At the start of each year, two to four performance categories are selected from the following list, whereby each selected category receives an equal weighting:
For each selected category, one or more performance objectives are determined at the start of the year for each of the members of the Board of Management.
For the year 2024, the following categories and objectives are selected to ensure alignment with the key (strategic) priorities in the year:
| Performance category | Performance objective | Applicable for | Weighting | Measurement description |
|---|---|---|---|---|
Patient Safety & Quality | Drive Patient Safety & Quality as highest priority in the organization | All members of Board of Management | 7.5% | This objective measures delivery on our company-wide program to strengthen our Patient Safety & Quality culture, capabilities and performance. Additionally, we measure the progress on the Respironics recall and delivery of the proposed consent decree commitments. |
Customer | Improve customer experience | Roy Jakobs; Abhijit Bhattacharya | 7.5% | This objective is measured by the improvement of the customer NPS. |
| Improve supply chain reliability | Roy Jakobs | This objective is measured by the on-time delivery of orders as per customer expectations. | ||
Improve financial forecasting | Abhijit Bhattacharya | Deliver Reliable Forecast as per plan. | ||
Manage legal issues | Marnix van Ginneken | Develop and manage litigation strategy and potential liabilities. | ||
Strategy and Execution | Drive focused strategy to win in the market | Roy Jakobs | 7.5% | This objective measures delivery on our value creation plan and market share gain. |
| Abhijit Bhattacharya | This objective measures delivery on our value creation plan and delivery on cash program and productivity targets. | |||
| Marnix van Ginneken | This objective measures delivery on our value creation plan and delivery on legal & compliance commitments as per plan. | |||
Establish simplified, more agile operating model | All members of Board of Management | This objective measures delivery on the operating model simplification and our headcount reduction plan. | ||
| ESG | Deliver on ESG Commitments | All members of Board of Management | 7.5% | This objective measures: - Performance on our ESG index (which includes various elements such as emission- and diversity targets) - Our employee engagement score - Talent and succession development of senior roles in the organization |
The 3-year performance period of the 2021 LTI grant, consisting of performance shares, ended on December 31, 2023. The realization of this grant is based on TSR achievement, adjusted EPS growth and sustainability objectives. The following performance achievement and vesting levels have been determined by the Supervisory Board in respect of the 2021 grant of performance shares:
Philips Group
Performance achievement and vesting levels
| achievement | weighting | vesting level | |
|---|---|---|---|
| TSR | 0.0% | 50.0% | 0.0% |
| EPS | 0.0% | 40.0% | 0.0% |
| Sustainability objectives | 175.0% | 10.0% | 17.5% |
| Total | 17.5% |
A ranking approach to TSR applies with Philips itself included in the TSR Performance Peer Group. TSR scores are calculated based on a local currency approach and by taking a 3-month averaging period prior to the start and end of the 3-year performance period. The performance incentive pay-out zone is outlined in the following table, which results in zero vesting for performance below the 40th percentile and 200% vesting for performance levels above the 75th percentile. The incentive zone range has been constructed such that the average pay-out over time is expected to be approximately 100%.
Philips Group
Performance-incentive zone for TSR
in %
| Position | 20-14 | 13 | 12 | 11 | 10 | 9 | 8 | 7 | 6 | 5-1 |
|---|---|---|---|---|---|---|---|---|---|---|
| Vesting % | 0 | 60 | 80 | 90 | 100 | 120 | 140 | 160 | 180 | 200 |
The TSR achieved by Philips during the performance period was -51.10%, using a start date of October 2020 and end date of December 2023. This resulted in Philips being positioned at rank 20 in the TSR performance peer group shown in the following table, resulting in a TSR achievement of 0%.
Following Oracle’s acquisition of Cerner (completed June 2022), the Supervisory Board adopted the approach of recognizing Cerner’s performance through the delisting date. As a proxy for future performance, reinvestment in an index of the remaining 19 peer companies was assumed (effectively retaining a peer group of 20 companies).
TSR results LTI Plan 2021 grant: (51.10%)
| total return | rank number | |
|---|---|---|
| Canon | 119.99% | 1 |
| General Electric | 109.08% | 2 |
| Boston Scientific | 48.10% | 3 |
| Siemens Healthineers | 35.00% | 4 |
| Stryker | 28.06% | 5 |
| Getinge | 18.79% | 6 |
| Alcon | 16.73% | 7 |
| Johnson & Johnson | 12.57% | 8 |
| Cerner | 11.12% | 9 |
| Becton Dickinson | 10.29% | 10 |
| Terumo | 8.71% | 11 |
| Danaher | 7.33% | 12 |
| Hologic | (1.37)% | 13 |
| Reckitt Benckiser | (11.46)% | 14 |
| Elekta | (20.67)% | 15 |
| ResMed | (21.05)% | 16 |
| Medtronic | (24.84)% | 17 |
| Smith & Nephew | (27.58)% | 18 |
| Fresenius Medical | (45.30)% | 19 |
| Philips | (51.10)% | 20 |
The LTI Plan EPS payouts and targets set at the beginning of the performance period were as follows:
Philips Group
LTI Plan EPS payouts
| Below threshold | Threshold | Target | Maximum | Actual | |
|---|---|---|---|---|---|
| LTI plan EPS (euro) | <1.38 | 1.38 | 1.54 | 1.72 | 0.26 |
| Vesting % | 0% | 40% | 100% | 200% | 0% |
In respect of the 2021 LTI grant, the LTI plan EPS is calculated based on a reported net income attributable to shareholders divided by the number of common shares outstanding (after deduction of treasury shares) on the day prior to the beginning of the performance period (to eliminate the impact of any share buyback, stock dividend, etc.), resulting in an EPS of EUR (0.50). Furthermore, as per the 2020 LTI Plan, the LTI Plan EPS includes adjustments to account for events that were not planned when targets were set or were outside management’s control such as the profit and loss impact of acquisitions and divestments (balance is neutral), the profit and loss impact of unhedged foreign exchange variations versus plan (positive adjustment) and the profit and loss impact of legacy legal proceedings (positive impact). Overall, this resulted in an LTI Plan EPS of EUR 0.26 based on adjusted net income from continuing operations, leading to a realization of 0% of target.
Philips Group
LTI Plan EPS realization
in millions of EUR unless otherwise stated
Net income | EPS (euro) | |
|---|---|---|
Income from continuing operations attributable to shareholders | (456) | (0.50) |
Profit and loss impact of: | ||
- Acquisitions and divestitures 1) | 1 | 0.00 |
- Foreign exchange variations versus plan 2) | 60 | 0.07 |
- Legacy legal proceedings 3) | 628 | 0.69 |
Adjusted net income from continuing operations | 234 | 0.26 |
In order to further align the remuneration package for the Board of Management with our purpose and our ESG commitment, a sustainability criterion was introduced in the 2020 LTI Plan. Philips believes that ESG performance will improve the company’s performance as a whole and, therefore, that it should be explicitly linked to (long-term) remuneration. The criteria are based on three Sustainable Development Goals (SDGs) as defined by the United Nations that are included in Philips’ strategy on sustainability (no. 3, 12 and 13). These three SDGs are translated in five underlying objectives, which are measured against a specific target range.
At the beginning of the performance period, challenging target ranges are set for each of the five objectives. Based on a point-to-point method, performance achievement is measured at the end of the performance period (i.e., 3 years) versus the beginning of the performance period. The vesting level is determined based on the following scheme:
| No. of measures achieved on or above target | Vesting % |
|---|---|
| 1 | 0% |
| 2 | 0% |
| 3 | 50%-100% |
| 4 | 100%-150% |
| 5 | 150%-200% |
The realized performance is described in the following table. As five out of five objectives are achieved within or better than target range, the vesting % lies between 150% and 200% of target. Based on the overall performance of the five objectives, the Supervisory Board has assessed that a vesting level of 175% would reflect an appropriate positioning within the target range.
For more information on the realized performance on all five objectives please refer to our Environmental, Social and Governance and Independent auditor's assurance report on the ESG information and the EU Taxonomy information.
| Sustainability category | Underlying objective | Target range | realized performance | |
|---|---|---|---|---|
| Ensure healthy lives and promote well-being for all at all ages (SDG3) Lives Improved | Targeted # of Lives Improved in year 31) | 1,517 – 1,695 million | 1,880 million | Better than target range |
| Ensure sustainable consumption and production patterns (SDG12) Circularity | Targeted circular revenue in year 32) | 15.0% – 20.1% | 20.0% | Within target range |
| Targeted waste to landfill in year 33) | 3.5% – 0.1% | 0.0% | Better than target range | |
| Targeted closing the loop in year 34) | 20.0% – 28.5% | 20.5% | Within target range | |
| Take urgent action to combat climate change and its impacts (SDG13) Carbon footprint | Targeted CO2 equivalent (in Kilo Tonnes) in year 3 | 640 – 574 Ktonnes CO2 | 418 Ktonnes CO2 | Better than target range |
This section presents incentive performance metrics under the proposed 2024 Remuneration Policy for the Board of Management. In the event that the proposed 2024 Remuneration Policy will not be adopted by the 2024 AGM, the current 2020 Remuneration Policy will continue to apply.
The 2024 Long-Term Incentive grant remains to consist of 100% performance shares of which vesting is subject to performance over a period of 3 years. We have broadened the sustainability perspective to the full Environmental, Social and Governance ('ESG') spectrum, and subsequently increased the weighting of the ESG performance metric from 10% to 20%. By doing so, we aim to reflect the importance of ESG to our company and its increasing relevance to our stakeholders (as a strategic matter and in the context of our risk management), and to incentivize management’s focus on our policy objective to deliver superior, long-term value to our stakeholders, while acting responsibly towards our planet and society. As a result of this, the weighting of the relative TSR metric has been slightly reduced to 40% (from 50%) to keep a balanced weighting among the three LTI performance metrics. Lastly, the weighting of the adjusted EPS growth metric remains unchanged, resulting in the following performance metrics and weighting:
At the start of each performance year, we select four ESG objectives in line with our long-term strategic priorities. There is no exhaustive list of objectives that can be selected. To ensure that all objectives are material, auditable and measurable, we only select objectives which are reported in our Annual Report (in preparation for the Corporate Sustainability Reporting Directive) and therefore are subject to our external auditor’s reasonable assurance. Furthermore, we make sure that in any measurement year, the ESG objectives do not overlap with our non-financial performance objectives for the Annual Incentive.
The objectives selected for the 2024 LTI grant are shown in the following table, including the rationale for selecting these objectives and more details on the measurement approach.
2024-2026
ESG objective | Weighting | Rationale | Measurement approach |
|---|---|---|---|
Targeted # of Lives Improved in year 3 1) | 5.0% | Ensure healthy lives and promote well-being for all at all ages (SDG3) Lives Improved | Please refer to section Improving people’s lives for more details. |
Targeted circular revenue in year 3 2) | 5.0% | Ensure sustainable consumption and production patterns (SDG12) Circularity | Please refer to section Circular Economy for more details. |
Targeted CO2 equivalent (in Kilotonnes) in year 3 | 5.0% | Take urgent action to combat climate change and its impacts (SDG13) Carbon footprint | Please refer to section Sustainable Operations for more details. |
Targeted Employee Engagement Score in year 3 | 5.0% | Retain an engaged workforce Employee Engagement Score | The Employee Engagement Score (EES) is the single measure of the overall level of employee engagement at Philips, measured on a bi-yearly basis. |
The following pension arrangement is in place for the members of the Board of Management working under a services agreement governed by Dutch law:
The following table gives an overview of the costs incurred by the company in 2023 and 2022 in relation to the remuneration of the Board of Management. Costs related to performance shares are based on accounting standards (IFRS), which prescribe that costs for each LTI grant are recognized over the full (multi-year) vesting period, proportionate to the relevant fiscal year. Therefore, the costs for any year reflect costs of multiple LTI grants, as opposed to the actual value for the holder of an LTI grant at the vesting date. Please refer to section 2021 Long-Term Incentive for more details on the actual vesting of the performance shares.
Philips Group
Remuneration Board of Management1)
in EUR
| Accounting costs in the year | ||||||||||
|---|---|---|---|---|---|---|---|---|---|---|
| reported year | annual base compensation2) | base compensation | realized annual incentive | performance shares3) | pension allowances4) | pension scheme costs | other compensation5) | total cost | Fixed-variable remuneration6) | |
| R. Jakobs | 2023 | 1,200,000 | 1,200,000 | 2,004,480 | 968,922 | 267,798 | 31,891 | 109,256 | 4,582,347 | 35%-65% |
| 2022 | 1,200,000 | 256,438 | waived | 112,737 | 57,973 | 6,012 | 11,507 | 444,667 | 75%-25% | |
| A. Bhattacharya | 2023 | 810,000 | 810,000 | 1,075,939 | 793,429 | 197,133 | 31,891 | 94,516 | 3,002,907 | 38%-62% |
| 2022 | 810,000 | 806,250 | waived | 763,1407) | 237,250 | 28,133 | 61,308 | 1,896,081 | 60%-40% | |
| M.J. van Ginneken | 2023 | 630,000 | 630,000 | 846,922 | 614,840 | 125,298 | 31,891 | 53,446 | 2,302,397 | 37%-63% |
| 2022 | 630,000 | 626,250 | waived | 585,4907) | 141,622 | 28,133 | 35,343 | 1,416,837 | 59%-41% | |
| Total | 2023 | 2,640,000 | 3,927,341 | 2,377,191 | 590,228 | 95,673 | 257,218 | 9,887,650 | 36%-64% | |
| 2022 | 1,688,938 | waived | 1,461,367 | 436,845 | 62,278 | 108,158 | 3,757,585 | 61%-39% | ||
Internal pay ratios are a relevant input factor for determining the appropriateness of the implementation of the Remuneration Policy, as recognized in the Dutch Corporate Governance Code. For the 2023 financial year, the ratio between the annual total compensation for the CEO and the average annual total compensation for an employee was 46:1. The ratio decreased from 55:1 in 2022. Further details on the development of these amounts and ratios over time can be found in the following table. Please note that the amounts presented in the following table reflect total remuneration costs to the company which differ from the actual payout to the members of the Board of Management.
Philips Group
Remuneration costs
in EUR
| 2019 | 2020 | 2021 | 2022 | 2023 | |
| Remuneration | |||||
| CEO Total Remuneration Costs (A)1) | 5,260,111 | 6,153,067 | 5,452,299 | 5,133,659 | 4,582,347 |
| CFO Total Remuneration Costs | 2,602,606 | 3,007,990 | 2,652,864 | 1,896,081 | 3,002,907 |
| CLO Total Remuneration Costs | 1,856,426 | 2,203,160 | 2,029,054 | 1,416,837 | 2,302,397 |
| Average Employee (FTE) Total Remuneration Costs (B)2) | 92,645 | 91,455 | 86,853 | 93,373 | 99,870 |
| Ratio A versus B3) | 57:1 | 67:1 | 63:1 | 55:1 | 46:1 |
| Company performance | |||||
| Annual TSR4) | 25.6% | 6.2% | (14.5)% | (60.0)% | 42.9% |
| Comparable Sales Growth%5) | 4.5% | 2.9% | (1.2)% | (2.8)% | 6.0% |
| Adjusted EBITA%5) | 13.2% | 13.2% | 12.0% | 7.4% | 10.6% |
| Free Cash Flow5) | 923 | 1,635 | 900 | (961) | 1,582 |
Under the LTI Plan the current members of the Board of Management were granted 236,622 performance shares in 2023. The following table provides an overview at end December 2023 of performance share grants.
Philips Group
Number of performance shares (holdings)
in number of shares unless otherwise stated
| grant date | number of shares originally granted | value at grant date | vesting date | end of holding period | unvested opening balance at Jan. 1, 2023 | number of shares awarded in 2023 | (dividend) shares awarded | number of shares vested in 20231) | value at vesting date in 2023 | unvested closing balance at Dec. 31, 2023 | |
|---|---|---|---|---|---|---|---|---|---|---|---|
| R. Jakobs | 4/30/2020 | 17,7042) | 706,250 | 4/30/2023 | 4/30/2025 | 19,073 | waived | 0 | |||
| 4/30/2021 | 15,8122) | 750,000 | 4/30/2024 | 4/30/2026 | 16,696 | 747 | 17,443 | ||||
| 4/29/2022 | 37,6302) | 930,000 | 4/29/2025 | 4/29/2027 | 39,009 | 1,745 | 40,754 | ||||
| 10/28/2022 | 24,279 | 314,137 | 10/28/2025 | 10/28/2027 | 24,279 | 1,086 | 25,365 | ||||
| 4/28/2023 | 124,538 | 2,400,000 | 4/28/2026 | 4/28/2028 | 0 | 124,538 | 5,571 | 130,109 | |||
| A. Bhattacharya | 4/30/2020 | 29,518 | 1,177,500 | 4/30/2023 | 4/30/2025 | 31,800 | waived | 0 | |||
| 4/30/2021 | 25,141 | 1,192,500 | 4/30/2024 | 4/30/2026 | 26,547 | 1,187 | 27,734 | ||||
| 4/29/2022 | 49,162 | 1,215,000 | 4/29/2025 | 4/29/2027 | 50,964 | 2,280 | 53,244 | ||||
| 4/28/2023 | 63,047 | 1,215,000 | 4/28/2026 | 4/28/2028 | 0 | 63,047 | 2,820 | 65,867 | |||
| M.J. van Ginneken | 4/30/2020 | 22,373 | 892,500 | 4/30/2023 | 4/30/2025 | 24,103 | waived | 0 | |||
| 4/30/2021 | 19,448 | 922,500 | 4/30/2024 | 4/30/2026 | 20,535 | 919 | 21,454 | ||||
| 4/29/2022 | 38,237 | 945,000 | 4/29/2025 | 4/29/2027 | 39,638 | 1,773 | 41,412 | ||||
| 4/28/2023 | 49,037 | 945,000 | 4/28/2026 | 4/28/2028 | 0 | 49,037 | 2,194 | 51,231 |
To further align the interests to those of stakeholders and to motivate the achievement of sustained performance, the members of the Board of Management are bound to a minimum shareholding requirement. The following table shows the minimum shareholding requirement, annual base compensation, (vested) shares held and share ownership ratio of each Board of Management member as per December 31, 2023. Until the minimum shareholding requirement is reached, the members of the Board of Management are required to retain all after-tax performance shares that have vested, but they are not required to make additional share purchases.
Please find below a brief summary of the Remuneration Policy for the Supervisory Board, as adopted at the Annual General Meeting of Shareholders 2020. The fee levels in this Remuneration Policy are the same as the Supervisory Board fee levels as determined by our shareholders at the 2018 Extraordinary General Meeting of Shareholders.
The overarching objective of the 2020 Remuneration Policy for the Supervisory Board is to enable its members to fulfill their duties, acting independently: supervising the policies, management and the general affairs of Philips, and supporting the Board of Management and the Executive Committee with advice. Also, the members of the Supervisory Board are guided by the company’s long-term interests, with due observance of the company’s purpose and strategy, taking into account the interests of shareholders and all other stakeholders.
To support the objectives mentioned above, the 2020 Remuneration Policy is aimed at attracting and retaining international Supervisory Board members of the highest caliber and with experience and expertise relevant to our health technology businesses.
In compliance with the Dutch Corporate Governance Code, the 2020 Remuneration Policy provides that the remuneration for the members of the Supervisory Board is not dependent on the results of the company and does not include any shares (or rights to shares). Nevertheless, members of the Supervisory Board are encouraged to hold shares in the company for the purpose of long-term investment to reflect their confidence in the future course of the company. The company does not grant personal loans to members of the Supervisory Board.
The Supervisory Board reviews fee levels in principle every three years, in order to monitor and take account of market developments and manage expectations of our key stakeholders. The levels are aimed at broadly median market levels (and around the 25th percentile market level for the Chairman) paid in the Quantum Peer Group (as used in the 2020 Remuneration Policy for the Board of Management).
The following table provides an overview of the current remuneration structure:
Philips Group
Remuneration Supervisory Board
in EUR
| Chair | Vice Chair | Member | |
|---|---|---|---|
| Supervisory Board | 155,000 | 115,000 | 100,000 |
| Audit Committee | 27,000 | n.a. | 18,000 |
| Remuneration Committee | 21,000 | n.a. | 14,000 |
| Corporate Governance and Nomination & Selection Committee | 21,000 | n.a. | 14,000 |
| Quality & Regulatory Committee | 21,000 | n.a. | 14,000 |
| Attendance fee per inter-European trip | 2,500 | 2,500 | 2,500 |
| Attendance fee per intercontinental trip | 5,000 | 5,000 | 5,000 |
| Entitlement to Philips product arrangement | 2,000 | 2,000 | 2,000 |
| Annual fixed net expense allowance | 11,345 | 2,269 | 2,269 |
| Other travel expenses | As reasonably incurred | ||
The members of the Supervisory Board benefit from coverage under the company’s Directors and Officers (D&O) liability insurance.
The individual members of the Supervisory Board received, by virtue of the positions they held, the following remuneration in 2023:
Philips Group
Remuneration of the Supervisory Board
in EUR
| membership | committees | other compensation1) | total | |
|---|---|---|---|---|
| F. Sijbesma | 155,000 | 35,000 | 16,345 | 206,345 |
| P.A.M. Stoffels | 115,000 | 35,000 | 22,269 | 172,269 |
| D.E.I. Pyott | 100,000 | 35,000 | 19,769 | 154,769 |
| A.M. Harrison | 100,000 | 14,000 | 19,769 | 133,769 |
| M.E. Doherty | 100,000 | 27,000 | 27,269 | 154,269 |
| P. Löscher | 100,000 | 32,000 | 17,269 | 149,269 |
| I. Nooyi | 100,000 | 14,000 | 17,269 | 131,269 |
| S.K. Chua | 100,000 | 18,000 | 22,269 | 140,269 |
| H. Verhagen | 100,000 | 14,000 | 7,269 | 121,269 |
| S. Poonen | 100,000 | 18,000 | 19,769 | 137,769 |
| Total | 1,070,000 | 242,000 | 189,266 | 1,501,266 |
The Audit Committee is chaired by Liz Doherty. Its other members are Peter Löscher, Chua Sock Koong and Sanjay Poonen. Feike Sijbesma and Herna Verhagen also attend Audit Committee meetings. The Committee assists the Supervisory Board in fulfilling its supervisory responsibilities, including ensuring the integrity of the company’s financial statements, reviewing the company’s internal controls and overseeing the enterprise risk management process.
In 2023, the Audit Committee held five regular meetings and one extraordinary meeting, which all Audit Committee members attended.
The CEO, CFO, Chief ESG & Legal Officer, Head of Internal Audit, Chief Accounting Officer and external auditor (Ernst & Young Accountants LLP) were invited to and attended all regular meetings.
The Committee also met separately in private sessions with the CEO, CFO, Head of Internal Audit and external auditor after every regular quarterly meeting of the Committee. Prior to the Committee meetings, the Audit Committee chair met one-on-one with the Group Treasurer as well as with each of the management who regularly attend the Audit Committee meetings (as set out in the previous paragraph) and with the external auditor (Ernst & Young Accountants LLP).
The following overview highlights matters that were reviewed and/or discussed during Committee meetings in the course of, or in respect of, the financial year 2023:
In February 2024, the Committee reviewed, together with the other members of the Supervisory Board, the draft of the Annual Report 2023, as well as the key audit matters and the critical audit matters identified by the external auditor in relation to the 2023 financial statements included in the Annual Report 2023 and the Annual Report on Form 20-F, respectively. In February 2024, the Committee also reviewed the draft of the company’s 2023 Country Activity and Tax Report.
During each regular quarterly Audit Committee meeting, the Committee reviewed the quarterly report from the external auditor, in which the auditor set forth its findings and attention points during the relevant period. Apart from the Audit Committee meetings, the external auditor also attended all private sessions with the Audit Committee, where their observations were, if necessary, further discussed. The Annual Audit Letter was circulated to the full Supervisory Board, and planned actions to address the items raised were discussed with management in the subsequent Audit Committee meetings as well as in private sessions with management.
Finally, the Committee reviewed the Audit Committee Charter and concluded it remains appropriate.
The Quality & Regulatory Committee was established in view of the importance of patient safety and the quality of the company’s products, systems, services and solutions. The Committee provides broad oversight of compliance with the regulatory requirements that govern the development, manufacturing, marketing and servicing of the company’s products, systems, services and solutions. The Quality & Regulatory Committee assists the Supervisory Board in fulfilling its oversight responsibilities in these areas. It is chaired by David Pyott and its members are Marc Harrison and Peter Löscher.
In 2023, the Quality & Regulatory Committee held four meetings and all Committee members attended these meetings. The Quality & Regulatory Committee convened less frequently in 2023 (compared to 2022), as the quality related matters were a regular item on the agenda of the Supervisory Board meeting. The Chief Executive Officer, the Chief ESG & Legal Officer, the Chief Operations Officer and the Chief Quality & Regulatory Officer were present during these meetings.
The following overview indicates some of the matters that were discussed during meetings in the course of 2023:
Koninklijke Philips N.V. (Royal Philips), a company organized under Dutch law, is the parent company of the Philips group. Its shares have been listed on the Amsterdam stock exchange (Euronext Amsterdam) since 1912. Furthermore, its shares have been traded in the United States since 1962 and have been listed on the New York Stock Exchange since 1987.
Royal Philips has a two-tier board structure consisting of a Board of Management and a Supervisory Board, each of which is accountable to the General Meeting of Shareholders for the fulfillment of its respective duties.
The company is governed by Dutch corporate and securities laws, its Articles of Association, and the Rules of Procedure of the Board of Management and the Executive Committee and of the Supervisory Board, respectively. Its corporate governance framework is also based on the Dutch Corporate Governance Code (dated December 20, 2022) and US laws and regulations applicable to Foreign Private Issuers. Additionally, the Board of Management has implemented the Philips General Business Principles (GBP) and underlying policies, as well as separate codes of ethics that apply to employees working in specific areas of our business, i.e., the Financial Code of Ethics and the Procurement Code of Ethics. Many of the documents referred to are published on the company’s website and more information can be found in Our approach to risk management.
In this section of the Annual Report, the company addresses the main elements of its corporate governance structure, reports on how it applies the principles and best practices of the Dutch Corporate Governance Code, and provides the information required by the Dutch governmental Decree on Corporate Governance (Besluit inhoud bestuursverslag) and governmental Decree on Article 10 Takeover Directive (Besluit artikel 10 overnamerichtlijn). When deemed necessary in the interests of the company, the company may deviate from aspects of the company’s corporate governance structure, and any such deviations will be disclosed in the company’s corporate governance report.
In compliance with the Dutch Corporate Governance Code, other parts of the management report (within the meaning of article 2:391 of the Dutch Civil Code) included in the Annual Report address the strategy and culture of Philips aimed at sustainable long-term value creation. As described in more detail in Our strategic focus , Philips’ strategy of focused organic growth scalable patient- and people-centric innovation, and focus on reliable execution, is driven by our purpose: to improve people’s health and well-being through meaningful innovation. The Message from the CEO explains how this strategy was executed in 2023; refer also to Financial performance. Furthermore, reference is made to the Philips Operating Model, which among others includes standards for behaviors, quality and integrity within Philips.
Philips’ strategy, and the way it has been developed by the Board of Management under the supervision of the Supervisory Board, clearly integrates the company’s impact in the field of sustainability, including the effects on people and the environment. In How we create value with sustainable impact we report on resource inputs, value outcomes and societal impact across various financial and Environmental, Social and Governance (ESG) dimensions. We engage with our stakeholders and use a double materiality analysis to identify the ESG topics that we believe have the greatest impact: those having financial materiality (the impact of society on Philips) as well as those having impact materiality (the impact of Philips on society); refer to Working with stakeholders and advocacy and Double Materiality Assessment. The materiality analysis underpins the relevance of our fully integrated approach to doing business responsibly and sustainably, including a comprehensive set of key commitments across all the ESG dimensions that guide execution of our strategy; refer to Philips' ESG commitments. As one of these commitments, Philips considers its tax payments as a significant contribution to the communities in which it operates, and an integral part of its social value creation; refer to Total tax contribution.
The Board of Management is entrusted with the management of the company. Certain key officers have been appointed to support the Board of Management in the fulfilment of its managerial duties. The members of the Board of Management and these key officers together constitute the Executive Committee. In this Corporate governance report, wherever the Executive Committee is mentioned, this also includes the members of the Board of Management, unless the context requires otherwise. Please refer to Board of Management and Executive Committee for an overview of the current members.
Under the chairmanship of the President/Chief Executive Officer (CEO), and supported by the other members of the Executive Committee, the members of the Board of Management drive the company’s management agenda and share responsibility for the continuity of the Philips group, focusing on sustainable long-term value creation. Please refer to the Rules of Procedure of the Board of Management and the Executive Committee, which are published on the company’s website, for a description of further responsibilities and tasks, as well as procedures for meetings, resolutions, and minutes.
In fulfilling their duties, the members of the Board of Management and Executive Committee are guided by the interests of the company and its affiliated enterprise, taking into account the interests of its stakeholders. The Board of Management and the Executive Committee have adopted a division of responsibilities based on the functional and business areas, each of which is monitored and reviewed by the individual members. The Board of Management is accountable for the actions and decisions of the Executive Committee and has ultimate responsibility for the company’s external reporting (including reporting to the shareholders of the company).
The Board of Management and the Executive Committee are supervised by the Supervisory Board. Members of the Board of Management and the Executive Committee will be present in the meetings of the Supervisory Board, if so invited. In addition, the CEO and other members of the Board of Management (and if needed, the other members of the Executive Committee) meet on a regular basis with the Chairman and other members of the Supervisory Board. The Board of Management and the Executive Committee are required to keep the Supervisory Board informed of all facts and developments concerning Philips that the Supervisory Board may need to be aware of in order to function as required and to properly carry out its duties.
Certain important decisions of the Board of Management require Supervisory Board approval, including decisions concerning: the operational and financial objectives of the company and the strategy designed to achieve these objectives; the issue, repurchase or cancellation of shares; and major acquisitions or divestments.
Members of the Board of Management, including the CEO, are appointed by the General Meeting of Shareholders upon a binding recommendation drawn up by the Supervisory Board after consultation with the CEO. This binding recommendation may be overruled by a resolution of the General Meeting of Shareholders adopted by a simple majority of the votes cast and representing at least one-third of the issued share capital. If a simple majority of the votes cast is in favor of the resolution to overrule the binding recommendation, but such majority does not represent at least one-third of the issued share capital, a new meeting may be convened, at which the resolution may be passed by a simple majority of the votes cast, regardless of the portion of the issued share capital represented by such majority. In the event that a binding recommendation has been overruled, a new binding recommendation shall be submitted to the General Meeting of Shareholders. If such second binding recommendation has been overruled, the General Meeting of Shareholders shall be free to appoint a board member.
The CEO and the other members of the Board of Management are appointed for a (maximum) term of four years, it being understood that this term expires at the closing of the General Meeting of Shareholders to be held in the fourth calendar year after the year of their appointment or, if applicable, at a later retirement date or other contractual termination date in the fourth year, unless the General Meeting of Shareholders resolves otherwise. The same applies in the case of re-appointment, which is possible for consecutive terms of (a maximum of) four years. A (re-)appointment schedule for the Board of Management is published on the company’s website.
Pursuant to Dutch law, the members of the Board of Management are engaged by means of a services agreement (overeenkomst van opdracht). The term of the services agreement is aligned with the term for which the relevant member has been appointed by the General Meeting of Shareholders. In the event of termination of the services agreement by the company, severance payment is limited to a maximum of one year’s base salary. The services agreements provide no additional termination benefits.
Members of the Board of Management may be suspended by the Supervisory Board and by the General Meeting of Shareholders, and members of the Board of Management may be dismissed by the General Meeting of Shareholders (in each case in accordance with the Articles of Association). A shareholders’ resolution to suspend or dismiss a member of the Board of Management, other than a resolution proposed by the Board of Management or the Supervisory Board, may only be adopted by a simple majority of the votes cast, representing at least one third of the issued share capital. The other members of the Executive Committee are appointed, suspended and dismissed by the CEO, subject to approval by the Supervisory Board.
The Supervisory Board supervises the policies, management and general affairs of Philips, and assists the Board of Management and the Executive Committee with advice on general policies related to the activities of the company. In fulfilling their duties, the members of the Supervisory Board shall be guided by the interests of the company and its affiliated enterprise, taking into account the interests of its stakeholders.
In the two-tier corporate structure under Dutch law, the Supervisory Board is a separate body that is independent of the Board of Management and the company. Its independent character is also reflected in the requirement that members of the Supervisory Board can be neither a member of the Board of Management nor an employee of the company. Currently, the Supervisory Board considers all its members to be independent under the Dutch Corporate Governance Code. Furthermore, the members of its Audit Committee are independent under the rules of the US Securities and Exchange Commission, applicable to the Audit Committee.
The Supervisory Board must approve certain important decisions of the Board of Management, including decisions concerning the operational, business and financial objectives of the company and the strategy designed to achieve these objectives, the issue, repurchase or cancellation of shares and major acquisitions or divestments. The Supervisory Board and its individual members each have a responsibility to request from the Board of Management, the Executive Committee and the external auditor all information that the Supervisory Board needs in order to be able to carry out its duties properly as a supervisory body.
Please refer to the Rules of Procedure of the Supervisory Board, which are published on the company’s website, for a description of further responsibilities and tasks, as well as procedures for meetings, resolutions and minutes.
In its report (included in the company’s Annual Report), the Supervisory Board describes the composition and functioning of the Supervisory Board and its committees, their activities in the financial year, the number of committee meetings held and the main items discussed. Please refer to Supervisory Board report. Please also refer to Supervisory Board for an overview of the current members of the Supervisory Board.
Members of the Supervisory Board are appointed by the General Meeting of Shareholders upon a binding recommendation drawn up by the Supervisory Board. This binding recommendation may be overruled by a resolution of the General Meeting of Shareholders adopted by a simple majority of the votes cast and representing at least one-third of the issued share capital. If a simple majority of the votes cast is in favor of the resolution to overrule the binding recommendation, but such majority does not represent at least one-third of the issued share capital, a new meeting may be convened. At this new meeting the resolution may be passed by a simple majority of the votes cast, regardless of the portion of the issued share capital represented by such majority. In the event that a binding recommendation has been overruled, a new binding recommendation shall be submitted to the General Meeting of Shareholders. If such second binding recommendation has been overruled, the General Meeting of Shareholders shall be free to appoint a board member.
The term of appointment of members of the Supervisory Board expires at the closing of the General Meeting of Shareholders to be held after a period of four years following their appointment. There is no age limit requiring the retirement of board members.
In line with the Dutch Corporate Governance Code, members of the Supervisory Board are eligible for re-appointment for a fixed term of four years once, and may subsequently be re-appointed for a period of two years, which appointment may be extended by at most two years. The report of the Supervisory Board must state the reasons for any re-appointment beyond an eight-year period.
A (re-)appointment schedule for the Supervisory Board is published on the company’s website.
Members of the Supervisory Board may be suspended or dismissed by the General Meeting of Shareholders in accordance with the Articles of Association. A resolution to suspend or dismiss a member of the Supervisory Board, other than a resolution proposed by the Supervisory Board, may only be adopted by a simple majority of the votes cast, representing at least one third of the issued share capital.
Candidates for appointment to the Supervisory Board are selected taking into account the company’s Diversity Policy, which is published on the company’s website. The Supervisory Board’s composition furthermore follows the profile included in the Rules of Procedure of the Supervisory Board, and the size of the board may vary as it considers appropriate to support its profile. Please refer to Supervisory Board report by the Supervisory Board. Typically, newly appointed members of the Supervisory Board follow an induction program and interact with Executive Committee members for deep-dives on matters such as strategy, finance and investor relations, quality, governance, legal, sustainability and digitization.
Effective 2022, Dutch law provides a mandatory gender quota, requiring that at least one-third of the Supervisory Board members are women and at least one-third men (for calculation purposes, a total number of board members that cannot be divided by three must be rounded up to the next number that can be divided by three). The quota is applicable to (i) the appointment of new Supervisory Board members, and (ii) the re-appointment of acting board members after eight years following their initial appointment. Except in certain exceptional circumstances, any appointment or re-appointment resulting in a Supervisory Board composition that does not meet (or no longer meets) the quota, will be invalid (null and void).
As announced on August 14, 2023, Philips and Exor N.V. entered into a relationship agreement on August 13, 2023, as a result of which Exor bought a 15% shareholding in the company. The relationship agreement with Exor has been published on the company’s website, and includes Exor’s commitment to be a long-term minority investor and it's right to propose one member to the Supervisory Board. In this context, it is noted that, for as long as Exor has such nomination right pursuant to the relationship agreement, the independence exception of best practice provision 2.1.7(iii) of the Dutch Corporate Governance Code is deemed to apply to any Exor nominee that has been appointed upon such nomination in accordance with the Relationship Agreement. It is expected that the Supervisory Board will, upon Exor’s exercise of its right, submit a proposal for the appointment of the relevant nominee at the upcoming 2024 Annual General Meeting of Shareholders.
The Supervisory Board, while retaining overall responsibility, has assigned certain tasks to four committees: the Corporate Governance and Nomination & Selection Committee, the Remuneration Committee, the Audit Committee, and the Quality & Regulatory Committee. Each committee reports to the full Supervisory Board. Please refer to the charters of the respective committees, which are published on the company’s website as part of the Rules of Procedure of the Supervisory Board, for a description of their responsibilities, composition, meetings and working procedures.
The Corporate Governance and Nomination & Selection Committee is responsible for preparing selection criteria and appointment procedures for members of the Supervisory Board, the Board of Management and the Executive Committee. The Committee makes proposals to the Supervisory Board for the (re)appointment of such members, and periodically assesses their functioning. The Committee also periodically assesses the Executive Committee succession planning and the Diversity Policy, and supervises the policy of the Executive Committee on the selection criteria and appointment procedures for Philips executives. At least once a year, the Committee reviews the corporate governance principles applicable to the company, and advises the Supervisory Board on any changes to these principles that it deems appropriate.
The Remuneration Committee is responsible for preparing decisions of the Supervisory Board on the remuneration of individual members of the Board of Management and the Executive Committee. The Committee prepares an annual remuneration report, which is published on the company’s website by the Supervisory Board ahead of the Annual General Meeting of Shareholders. In performing its duties and responsibilities, the Remuneration Committee is assisted by an external consultant and an in-house remuneration expert.
The Audit Committee assists the Supervisory Board in fulfilling its oversight responsibilities for: the integrity of the company’s financial statements; the financial and non-financial (ESG) reporting processes; the effectiveness (also in respect of the reporting process) of the risk management and internal controls framework; the internal and external audit process; the internal and external auditor’s qualifications, independence and performance; as well as the company’s process for monitoring compliance with laws and regulations and the GBP (including related manuals, training and tools). It reviews the company’s annual and interim financial statements, including non-financial information, prior to publication and advises the Supervisory Board on the adequacy and appropriateness of internal control policies and internal audit programs and their findings. The Committee furthermore supervises the Internal Audit function, maintains contact with and supervises the external auditor and prepares the nomination of the external auditor for appointment by the General Meeting of Shareholders.
The composition of the Audit Committee meets the relevant requirements under Dutch law and the applicable US rules. All of the members are considered to be independent and financially literate, and the Audit Committee as a whole has competence relevant to the sector in which the company is operating. In addition, Liz Doherty is designated as an Audit Committee financial expert, as defined under the regulations of the US Securities and Exchange Commission. The Supervisory Board considers the expertise and experience available in the Audit Committee, in conjunction with the possibility to take advice from internal and external experts and advisors, to be sufficient for the fulfillment of the tasks and responsibilities of the Audit Committee.
The Quality & Regulatory Committee has been established by the Supervisory Board in view of the central importance of the quality and (patient) safety of the company’s products, systems, services and software as well as the development, testing, manufacturing, marketing and servicing thereof, and the regulatory requirements relating thereto. The Quality & Regulatory Committee assists the Supervisory Board in fulfilling its oversight responsibilities in this area, while recognizing that the Audit Committee assists the Supervisory Board in its oversight of other areas of regulatory, compliance and legal matters.
The remuneration of the individual members of the Board of Management is determined by the Supervisory Board, taking into account the remuneration policy adopted by the General Meeting of Shareholders. The remuneration of the individual members of the Supervisory Board is determined by the General Meeting of Shareholders, also on the basis of a remuneration policy.
The current remuneration policies for the Board of Management and the Supervisory Board, respectively, were adopted in 2020 and are published on the company’s website. Pursuant to Dutch law, the shareholders are entitled to vote on the adoption of the separate remuneration policies for the Board of Management and the Supervisory Board at the Annual General Meeting of Shareholders (at least) every four years. The adoption of a remuneration policy will require a special majority of three-quarters of the votes cast (as the Articles of Association do not provide for a lower majority).
A description of the composition of the remuneration paid and owed to the individual members of the Board of Management and the Supervisory Board is included in the annual remuneration report (as prepared by the Remuneration Committee, adopted by the Supervisory Board and published on the company’s website). Shareholders have an advisory vote at each Annual General Meeting of Shareholders on the remuneration report relating to the preceding financial year.
Pursuant to Dutch law, the Supervisory Board is authorized to reduce or eliminate unpaid bonuses awarded to members of the Board of Management if payment or delivery of the bonus would be unacceptable according to the principles of reasonableness and fairness. The company, which in this respect may also be represented by the Supervisory Board or a special representative appointed for this purpose by the General Meeting of Shareholders, may also request return of bonuses already paid or delivered insofar as these have been granted on the basis of incorrect information on the fulfillment of the relevant performance criteria or other conditions. Bonuses are broadly defined as ‘non-fixed’ (variable) remuneration – either in cash or in the form of share-based compensation – that is conditional in whole or in part on the achievement of certain targets or the occurrence of certain circumstances. The explanatory notes to the balance sheet shall report on any moderation and/or claim for repayment of Board of Management remuneration. No such reduction of unpaid bonuses or requests for repayment occurred during the financial year 2023.
In compliance with the Dutch Corporate Governance Code, the company does not grant personal loans to or guarantees on behalf of, members of the Board of Management or the Supervisory Board. No such loans were granted and no such guarantees were issued in 2023, nor were any loans or guarantees outstanding as of December 31, 2023.
Also in compliance with the Dutch Corporate Governance Code, the Articles of Association provide that shares or rights to shares shall not be granted to members of the Supervisory Board.
Members of the Board of Management and the Supervisory Board may only hold shares in the company for the purpose of long-term investment and must refrain from short-term transactions in Philips securities. According to Philips’ internal rules of conduct with respect to inside information, members of the Board of Management and the Supervisory Board are only allowed to trade in Philips securities (including the exercise of stock options) during ‘windows’ of 20 business days following the publication of annual and quarterly results (provided further the person involved has no inside information regarding Philips at that time, unless an exemption is available). Furthermore, members of the Board of Management and the Supervisory Board are prohibited from trading, directly or indirectly, in securities of any of the companies belonging to Philips’ peer group (as determined by the Supervisory Board) during one week preceding the disclosure of Philips’ annual or quarterly results.
Transactions in Philips shares carried out by members of the Board of Management and the Supervisory Board are reported to the Dutch Authority for the Financial Markets (AFM) in accordance with the EU Market Abuse Regulation and, if necessary, to other relevant authorities.
Unless Dutch law provides otherwise, the members of the Board of Management and of the Supervisory Board shall be reimbursed by the company for various costs and expenses, such as the reasonable costs of defending claims, as formalized in the Articles of Association. Under certain circumstances, described in the Articles of Association, such as an act or failure to act by a member of the Board of Management or a member of the Supervisory Board that can be characterized as intentional (opzettelijk), intentionally reckless (bewust roekeloos) or seriously culpable (ernstig verwijtbaar), there will be no entitlement to this reimbursement unless the law or the principles of reasonableness and fairness require otherwise. The company has also taken out liability insurance (D&O – Directors & Officers) for the persons concerned.
Candidates for appointment to the Supervisory Board, the Board of Management and the Executive Committee are selected taking into account the company’s Diversity Policy for the Supervisory Board, the Board of Management and the Executive Committee. This Diversity Policy aims at a sufficient diversity of views and the expertise needed for a good understanding of current affairs and longer-term risks and opportunities related to the Company’s business, and is published on the company’s website. Effective 2022, Dutch law provides that (re-)appointments of members of the Supervisory Board must be in accordance with a mandatory gender quota, requiring that at least one-third of the supervisory board members are women (and at least one-third are men). There are certain exceptions where the gender quota does not apply, such as the re-appointments within eight years of the initial appointment and (re-)appointments made in exceptional circumstances.
For more details on the Diversity Policy for the Supervisory Board, the Board of Management and the Executive Committee, refer to Report of the Corporate Governance and Nomination & Selection Committee; for more information on the profile and composition of the Supervisory Board refer to Supervisory Board report.
Philips’ commitment to Inclusion & Diversity is also reflected in the company-wide General Business Principles, the Inclusion & Diversity Policy and the Fair Employment Policy. Please refer to Diversity, Inclusion and Well-Being for information on the company’s group-wide approach to inclusion and diversity, including the gender diversity of the Board of Management and the Executive Committee.
Dutch law on conflicts of interest provides that members of the Board of Management or Supervisory Board may not participate in the adoption of resolutions if they have a direct or indirect personal conflict of interest with the company or related enterprise. If all members of the Board of Management have a conflict of interest, the resolution concerned will be considered by the Supervisory Board. If all members of the Supervisory Board have a conflict of interest, the resolution concerned must be considered by the General Meeting of Shareholders.
In compliance with the Dutch Corporate Governance Code, the company’s corporate governance includes rules to specify situations in which a potential or actual conflict may exist, procedures to avoid such conflicts of interest as much as possible, and procedures to deal with such conflicts should they arise. Relevant matters relating to conflicts of interest, if any, must be mentioned in the Annual Report (specifically the management report) for the financial year in question. No decision to enter into any such material transaction in which there is a conflict of interest with a member of the Board of Management or the Supervisory Board, or with any major shareholder (holding at least 10% of the company’s shares) was taken during the financial year 2023.
In compliance with the Dutch Corporate Governance Code, members of the Board of Management require the approval of the Supervisory Board before they can accept a position as a member of a supervisory board or a position as a non-executive director on a one-tier board (Non-Executive Directorship) at another company. The Supervisory Board must be notified of other important positions (to be) held by a member of the Board of Management.
Dutch law provides for certain limitations on the number of Non-Executive Directorships a member of the Board of Management or Supervisory Board may hold. No member of the Board of Management shall hold more than two Non-Executive Directorships at ‘large’ companies (naamloze vennootschappen or besloten vennootschappen) or ‘large’ foundations (stichtingen), as defined under Dutch law, and no member of the Board of Management shall hold the position of chairman of another one-tier board or the position of chairman of another supervisory board. No member of the Supervisory Board shall hold more than five Non-Executive Directorships at such companies or foundations, with a position as chairman counting for two. During the financial year 2023 all members of the Board of Management and the Supervisory Board complied with the limitations described above in this paragraph.
The Annual General Meeting of Shareholders shall be held no later than six months after the end of the financial year. The agenda for the meeting typically includes: an advisory vote on the remuneration report; discussion of the Annual Report; the adoption of the financial statements; policy on additions to reserves and dividends; any proposed dividends or other distributions; discharge of the members of the Board of Management and the Supervisory Board; and any other matters proposed by the Supervisory Board, the Board of Management or shareholders in accordance with Dutch law and the Articles of Association.
Shareholders’ meetings are convened by public notice via the company’s website, and registered shareholders are notified by letter or by electronic means of communication at least 42 days prior to the day of the relevant meeting. Shareholders who wish to exercise the rights attached to their shares in respect of a shareholders’ meeting are required to register for such meeting. Shareholders may attend a meeting in person, vote by proxy (via an independent third party) or grant a power of attorney to a third party to attend the meeting and vote on their behalf. Details on registration for meetings, attendance and proxy voting will be included in the notice convening the relevant meeting.
Pursuant to Dutch law, the record date for the exercise of voting rights and rights relating to shareholders’ meetings is set at the 28th day prior to the day of the relevant meeting. Shareholders registered on such date are entitled to attend the meeting and to exercise the other shareholder rights (at the relevant meeting) notwithstanding any subsequent sale of their shares after the record date.
In accordance with the Articles of Association and Dutch law, requests from shareholders for items to be included on the agenda will generally be honored, subject to the company’s rights to refuse to include the requested agenda item under Dutch law, provided that such requests are made in writing at least 60 days before a General Meeting of Shareholders to the Board of Management and the Supervisory Board by shareholders representing at least 1% of the company’s outstanding capital or, according to the official price list of Euronext Amsterdam, representing a value of at least EUR 50 million. Written requests may be submitted electronically and shall comply with the procedure stipulated by the Board of Management, which is posted on the company’s website.
Pursuant to Dutch law, shareholders requesting an item to be included on the agenda of a meeting have an obligation to disclose their full economic interest (i.e., long position and short position) to the company. The company has the obligation to publish such disclosures on its website.
The main powers of the General Meeting of Shareholders are:
The company applies principle 4.1 of the Dutch Corporate Governance Code within the framework of the Articles of Association and Dutch law and in the manner described in this corporate governance report. All issued and outstanding shares carry voting rights and each share confers the right to cast one vote in a shareholders’ meeting. Pursuant to Dutch law, no votes may be cast at a General Meeting of Shareholders in respect of shares that are held by the company. There are no special statutory rights attached to the shares of the company, and no restrictions on the voting rights of the company’s shares exist. Subject to certain exceptions provided by Dutch law and/or the Articles of Association, resolutions of the General Meeting of Shareholders are passed by an absolute majority of votes cast and do not require a quorum.
The authorized share capital of the company amounts to EUR 800 million, divided into 2 billion common shares with a nominal value of 20 eurocents each and 2 billion preference shares also with a nominal value of 20 eurocents each. On December 31, 2023, the issued share capital amounted to EUR 182,703,193.20 divided into 913,515,966 common shares and no preference shares. All shares are fully paid-up. There are currently no limitations, either under Dutch law or the Articles of Association, to the transfer of the common shares.
Only Euroclear shares are traded on Euronext Amsterdam. Only New York Registry Shares are traded on the New York Stock Exchange. Pursuant to article 10:138(2) of the Dutch Civil Code, the laws of the State of New York are applicable to the proprietary regime with respect to the New York Registry Shares, which proprietary regime includes the requirements for a transfer of, or the creation of an in rem right in, such New York Registry Shares. Euroclear shares and New York Registry Shares may be exchanged for each other.
As per December 31, 2023, approximately 90% of the common shares were held through the system of Euroclear Nederland (Euroclear shares) and approximately 10% of the common shares were represented by New York Registry Shares issued in the name of approximately 820 holders of record. The latter include Cede & Co. Cede & Co acts as nominee for The Depository Trust Company, which holds the shares (indirectly) for individual investors as beneficiaries. Deutsche Bank Trust Company Americas is Philips’ New York transfer agent, registrar and dividend disbursing agent. Since certain shares are held by brokers and other nominees, these numbers may not be representative of the actual number of United States beneficial holders or the number of New York Registry Shares beneficially held by US residents.
At the 2023 Annual General Meeting of Shareholders, it was resolved to authorize the Board of Management, subject to the approval of the Supervisory Board, to issue shares or to grant rights to acquire shares in the company, as well as to restrict or exclude the pre-emption right accruing to shareholders up to and including November 8, 2024. This authorization is limited to a maximum of 10% of the number of shares issued as of May 9, 2023.
In addition, at the 2023 Annual General Meeting of Shareholders, it was resolved to authorize the Board of Management, subject to the approval of the Supervisory Board, to acquire shares in the company within the limits of the Articles of Association and within a certain price range up to and including November 8, 2024. The maximum number of shares the company may hold will not exceed 10% of the issued share capital as of May 9, 2023. The number of shares may be increased by 10% of the issued capital as of that same date in connection with the execution of share repurchase programs for capital reduction programs.
The company’s risk management and internal control framework forms an integral part of the Philips business planning and performance review cycle. The purpose of our risk management is to identify and analyze the risks Philips faces in executing its strategy and activities, to set the risk appetite of the company, to take appropriate risk responses and to monitor its effectiveness. The objective of internal control is to maintain integrated management control of the company’s operations, reporting, and safeguarding compliance with applicable laws and regulations. As part of its internal control framework, Philips has implemented a standard set of Internal Controls over Financial Reporting (ICFR). Please refer to Risk management and internal control framework for a description of the key elements of our framework, and to Risk management for a more detailed description of Philips’ approach to risk management and more information on the risk factors that have been identified, and the risk responses that help to manage such risks in accordance with the relevant level of risk appetite.
Together with Philips’ established accounting procedures, our standard set of internal controls over financial reporting is designed to provide reasonable assurance that assets are safeguarded, that the books and records properly reflect transactions necessary to permit preparation of financial statements, that policies and procedures are carried out by qualified personnel, and that published financial statements are properly prepared and do not contain any material misstatements. With respect to financial reporting, a structured self-assessment and monitoring process is used company-wide to assess, document, review and monitor compliance with ICFR.
On the basis of the outcome of these processes, the Board of Management confirms that: (i) the management report (within the meaning of section 2:391 of the Dutch Civil Code) provides sufficient insights into any failings in the effectiveness of the internal risk management and control systems; (ii) such systems provide a reasonable level of assurance that the financial reporting does not contain any material inaccuracies; (iii) based on the current state of affairs, it is justified that the financial reporting is prepared on a going concern basis; and (iv) the management report states those material risks and uncertainties that are relevant to the expected continuity of the company for a period of 12 months after the preparation of the report. The financial statements fairly represent the financial condition and result of operations of the company and they provide the required disclosures.
In view of the above, the Board of Management believes that it is in compliance with best practice provision 1.4.2 of the Dutch Corporate Governance Code. It should be noted that the above does not imply that the internal risk management and control systems provide certainty as to the realization of operational and financial business objectives, nor can they prevent all misstatements, inaccuracies, errors, fraud or non- compliances with rules and regulations. The above statement on internal control should not be construed as a statement in response to the requirements of section 404 of the US Sarbanes-Oxley Act. The statement as to compliance with section 404 is set forth in Management’s statements and report.
The annual financial statements are prepared by the Board of Management and reviewed by the Supervisory Board upon the advice of its Audit Committee, taking into account the report of the external auditor. Upon approval by the Supervisory Board, the accounts are signed by all members of both the Board of Management and the Supervisory Board and are published together with the opinion of the external auditor. The Board of Management is responsible, under the supervision of the Supervisory Board, for the quality and completeness of such publicly disclosed financial reports. The annual financial statements are presented for discussion and adoption at the Annual General Meeting of Shareholders, to be convened subsequently.
The external auditor is appointed by the General Meeting of Shareholders in accordance with the Articles of Association. Philips’ current external auditor, Ernst & Young Accountants LLP, was appointed by the General Meeting of Shareholders held on May 7, 2015, for a term of four years starting January 1, 2016, was re-appointed at the Annual General Meeting of Shareholders held on May 9, 2019 for a term of three years starting January 1, 2020, was re-appointed at the Annual General Meeting of Shareholders held on May 10, 2022 for a term of one year starting January 1, 2023, and was re-appointed at the Annual General Meeting of Shareholders held on May 9, 2023 for a term of one year starting January 1, 2024.
PricewaterhouseCoopers Accountants N.V. was appointed at the Annual General Meeting of Shareholders held on May 9, 2023 as the company’s new external auditor for a term of four years starting January 1, 2025.
European and Dutch law requires the separation of audit and certain non-audit services. The external auditor may only provide audit and audit-related services and is prohibited from providing any other services. This is reflected in the Auditor Policy, which is published on the company’s website. The policy is also in line with (and in some ways stricter than) applicable US rules, under which the appointed external auditor must be independent from the company both in fact and appearance.
The Auditor Policy specifies certain audit services and audit-related services (also known as assurance services) that will or may be provided by the external auditor, and includes rules for the pre-approval by the Audit Committee of such services. Audit services must be pre-approved on the basis of the annual audit services engagement agreed with the external auditor. Proposed audit-related services may be pre-approved at the beginning of the year by the Audit Committee (annual pre-approval) or may be pre-approved during the year by the Audit Committee with respect to a particular engagement (specific pre-approval). The annual pre-approval is based on a detailed, itemized list of services to be provided, which is designed to ensure that there is no management discretion in determining whether a service has been approved, and to ensure that the Audit Committee is informed of each of the services it is pre-approving. Unless pre-approval with respect to a specific service has been given at the beginning of the year, each proposed service requires specific pre-approval during the year. Any annually pre-approved services where the fee for the engagement is expected to exceed pre-approved cost levels or budgeted amounts will also require specific pre-approval. The term of any annual pre-approval is 12 months from the date of the pre-approval unless the Audit Committee states otherwise. During 2023, there were no services provided to the company by the external auditor that were not pre-approved by the Audit Committee.
Stichting Preferente Aandelen Philips, a Foundation (stichting) organized under Dutch law, has been granted the right to acquire preference shares in the capital of Royal Philips, as stated in the company’s Articles of Association. In addition, the Foundation has the right to file a petition with the Enterprise Chamber of the Amsterdam Court of Appeal to commence an inquiry procedure within the meaning of article 2:344 of the Dutch Civil Code.
The object of the Foundation is to represent the interests of Royal Philips, the enterprises maintained by the company and its affiliated companies within the company’s group, in such a way that the interests of the company, these enterprises and all parties involved with them are safeguarded as effectively as possible, and that they are afforded maximum protection against influences which, in conflict with those interests, may undermine the autonomy and identity of Philips and those enterprises, and also to do anything related to the above ends or conducive to them. The Foundation's object includes the protection of Philips against (an attempt at) an unsolicited takeover or other attempt to exert (de facto) control of the company. The arrangement will allow Philips to determine its position in relation to the relevant third party (or parties) and its (their) plans, to seek alternatives and to defend the company’s interests and those of its stakeholders.
The mere notification that the Foundation exercises its right to acquire preference shares will result in such shares being effectively issued. The Foundation may exercise this right for as many preference shares as there are common shares in the company outstanding at that time. No preference shares have been issued as of December 31, 2023.
The members of the self-electing Board of the Foundation are Messrs J.P. de Kreij, J.V. Timmermans, J. van der Veer and P.N. Wakkie. No Philips Supervisory Board or Board of Management members or Philips officers are represented on the board of the Foundation.
Other than the arrangements made with the Foundation referred to above, the company does not have any measures that exclusively or almost exclusively have the purpose of defending against unsolicited public offers for shares in the capital of the company. It should be noted that the Board of Management and the Supervisory Board remain under all circumstances authorized to exercise all powers vested in them to promote the interests of Philips.
The company has issued certain corporate bonds, the provisions of which contain a 'Change of Control Triggering Event' or a 'Change of Control Put Event’. Upon the occurrence of such events, the company might be required to offer to redeem or purchase any outstanding bonds at certain pre-determined prices. Please also refer to Debt. Furthermore, the Relationship Agreement entered into between the company and its long-term minority investor Exor N.V. (published on the company’s website) includes certain temporary lock-up obligations for Exor which fall away when any third party has ‘Acquired’ an ‘Interest’ of fifty percent (50%) or more in the company.
Philips is continuously focused on maintaining strong and open relations with its shareholders. In addition to communication with its shareholders at shareholders’ meetings, the company may discuss its financial results during conference calls, which are broadly accessible. The company also publishes annual, semi-annual and quarterly reports and press releases, and informs investors via its website.
From time to time the company communicates with investors and analysts via roadshows, broker conferences and a Capital Markets Day, which are announced in advance on the company’s website. The purpose of these engagements is to further inform the market of the results, strategy and decisions made, as well as to receive feedback from shareholders. It is the company’s policy to post presentations to investors and analysts on its website. Philips applies the best practice provision 4.2.3 of the Dutch Corporate Governance Code, which it does not view (in line with market practice) as extending to less important analyst meetings and presentations.
Furthermore, Philips engages in bilateral communications with investors and analysts. These communications take place either at the initiative of the company or at the initiative of investors/analysts. The company is generally represented by its Investor Relations department during these interactions, however, on a limited number of occasions the Investor Relations department is accompanied by one or more members of the senior management. The subject matter of the bilateral communications ranges from individual queries from investors/analysts to more elaborate discussions following disclosures that the company has made, such as its annual and quarterly reports. Philips complies with applicable rules and regulations on fair and non-selective disclosure and equal treatment of shareholders.
The Dutch Act on Financial Supervision imposes an obligation on persons holding certain interests to disclose (inter alia) percentage holdings in the capital and/or voting rights in the company when such holdings reach, exceed or fall below 3, 5, 10, 15, 20, 25, 30, 40, 50, 60, 75 and 95 percent (as a result of an acquisition or disposal by a person, or as a result of a change in the company’s total number of voting rights or capital issued). Certain derivatives (settled in kind or in cash) are also taken into account when calculating the capital interest. The statutory obligation to disclose capital interest relates not only to gross long positions, but also to gross short positions. Required disclosures must be made to the Dutch Authority for the Financial Markets (AFM) without delay. The AFM then notifies the company of such disclosures and includes them in a register, which is published on the AFM’s website. Furthermore, an obligation to disclose (net) short positions is set out in the EU Regulation on Short Selling.
The AFM register shows the following notifications of substantial holdings and/or voting rights at or above the 3% threshold: Exor N.V.: substantial holding of 15.00% and 15.00% of the voting rights (August 13, 2023); BlackRock, Inc.: substantial holding of 5.08% and 6.56% of the voting rights (December 1, 2023); UBS Group AG: substantial holding of 3.61% and 3.61% of the voting rights (September 1, 2023); Mondrian Investment Partners Limited: substantial holding of 3.02% and 3.02% of the voting rights (February 17, 2023).
The company began as a limited partnership with the name Philips & Co in Eindhoven, the Netherlands, in 1891, and was converted into the company with limited liability N.V. Philips’ Gloeilampenfabrieken on September 11, 1912. The company’s name was changed to Philips Electronics N.V. on May 6, 1994, to Koninklijke Philips Electronics N.V. on April 1, 1998, and to Koninklijke Philips N.V. on May 15, 2013.
The majority of the shares in Royal Philips are held through the system maintained by the Dutch Central Securities Depository (Euroclear Nederland). In the past, Philips has also issued (physical) bearer share certificates ('Share Certificates'). A limited number of Share Certificates have not been surrendered yet, although the holders of Share Certificates are still entitled to a corresponding number of shares in Royal Philips. It is noted that, as a result of Dutch legislation that became effective in July 2019, the relevant shares were registered in the name of Royal Philips by operation of law per January 1, 2021. Owners of Share Certificates will continue to be entitled to a corresponding number of shares, but may not exercise the rights attached to such shares until they surrender their Share Certificates. Owners of Share Certificates may come forward to do so and to receive a corresponding number of shares until January 1, 2026, at the latest. As per January 2, 2026, entitlements attached to the Share Certificates not surrendered will expire by operation of law. For more information, please contact the Investor Relations department by email (investor.relations@philips.com) or telephone (+31-20-59 77222).
The statutory seat of the company is Eindhoven, the Netherlands, and the statutory list of all subsidiaries and affiliated companies, prepared in accordance with the relevant legal requirements (Dutch Civil Code, Book 2, articles 379 and 414), forms part of the notes to the financial statements and is deposited at the office of the Commercial Register in Eindhoven, the Netherlands (file no. 17001910). The executive offices of the company are located at the Philips Center, Amstelplein 2, 1096 BC Amsterdam, the Netherlands, telephone +31-20-59 77777.
The Board of Management and the Supervisory Board are of the opinion that the principles and best practice provisions of the Dutch Corporate Governance Code that are addressed to the boards are being applied. The full text of the Dutch Corporate Governance Code can be found on the website of the Monitoring Commission Corporate Governance Code (www.mccg.nl).
Group financial statements contents
Philips Group
Consolidated statements of income
in millions of EUR
For the year ended December 31
| 2021 | 2022 | 2023 | |
|---|---|---|---|
| Sales6 | 17,156 | 17,827 | 18,169 |
| Cost of sales | (9,988) | (10,633) | (10,721) |
| Gross margin | 7,168 | 7,194 | 7,448 |
| Selling expenses | (4,258) | (4,621) | (4,524) |
| General and administrative expenses | (599) | (671) | (608) |
| Research and development expenses | (1,806) | (2,091) | (1,890) |
| Impairment of goodwill11 | (15) | (1,357) | (8) |
| Other business income6 | 186 | 127 | 112 |
| Other business expenses6 | (123) | (109) | (645) |
| Income from operations6 | 553 | (1,529) | (115) |
| Financial income7 | 149 | 58 | 63 |
| Financial expenses7 | (188) | (258) | (376) |
| Investments in associates, net of income taxes | (4) | (2) | (98) |
| Income before taxes | 509 | (1,731) | (526) |
| Income tax (expense) benefit8 | 103 | 113 | 73 |
| Income from continuing operations | 612 | (1,618) | (454) |
| Discontinued operations, net of income taxes3 | 2,711 | 13 | (10) |
| Net income | 3,323 | (1,605) | (463) |
| Attribution of net income: | |||
| Net income attributable to shareholders of Koninklijke Philips N.V. | 3,319 | (1,608) | (466) |
| Net income attributable to non-controlling interests | 4 | 3 | 2 |
Philips Group
Earnings per common share attributable to shareholders of Koninklijke Philips N.V.
in EUR
| 2021 | 2022 | 2023 | |
|---|---|---|---|
| Basic earnings per common share attributable to shareholders of Koninklijke Philips N.V. 1) | |||
| Income from continuing operations | 0.64 | (1.76) | (0.50) |
| Net income | 3.52 | (1.75) | (0.51) |
| Diluted earnings per common share attributable to shareholders of Koninklijke Philips N.V. 1) | |||
| Income from continuing operations | 0.64 | (1.76) | (0.50) |
| Net income | 3.50 | (1.75) | (0.51) |
Amounts may not add up due to rounding.
Philips Group
Consolidated statements of comprehensive income
in millions of EUR
For the year ended December 31
| 2021 | 2022 | 2023 | |
|---|---|---|---|
| Net income for the period | 3,323 | (1,605) | (463) |
| Pensions and other-post employment plans:20 | |||
| Remeasurement, before tax | 134 | 101 | (26) |
| Income tax effect on remeasurements8 | (21) | (20) | 3 |
| Financial assets fair value through OCI: | |||
| Net current-period change, before tax | (39) | (32) | (20) |
| Income tax effect on net current-period change | 1 | 1 | 3 |
| Total of items that will not be reclassified to Income Statement | 74 | 49 | (40) |
| Currency translation differences: | |||
| Net current period change, before tax | 1,078 | 748 | (579) |
| Income tax effect on net current-period change8 | (5) | 2 | - |
| Reclassification adjustment for (gain) loss realized | 36 | - | (26) |
| Reclassification adjustment for (gain) loss realized, in discontinued operations | 69 | ||
| Cash flow hedges: | |||
| Net current-period change, before tax | (52) | (29) | 29 |
| Income tax effect on net current-period change8 | 18 | (10) | (2) |
| Reclassification adjustment for (gain) loss realized | (14) | 63 | (19) |
| Total of items that are or may be reclassified to Income Statement | 1,129 | 774 | (597) |
| Other comprehensive income for the period | 1,203 | 823 | (637) |
| Total comprehensive income for the period | 4,527 | (782) | (1,100) |
| Total comprehensive income (loss) attributable to: | |||
| Shareholders of Koninklijke Philips N.V. | 4,520 | (786) | (1,101) |
| Non-controlling interests | 7 | 4 | 1 |
Amounts may not add up due to rounding.
Philips Group
Consolidated balance sheets
in millions of EUR unless otherwise stated
As of December 31
| 2022 | 2023 | |
|---|---|---|
| Non-current assets | ||
| Property, plant and equipment 102 | 2,638 | 2,483 |
| Goodwill112 | 10,238 | 9,876 |
| Intangible assets excluding goodwill122 | 3,526 | 3,190 |
| Non-current receivables16 | 279 | 193 |
| Investments in associates5 | 537 | 381 |
| Other non-current financial assets13 | 660 | 619 |
| Non-current derivative financial assets28 | 4 | 3 |
| Deferred tax assets8 | 2,449 | 2,627 |
| Other non-current assets14 | 98 | 93 |
| Total non-current assets | 20,429 | 19,466 |
| Current assets | ||
| Inventories15 | 4,049 | 3,491 |
| Other current financial assets13 | 11 | 3 |
| Other current assets14 | 490 | 500 |
| Current derivative financial assets28 | 123 | 45 |
| Income tax receivable | 222 | 220 |
| Current receivables2516 | 4,115 | 3,733 |
| Assets classified as held for sale3 | 77 | 79 |
| Cash and cash equivalents29 | 1,172 | 1,869 |
| Total current assets | 10,259 | 9,940 |
| Total assets | 30,688 | 29,406 |
| Equity17 | ||
| Shareholders' equity | 13,249 | 12,028 |
| Common shares | 178 | 183 |
| Capital in excess of par value | 5,025 | 5,827 |
| Reserves | 1,488 | 879 |
| Other | 6,558 | 5,139 |
| Non-controlling interests17 | 34 | 33 |
| Group equity | 13,283 | 12,061 |
| Non-current liabilities | ||
| Long-term debt 18 | 7,270 | 7,035 |
| Non-current derivative financial liabilities28 | 4 | 3 |
| Long-term provisions2019 | 1,097 | 1,035 |
| Deferred tax liabilities8 | 91 | 71 |
| Non-current contract liabilities22 | 515 | 469 |
| Non-current tax liabilities 8 | 435 | 390 |
| Other non-current liabilities22 | 60 | 54 |
| Total non-current liabilities | 9,471 | 9,058 |
| Current liabilities | ||
| Short-term debt 18 | 931 | 654 |
| Current derivative financial liabilities28 | 207 | 40 |
| Income tax payable | 40 | 83 |
| Accounts payable25 | 1,968 | 1,917 |
| Accrued liabilities21 | 1,626 | 1,887 |
| Current contract liabilities22 | 1,696 | 1,809 |
| Short-term provisions2019 | 1,018 | 1,463 |
| Dividend payable | - | 11 |
| Liabilities directly associated with assets held for sale | - | 9 |
| Other current liabilities22 | 448 | 414 |
| Total current liabilities | 7,934 | 8,287 |
| Total liabilities and group equity | 30,688 | 29,406 |
Amounts may not add up due to rounding.
Philips Group
Consolidated statements of cash flows
in millions of EUR
For the year ended December 31
| 2021 | 2022 | 2023 | |
|---|---|---|---|
| Cash flows from operating activities | |||
| Net income (loss) | 3,323 | (1,605) | (463) |
| Results of discontinued operations, net of income tax | (2,711) | (13) | 10 |
| Adjustments to reconcile net income to net cash provided by (used for) operating activities: | |||
| Depreciation, amortization, and impairment of assets | 1,323 | 1,602 | 1,261 |
| Impairment of goodwill | 15 | 1,357 | 8 |
| Share-based compensation | 108 | 95 | 88 |
| Net loss (gain) on sale of assets | 55 | (115) | (71) |
| Interest income | (18) | (25) | (46) |
| Interest expense on debt, borrowings, and other liabilities | 152 | 226 | 255 |
| Investments in associates, net of income taxes | 4 | 112 | 107 |
| Income taxes | (103) | (113) | (71) |
| Decrease (increase) in working capital | (401) | (862) | 913 |
| Decrease (increase) in receivables and other current assets | (39) | (342) | 298 |
| Decrease (Increase) in inventories | (581) | (572) | 257 |
| Increase (decrease) in accounts payable, accrued and other current liabilities | 219 | 52 | 358 |
| Decrease (increase) in non-current receivables and other assets | (46) | 1 | (33) |
| Increase (decrease) in other liabilities | 33 | (84) | (38) |
| Increase (decrease) in provisions19 | 427 | (199) | 422 |
| Other items | (164) | (39) | 129 |
| Interest received | 17 | 15 | 53 |
| Interest paid | (151) | (205) | (250) |
| Dividends received from investments in associates | 14 | 12 | 13 |
| Income taxes paid | (249) | (333) | (152) |
| Net cash provided by (used for) operating activities | 1,629 | (173) | 2,136 |
| Cash flows from investing activities | |||
| Net capital expenditures | (729) | (788) | (554) |
| Purchase of intangible assets | (107) | (105) | (96) |
| Expenditures on development assets | (259) | (257) | (203) |
| Capital expenditures on property, plant and equipment | (397) | (444) | (345) |
| Proceeds from sales of property, plant and equipment | 33 | 18 | 90 |
| Net proceeds from (cash used for) derivatives and current financial assets23 | 48 | (72) | (46) |
| Purchase of other non-current financial assets23 | (124) | (116) | (92) |
| Proceeds from other non-current financial assets23 | 124 | 78 | 48 |
| Purchase of businesses, net of cash acquired45 | (3,098) | (712) | (73) |
| Net proceeds from sale of interests in businesses, net of cash disposed | 107 | 124 | 80 |
| Net cash provided by (used for) for investing activities | (3,672) | (1,487) | (636) |
| Cash flows from financing activities | |||
| Proceeds from issuance (payments on) short-term debt1823 | (25) | 47 | 29 |
| Principal payments on current portion of long-term debt1823 | (302) | (1,472) | (754) |
| Proceeds from issuance of long-term debt1823 | 76 | 2,516 | 544 |
| Re-issuance of treasury shares | 23 | 12 | |
| Purchase of treasury shares17 | (1,636) | (187) | (662) |
| Dividends paid to shareholders of Koninklijke Philips N.V. | (482) | (412) | (2) |
| Dividends paid to shareholders of non-controlling interests | (2) | (6) | (3) |
| Net cash provided by (used for) financing activities | (2,347) | 500 | (848) |
| Net cash provided by (used for) continuing operations | (4,390) | (1,160) | 652 |
| Net cash provided by (used for) discontinued operations3 | 3,403 | (12) | 123 |
| Net cash provided by (used for) continuing and discontinued operations | (986) | (1,172) | 776 |
| Effect of changes in exchange rates on cash and cash equivalents | 65 | 41 | (79) |
| Cash and cash equivalents at the beginning of the period | 3,226 | 2,303 | 1,172 |
| Cash and cash equivalents at the end of the period | 2,303 | 1,172 | 1,869 |
Amounts may not add up due to rounding.
Philips Group
Consolidated statements of changes in equity
in millions of EUR
For the year ended December 31
Common shares | Capital in excess of par value | Fair value through OCI | Cash flow hedges | Currency translation differences | Retained earnings | Treasury shares | Total shareholders' equity | Non-controlling interests | Group equity | |||
|---|---|---|---|---|---|---|---|---|---|---|---|---|
| Reserves | Other | |||||||||||
| Balance as of January 1, 2021 | 182 | 4,400 | (305) | 23 | (58) | 7,828 | (199) | 11,870 | 31 | 11,901 | ||
| Total comprehensive income (loss) | (39) | (48) | 1,175 | 3,432 | 4,520 | 7 | 4,527 | |||||
| Dividend distributed | 1 | 290 | (773) | (482) | (2) | (484) | ||||||
| Minority Buy-out | - | - | ||||||||||
| Transfer of result on disposal of equity investments at FVTOCI to retained earnings | - | - | - | |||||||||
| Purchase of treasury shares | - | (758) | (757) | (757) | ||||||||
| Re-issuance of treasury shares | - | (150) | 18 | 143 | 11 | 11 | ||||||
| Forward contracts | 48 | (869) | (821) | (821) | ||||||||
| Share call options | 12 | (21) | (9) | (9) | ||||||||
| Cancellation of treasury shares | (7) | (1,221) | 1,228 | |||||||||
| Share-based compensation plans | 110 | 110 | 110 | |||||||||
| Income tax share-based compensation plans | (4) | (4) | (4) | |||||||||
| Balance as of December 31, 2021 | 177 | 4,646 | (344) | (25) | 1,117 | 9,344 | (476) | 14,438 | 36 | 14,475 | ||
| Total comprehensive income (loss) | (32) | 23 | 749 | (1,527) | (786) | 4 | (782) | |||||
| Dividend distributed | 3 | 326 | (741) | (412) | (6) | (418) | ||||||
| Minority Buy-out | - | - | ||||||||||
| Transfer of result on disposal of equity investments at FVTOCI to retained earnings | (1) | 1 | - | - | ||||||||
| Purchase of treasury shares | - | (24) | (24) | (24) | ||||||||
| Re-issuance of treasury shares | (43) | (28) | 77 | 7 | 7 | |||||||
| Forward contracts | 76 | (140) | (64) | (64) | ||||||||
| Share call options | 5 | (12) | (6) | (6) | ||||||||
| Cancellation of treasury shares | (2) | (298) | 299 | |||||||||
| Share-based compensation plans | 95 | 95 | 95 | |||||||||
| Income tax share-based compensation plans | 1 | 1 | 1 | |||||||||
| Balance as of December 31, 2022 | 178 | 5,025 | (376) | (2) | 1,866 | 6,832 | (275) | 13,249 | 34 | 13,283 | ||
| Total comprehensive income (loss) | (17) | 8 | (604) | (488) | (1,101) | 1 | (1,100) | |||||
| Dividend distributed | 8 | 741 | (816) | (68) | (3) | (70) | ||||||
| Transfer of result on disposal of equity investments at FVTOCI to retained earnings | 4 | (4) | - | - | ||||||||
| Purchase of treasury shares | - | - | - | |||||||||
| Re-issuance of treasury shares | (29) | (24) | 54 | - | - | |||||||
| Forward contracts | 465 | (608) | (143) | (143) | ||||||||
| Share call options | - | - | ||||||||||
| Cancellation of treasury shares | (3) | (563) | 566 | |||||||||
| Share-based compensation plans | 88 | 88 | 88 | |||||||||
| Income tax share-based compensation plans | 2 | 2 | 2 | |||||||||
| Balance as of December 31, 2023 | 183 | 5,827 | (390) | 6 | 1,263 | 5,402 | (262) | 12,028 | 33 | 12,061 | ||
Amounts may not add up due to rounding.
Koninklijke Philips N.V. (‘Royal Philips’), incorporated and domiciled in the Netherlands, is a public limited liability company organized under Dutch Law. Philips is headquartered in Amsterdam, the Netherlands and has its registered address at High Tech Campus 52, 5656 AG Eindhoven, the Netherlands. The consolidated financial statements of Royal Philips as of December 31, 2023 comprise Royal Philips and its subsidiaries (together referred to as the 'company’ or ‘Philips’ or the 'Group’). Philips is a leading health technology company primarily involved in diagnostic imaging, image-guided therapy, patient monitoring and health informatics, as well as in consumer health and home care.
The Consolidated financial statements are:
The preparation of financial statements requires management to make a number of estimates and judgments that affect the application of accounting policies and the reporting amounts of assets and liabilities, revenues and expenses, and the disclosure of contingent assets and liabilities. Amounts recognized are based on factors that are by default associated with uncertainty. Actual results may therefore differ from estimates. Estimates and underlying assumptions are reviewed on an ongoing basis. Revision to estimates are recognized prospectively. Where applicable, the estimates and judgments of specific financial statement items are described in the respective note to the consolidated financial statements.
The areas involving a higher degree of judgment and complexity in applying accounting principles and for which changes in the assumptions and estimates could result in significantly different results than those recorded in the consolidated financial statements are the following:
The company regularly updates its significant assumptions and estimates to support the reported amounts of assets, liabilities, income and expenses.
In preparing the consolidated financial statements management has considered the impact of climate change, specifically the financial impact of Philips meeting its internal and external climate related aims, the potential impact of climate related risks and the costs incurred to pro-actively manage such risks. These considerations did not have a material impact on the financial reporting judgments, estimates or assumptions. The specific financial impacts considered include, for example: specific climate mitigation measures, such as the use of lower carbon energy sources, the costs of developing more sustainable product offerings and expenses incurred to mitigate against the impact of extreme weather conditions. Philips uses 100% electricity from renewable sources, mainly through long-term Power Purchase Agreements thereby mitigating the impact of carbon taxes. The development of more sustainable products are covered through our EcoDesign program and already included in our R&D expenses. The physical risk related to climate change on our sites resulting from our TCFD-assessment is currently considered limited.
The material accounting policies as generally applied throughout the financial statements are described below. Material accounting policies relating to specific financial statement items are included in the respective notes to the financial statements.
The Consolidated financial statements comprise the financial statements of Koninklijke Philips N.V. and all subsidiaries that the company controls on a consolidated basis. Control exists when the company is exposed or has rights to variable returns from its involvement with the investee and the company has the ability to affect those returns through its power over the investee. Generally, there is a presumption that a majority of voting rights results in control. To support this presumption and in cases where Philips has less than a majority of the voting or similar rights of an investee, Philips considers all relevant facts and circumstances in assessing whether it has power over an investee, including the contractual arrangement(s) with the other vote holders of the investee, rights arising from other contractual arrangements and the company’s voting rights and potential voting rights. Subsidiaries are fully consolidated from the date that control commences until the date that control ceases. All intercompany balances and transactions have been eliminated in the Consolidated financial statements. Unrealized losses are eliminated in the same way as unrealized gains, but only to the extent that there is no evidence of impairment.
The financial statements of all group entities are measured using the currency of the primary economic environment in which the entity operates (functional currency). The euro (EUR) is the functional currency of the company and the presentation currency of the consolidated financial statements. Foreign currency transactions are converted into the functional currency using the exchange rates prevailing at transaction date or the valuation date in cases where items are remeasured. Gains and losses resulting from the settlement of foreign currency transactions and those resulting from the conversion of foreign currency denominated monetary assets and liabilities at period-end exchange rates are recognized in the Consolidated statements of income, except for qualifying cash flow hedges, qualifying net investment hedges and equity investments measured at fair value through OCI which are recognized in other comprehensive income.
All foreign exchange differences are presented as part of Cost of sales, apart from tax items and financial income and expense, which are recognized in the same line item as they relate to in the Consolidated statements of income.
Non-monetary assets and liabilities denominated in foreign currencies that are measured at fair value are retranslated to the functional currency using the exchange rate at the date the fair value was determined. Non-monetary items in a foreign currency that are measured based on historical cost are translated using the exchange rate at the transaction date.
The assets and liabilities of foreign operations, including goodwill and fair value adjustments arising on acquisition, are translated to euros at the exchange rates prevailing at the reporting date. The income and expenses of foreign operations are translated to euros at the exchange rates prevailing at the dates of the transactions.
Foreign currency differences arising upon translation of foreign operations into euros are recognized in Other comprehensive income and presented as part of Currency translation differences in Equity. However, if the operation is not a wholly-owned subsidiary, the proportionate share of the translation difference is allocated to Non-controlling interests.
When a foreign operation is disposed of such that control, significant influence or joint control is lost, the cumulative amount in the Currency translation differences related to the foreign operation is reclassified to the Consolidated statements of income as part of the gain or loss on disposal. When the company disposes of only part of its interest in a subsidiary that includes a foreign operation while retaining control, the respective proportion of the cumulative amount is reattributed to Non-controlling interests. When the company disposes of only part of its investment in an associate or joint venture that includes a foreign operation while retaining significant influence or joint control, the relevant proportion of the cumulative amount is reclassified to the Consolidated statements of income.
No new IFRS accounting standards or amendments to existing standards, effective in 2023, had a significant impact on the consolidated financial statements. The company has not early adopted any standards or amendments to existing standards. Consistent with the IAS 12 amendment regarding Pillar Two taxation as issued by the IASB and adopted by the EU, Philips does not recognize and disclose deferred taxes arising from tax laws that implement Pillar Two model rules published by the Organisation for Economic Co-operation and Development. Furthermore, Philips will recognize and disclose the impact (if any) from Pillar Two income taxes on current tax effective from 2024.
The IASB has issued several IFRS accounting standards, or amendments to standards, with an effective date after 2023. The company does not anticipate that the application of these standards, or amendments to standards, will have a significant effect on the consolidated financial statements upon adoption.
Accounting policies have been applied consistently for all periods presented in these consolidated financial statements. Certain prior-year amounts have been reclassified to conform to the current year presentation due to immaterial organizational changes.
Philips has realigned the composition of its reporting segments effective from April 1, 2023. The most notable change is the shift of the previous Enterprise Diagnostic Informatics business from the Diagnosis & Treatment segment to the Connected Care segment. This business, together with other informatics solutions in the Connected Care segment, now forms the Enterprise Informatics business. Accordingly, the comparative figures for the affected segments have been restated in the consolidated financial statements.
Per share calculations have been adjusted retrospectively for all periods presented to reflect the issuance of shares for the share dividend in respect of 2022.
Segment accounting policies are the same as the accounting policies applied by the company. Operating segments are components of the company’s business activities about which separate financial information is available that is evaluated regularly by the Chief Operating Decision-Maker (the Board of Management of the company). The Board of Management decides how to allocate resources and assesses performance. Reportable segments comprise the operating segments Diagnosis & Treatment, Connected Care and Personal Health. Additionally, besides these reportable segments, segment Other contains the items Innovation & Strategy, IP Royalties, Central costs, and other small items.
Determining reportable segments requires significant judgment and involves evaluating the information which is reviewed by the Chief Operating Decision-Maker (the Board of Management) to assess performance and allocate resources, in accordance with IFRS 8 'Operating Segments'.
The Philips business segments are Diagnosis & Treatment, Connected Care and Personal Health, each being responsible for the management of its business worldwide. As of the first quarter of 2021 the Domestic Appliances business was presented as a discontinued operation and therefore no longer part of the Personal Health segment. The comparative results prior to that were restated to reflect the treatment of the Domestic Appliances business as a discontinued operation. Refer to Discontinued operations and assets classified as held for sale.
Philips focuses on improving people’s lives through meaningful innovation. The Diagnosis & Treatment segment unites the businesses related to the goal of precision diagnosis and disease pathway selection, and the businesses related to image-guided, minimally invasive treatment. The Connected Care segment focuses on patient care solutions, advanced informatics and analytics, and patient and workflow optimization inside and outside the hospital, and aims to unlock synergies from integrating and optimizing patient care pathways, and leveraging provider-payer-patient business models. The Personal Health segment focuses on healthy living and preventative care.
Philips has realigned the composition of its business segments effective from April 1, 2023. The most notable change is the shift of the previous Enterprise Diagnostic Informatics business from the Diagnosis & Treatment segment to the Connected Care segment. This business, together with other informatics solutions in the Connected Care segment, now forms the Enterprise Informatics business. Accordingly, the comparative figures for the affected segments have been restated. The realignment did not impact the presentation of the business segments or the key segmental performance measure, which continues to be Adjusted EBITA.
Philips Group
Information on income statements
in millions of EUR
| sales | sales including intercompany | depreciation and amortization1) | Adjusted EBITA | |
|---|---|---|---|---|
| 2023 | ||||
| Diagnosis & Treatment | 8,818 | 9,253 | (306) | 1,026 |
| Connected Care | 5,138 | 5,149 | (445) | 369 |
| Personal Health | 3,602 | 3,685 | (115) | 597 |
| Other | 612 | 428 | (394) | (71) |
| Inter-segment eliminations | (346) | |||
| Philips Group | 18,169 | 18,169 | (1,261) | 1,921 |
| 2022 | ||||
| Diagnosis & Treatment | 8,290 | 8,576 | (417) | 788 |
| Connected Care | 5,268 | 5,280 | (646) | 111 |
| Personal Health | 3,626 | 3,684 | (132) | 538 |
| Other | 643 | 736 | (407) | (119) |
| Inter-segment eliminations | (449) | |||
| Philips Group | 17,827 | 17,827 | (1,602) | 1,318 |
| 2021 | ||||
| Diagnosis & Treatment | 7,825 | 8,023 | (363) | 1,028 |
| Connected Care | 5,371 | 5,388 | (472) | 553 |
| Personal Health | 3,429 | 3,462 | (131) | 590 |
| Other | 530 | 636 | (357) | (117) |
| Inter-segment eliminations | (353) | |||
| Philips Group | 17,156 | 17,156 | (1,323) | 2,054 |
The term Adjusted EBITA is used to evaluate the performance of Philips and its segments. Adjusted EBITA represents Income from operations excluding amortization and impairment of acquired intangible assets and impairment of goodwill (EBITA) and excluding gains or losses from restructuring costs, acquisition-related charges and other items.
Adjusted EBITA is not a recognized measure of financial performance under IFRS. Presented in the following table is a reconciliation of Adjusted EBITA to the most directly comparable IFRS measure, Net income, for the years indicated. Net income is not allocated to segments as certain income and expense line items are monitored on a centralized basis, resulting in them being shown on a Philips Group level only.
Philips Group
Reconciliation from net income to Adjusted EBITA
In millions of EUR
| Philips Group | Diagnosis & Treatment | Connected Care | Personal Health | Other | |
|---|---|---|---|---|---|
| 2023 | |||||
| Net Income | (463) | ||||
| Discontinued operations, net of income taxes | 10 | ||||
| Income taxes | (73) | ||||
| Investments in associates, net of income taxes | 98 | ||||
| Financial expenses | 376 | ||||
| Financial income | (63) | ||||
| Income from operations | (115) | 720 | (1,199) | 552 | (188) |
| Amortization and impairment of acquired intangible assets | 290 | 89 | 178 | 14 | 9 |
| Impairment of goodwill | 8 | 8 | - | ||
| EBITA | 183 | 816 | (1,020) | 567 | (179) |
| Restructuring and acquisition-related charges | 381 | 118 | 115 | 9 | 140 |
| Other items: | 1,358 | 92 | 1,275 | 22 | (32) |
| Respironics litigation provision | 575 | 575 | |||
| Respironics field-action connected to the proposed consent decree | 363 | 363 | |||
| Respironics field-action running remediation costs | 224 | 224 | |||
| Quality remediation actions | 175 | 81 | 94 | ||
| Provision for a legal matter | 31 | 31 | |||
| Investment re-measurement loss | 23 | 23 | |||
| Gain on divestment of business | (35) | (35) | |||
| Remaining items | 2 | 11 | (12) | (1) | 3 |
| Adjusted EBITA | 1,921 | 1,026 | 369 | 597 | (71) |
Philips Group
Reconciliation from net income to Adjusted EBITA
In millions of EUR
| Philips Group | Diagnosis & Treatment | Connected Care | Personal Health | Other | |
|---|---|---|---|---|---|
| 2022 | |||||
| Net Income | (1,605) | ||||
| Discontinued operations, net of income taxes | (13) | ||||
| Income taxes | (113) | ||||
| Investments in associates, net of income taxes | 2 | ||||
| Financial expenses | 258 | ||||
| Financial income | (58) | ||||
| Income from operations | (1,529) | 538 | (2,347) | 515 | (235) |
| Amortization and impairment of acquired intangible assets | 363 | 115 | 226 | 15 | 8 |
| Impairment of goodwill | 1,357 | 1,357 | |||
| EBITA | 192 | 652 | (764) | 531 | (227) |
| Restructuring and acquisition-related charges | 202 | 3 | 125 | 11 | 62 |
| Other items: | 925 | 133 | 750 | (4) | 46 |
| Respironics field-action connected to the proposed consent decree | 250 | 250 | |||
| Respironics field-action running remediation costs | 210 | 210 | |||
| R&D project impairments | 134 | 73 | 59 | 3 | |
| Portfolio realignment charges | 109 | 109 | |||
| Provision for public investigations tender irregularities | 60 | 60 | |||
| Quality remediation actions | 59 | 59 | |||
| Impairments of assets in S&RC | 39 | 39 | |||
| Remaining items | 63 | - | 24 | (6) | 46 |
| Adjusted EBITA | 1,318 | 788 | 111 | 538 | (119) |
Philips Group
Reconciliation from net income to Adjusted EBITA
In millions of EUR
| Philips Group | Diagnosis & Treatment | Connected Care | Personal Health | Other | |
|---|---|---|---|---|---|
| 2021 | |||||
| Net Income | 3,323 | ||||
| Discontinued operations, net of income taxes | (2,711) | ||||
| Income taxes | (103) | ||||
| Investments in associates, net of income taxes | 4 | ||||
| Financial expenses | 188 | ||||
| Financial income | (149) | ||||
| Income from operations | 553 | 948 | (716) | 576 | (255) |
| Amortization and impairment of acquired intangible assets | 322 | 142 | 158 | 15 | 6 |
| Impairment of goodwill | 15 | 2 | 13 | ||
| EBITA | 890 | 1,092 | (545) | 591 | (248) |
| Restructuring and acquisition-related charges | 95 | (30) | 130 | (1) | (5) |
| Other items: | 1,069 | (35) | 968 | - | 136 |
| Respironics field-action connected to the proposed consent decree | 719 | 719 | |||
| Respironics field-action running remediation costs | 94 | 94 | |||
| Quality remediation actions | 94 | 94 | |||
| Loss on divestment of business | 76 | 76 | |||
| Remaining items | 87 | (35) | 61 | - | 61 |
| Adjusted EBITA | 2,054 | 1,028 | 553 | 590 | (117) |
Transactions between the segments are mainly related to components and parts included in the product portfolio of the other segments. The pricing of such transactions was at cost or determined on an arm’s length basis. Philips has no single external customer that represents 10% or more of sales.
Philips Group
Main countries
in millions of EUR
| sales1) | tangible and intangible assets2) | |
|---|---|---|
| 2023 | ||
| Netherlands | 2,390 | 1,624 |
| United States | 7,178 | 11,410 |
| China | 1,408 | 234 |
| Japan | 941 | 407 |
| Germany | 573 | 348 |
| Other countries | 5,679 | 1,527 |
| Total main countries | 18,169 | 15,550 |
| 2022 | ||
| Netherlands | 2,021 | 1,746 |
| United States | 7,226 | 12,087 |
| China | 1,239 | 260 |
| Japan | 1,011 | 436 |
| Germany | 642 | 323 |
| Other countries | 5,688 | 1,550 |
| Total main countries | 17,827 | 16,402 |
| 2021 | ||
| Netherlands | 1,860 | 1,934 |
| United States | 6,403 | 12,615 |
| China | 1,400 | 258 |
| Japan | 1,068 | 480 |
| Germany | 970 | 305 |
| France | 446 | 49 |
| India | 431 | 85 |
| United Kingdom | 426 | 567 |
| Other countries | 4,150 | 693 |
| Total main countries | 17,156 | 16,986 |
Non-current assets (or disposal groups) are classified as held-for-sale if their carrying amounts are expected to be recovered through a sale transaction rather than through continuing use. Non-current assets (or disposal groups) classified as held-for-sale are measured at the lower of their carrying amount or the fair value less costs of disposal. Depreciation or amortization of an asset ceases when it is classified as held-for-sale. When non-current assets (or disposal groups) are classified as held-for-sale, comparative balances prior to such date are not represented in the Consolidated balance sheets.
A discontinued operation is a component of the company that has either been disposed of or is classified as held-for-sale and represents a separate major line of business or geographical area of operations or is a part of a single coordinated plan to dispose of a separate major line of business or geographical area of operations. Any gain or loss from disposal, together with the results of these operations until the date of disposal, are reported separately as discontinued operations in the Consolidated statements of income.
The financial information of discontinued operations is excluded from the respective captions in the Consolidated financial statements and related notes for all periods presented. Comparatives are re-presented for presentation of discontinued operations in the Consolidated statements of income and Consolidated statements of cash flows.
The determination of the fair value less costs of disposal involves the use of estimates and assumptions that tend to be uncertain. Circumstances to which these adjustments may relate include resolution of uncertainties that arise from the terms of the disposal transaction, such as the resolution of purchase price adjustments and indemnifications, resolution of uncertainties that arise from and are directly related to the operations of the component before its disposal, such as environmental and assurance-type product warranty obligations retained by the company, and the settlement of employee benefit plan obligations provided that the settlement is directly related to the disposal transaction.
In 2023 and 2022 discontinued operations consist of certain costs related to other divestments, which were previously reported as discontinued operations. In 2021 discontinued operations consist primarily of the Domestic Appliances business. The following table summarizes the results of discontinued operations, net of income taxes, reported in the consolidated statements of income.
Philips Group
Discontinued operations, net of income taxes
in millions of EUR
| 2021 | 2022 | 2023 | |
|---|---|---|---|
| Domestic Appliances | 2,698 | 3 | (2) |
| Other | 13 | 10 | (7) |
| Discontinued operations, net of income taxes | 2,711 | 13 | (10) |
On March 25, 2021, Philips signed an agreement to sell its Domestic Appliances business to global investment firm Hillhouse Investment. Since the first quarter of 2021, the Domestic Appliances business is presented as a discontinued operation, and comparative results have been restated to reflect the treatment of the Domestic Appliances business as a discontinued operation, because the sale of the Domestic Appliances business constitutes the discontinuance of a major line of business from the Personal Health segment.
The following table summarizes the results of Domestic Appliances included in the consolidated statements of income as a discontinued operation.
Philips Group
Results of Domestic Appliances
in millions of EUR
| 2021 | 2022 | 2023 | |
|---|---|---|---|
| Sales | 1,516 | 6 | - |
| Costs and expenses | (1,322) | (2) | (2) |
| Income from operations | 194 | 4 | (2) |
| Result on the sale of discontinued operations | 3,241 | 1 | (1) |
| Income before tax | 3,435 | 5 | (3) |
| Income tax benefit (expense)1) | 6 | (2) | 1 |
| Income tax related the sale of discontinued operations | (743) | ||
| Results from discontinued operations | 2,698 | 3 | (2) |
Costs of EUR 64 million incurred in relation to the separation of the Domestic Appliances business in 2021 have been accounted for in continuing operations, because these costs reflect expenses incurred by Royal Philips in the divestment process and are not considered representative of the core business results of the Domestic Appliances business.
On September 1, 2021, the company completed the sale of the Domestic Appliances business and recognized a transaction gain before tax of EUR 3,241 million. Philips received consideration of EUR 4,041 million, which is based on an enterprise value of EUR 3,850 million, increased by an amount of EUR 191 million for closing adjustments related to working capital and net indebtedness. The transaction gain before tax is the net effect of (i) the EUR 4,041 million consideration (ii) less the derecognition of net assets employed of EUR 715 million (iii) less transaction related costs of EUR 16 million, (iv) less the release of cumulative translation losses of EUR 69 million included in Other comprehensive income. The income tax charges related to the divestment process was EUR 743 million, resulting in an after-tax transaction gain of EUR 2,499 million. The income tax charge represents the consolidated tax expense resulting from asset transactions completed as part of the disentanglement of the business in anticipation of its sale, a significant portion of which relates to taxes payable in the Netherlands. In addition, Philips and the buyer entered into a 15-year brand license agreement with future annual payments that represents an estimated net present value of approximately EUR 0.7 billion, which will be received and recognized over time.
Certain costs related to other divestments, which were previously reported as discontinued operations, resulted in a net loss of EUR (7) million in 2023, a net gain of EUR 10 million in 2022 and a net gain of EUR 13 million in 2021.
The following table presents the net cash provided by (used for) discontinued operations reported in the Consolidated statements of cash flows.
Net cash provided by (used for) discontinued operations
in millions of EUR
| 2021 | 2022 | 2023 | |
|---|---|---|---|
| Net cash provided by (used for) operating activities | 85 | (27) | 123 |
| Net cash provided by (used for) investing activities | 3,319 | 15 | |
| Net cash provided by (used for) discontinued operations | 3,403 | (12) | 123 |
In 2023, net cash provided by discontinued operations was EUR 123 million and consisted primarily of a refund received of one-off advance tax payments related to a previously divested business.
In 2022, net cash used for discontinued operations was EUR (12) million and consisted primarily of cash flows related to the tax claims from a previously divested business.
In 2021, net cash provided for discontinued operations was EUR 3,403 million and consisted primarily of the net cash inflow of EUR 3,319 million from the sale of the Domestic Appliances business on September 1, 2021.
As of December 31, 2023, assets held for sale primarily consisted of assets and liabilities directly associated with a business held for sale.
As of December 31, 2022, assets held for sale consists of property, plant and equipment mainly related to the APAC Center Singapore building. The sale was finalized in January 2023.
The company accounts for business combinations using the acquisition method when control is transferred to the group. The consideration transferred in the acquisition is generally measured at fair value, as are the identifiable net assets acquired and the liabilities assumed. Transaction costs are expensed as incurred. Any contingent consideration is measured at fair value at the acquisition date and is initially presented in Long-term provisions. When the timing and amount of the consideration become more certain, it is reclassified to Accrued liabilities. If the contingent consideration that meets the definition of a financial instrument is classified as equity, it is not remeasured and settlement is accounted for within equity. Otherwise, subsequent changes in the fair value of the contingent consideration are recognized in the Consolidated statements of income.
Changes to the initial fair value of the acquired assets and liabilities, based on new information about the circumstances at the acquisition date, can be made up to twelve months after the acquisition date.
Upon loss of control, the company derecognizes the assets and liabilities of the subsidiary, any non-controlling interests and the other components of equity related to the subsidiary. Any surplus or deficit arising from the loss of control is recognized in the Consolidated statements of income. If the company retains any interest in the previous subsidiary, such interest is measured at fair value at the date the control is lost. Subsequently it is accounted for as either an equity-accounted investee (associate) or as a financial asset, depending on the level of influence retained. Further information on loss of control can be found in Discontinued operations and assets classified as held for sale.
Intangible assets acquired in a business acquisition and the financial liability related to non-controlling interest are measured at fair value at the date of the acquisition.
To determine the fair value of intangible assets at the acquisition date, estimates and assumptions are required. The valuation of the identifiable intangible assets involves estimates of expected sales, earnings and/or future cash flows and require use of key assumptions such as discount rate, royalty rate and growth rates.
Estimates are also applied when determining the fair value of legal cases and tax positions in the acquired entity. The fair value is based on estimates of the likelihood, the expected timing and the amount of the potential cash outflow. Provisions for legal cases and non-income tax positions are recognized at fair value even if it is not probable that an outflow will be required to settle the obligation. After initial recognition and until the liability is settled, cancelled or expired, the liability is measured at the higher of the amount that would be recognized in accordance with IAS 37 'Provisions, contingent liabilities and contingent assets' and the initial liability amount. For income tax positions, the company applies IAS 12 'Income Taxes', which requires recognition of provisions only when the likelihood of cash outflow is considered probable.
On May 5, 2023, Philips completed one acquisition within Ultrasound business unit to accelerate the growth of its Diagnosis & Treatment segment. The total equity purchase price and the settlement of debt, net of acquired cash, involved an amount of EUR 53 million and a contingent consideration of EUR 6 million at fair value, the latter recognized as a Long-term provision. Upon acquisition, the company recognized Goodwill of EUR 24 million, Other intangible assets of EUR 40 million and deferred tax asset and liability of EUR 5 million and EUR 2 million, respectively. The acquisition is subject to final purchase price allocation procedures, which is expected to be finalized in the second quarter of 2024. The primary provisional accounts subject to change are related to acquired intangible assets and goodwill.
Since the acquisition date through December 31, 2023, the contribution to sales to third parties and net income of the acquiree was not material. The sales and net income would not differ materially if the acquisition date had been January 1, 2023. Acquisition-related costs were recognized in General and administrative expenses and were not material.
During 2023 Philips completed six divestments for net cash consideration of EUR 80 million and a gain of EUR 50 million, which is included in Other business income of the Consolidated statements of income. The most notable was the sale of Philips Pharma Solutions in the US. The divestments were not material.
In 2022 Philips completed three acquisitions. The acquisitions involved aggregated net cash outflow of EUR 359 million. Including final purchase price adjustments processed in the course of 2023, the company recognized contingent consideration of EUR 96 million measured at fair value, aggregated Goodwill of EUR 307 million, Other intangible assets of EUR 179 million, Deferred tax assets of EUR 20 million and Deferred tax liabilities generated from the intangible assets of EUR 43 million.
Vesper Medical Inc. (Vesper) was the most notable acquisition and is discussed below. The remaining two acquisitions involved aggregated net cash outflow of EUR 139 million. Including final purchase price adjustments processed in the course of 2023, the company recognized contingent consideration of EUR 61 million measured at fair value, aggregated Goodwill of EUR 130 million, Other intangible assets of EUR 95 million and Deferred tax liabilities of EUR 23 million.
Since the respective acquisition dates through December 31, 2022, the contribution to sales to third parties and net income of the three acquired entities was not material. The sales and net income of the combined entities would not differ materially from these amounts if the acquisition date had been January 1, 2022. Acquisition-related costs were not material.
On January 11, 2022, Philips acquired all shares of Vesper for an amount of EUR 227 million in cash and EUR 34 million contingent consideration at fair value. Vesper, headquartered in Wayne, Pennsylvania, US, is a medical technology company that develops minimally-invasive peripheral vascular devices. The company is developing the Vesper DUO Venous Stent System®, commercialization of which is estimated to start after approval by the US Food and Drug Administration (FDA), expected in 2024. The Vesper DUO Venous Stent System® consists of venous stents intended to treat deep venous obstruction. It provides physicians with a modular portfolio to customize therapy, restore venous flow, and resolve the painful symptoms of deep venous disease for the broad range of patients suffering from chronic venous insufficiency. As of the acquisition date, Vesper forms part of the Image-Guided Therapy business portfolio of the Diagnosis & Treatment segment.
The condensed opening balance sheet of Vesper was as follows:
Opening balance sheet
in millions of EUR
| At acquisition date | |
|---|---|
| Vesper Medical Inc, | |
| Assets | |
| Intangible assets excluding goodwill | 84 |
| Deferred tax assets | 15 |
| Cash | 7 |
| Total Assets | 106 |
| Liabilities | |
| Accounts payable and other payables | (1) |
| Deferred tax liabilities | (20) |
| Total Liabilities | (21) |
| Total identifiable net assets at fair value | 85 |
| Goodwill arising on acquisition | 177 |
| Total purchase consideration | 262 |
| Of which: | |
| Purchase consideration transferred | 227 |
| Contingent consideration | 34 |
Goodwill recognized in the amount of EUR 177 million mainly represents revenue synergies expected from the combination of Philips’ peripheral vascular portfolio and Vesper's venous stenting solution to address the root cause of chronic deep venous disease (DVD). Strong clinical synergies between Vesper’s innovative stenting solution and Philips' existing peripheral vascular offering will help to better support clinicians to decide, guide, treat and confirm during the procedure, thereby enhancing patient care. Vesper goodwill is not tax-deductible.
The majority of the intangible assets balance relates to capitalized development costs, the fair value of which is determined using the multi-period excess earnings method, which is a valuation technique that estimates the fair value of an asset based on market participants’ expectations of the cash flows associated with that asset over its remaining useful life. The fair value of capitalized development costs is based on an estimate of positive future cash flows associated with incremental profits related to excess earnings, discounted at a rate of 12.0%. Capitalized development costs are tested for impairment on an annual basis until FDA approval is obtained and the asset is reclassified to an intangible asset that is depreciated over its economical useful life.
The contingent consideration arrangement requires Philips to pay the former owners of Vesper up to a maximum undiscounted amount of EUR 44 million contingent upon FDA approval of the Vesper DUO Venous Stent System. The fair value of the contingent consideration arrangement of EUR 34 million has been estimated by calculating the present value of the future expected cash flows. The estimate is based on a discount rate of 12% and assumed probability adjusted likelihood of FDA approval at a certain point in time.
During 2022 Philips completed two divestments that were not material.
Associates are all entities over which the company has significant influence, but not control or joint control. Significant influence is presumed with a shareholding of between 20% and 50% of the voting rights.
Investments in associates are accounted for using the equity method of accounting and are initially recognized at cost. The carrying amount of an investment in associate includes the carrying amount of goodwill identified on acquisition. An impairment loss on such investment is allocated to the investment as a whole.
The company’s share of the net income of these associates is included in Investments in associates, net of income taxes, in the Consolidated statements of income, after adjustments to align the accounting policies with those of the company. Dilution gains and losses arising from investments in associates are recognized in the Consolidated statements of income as part of Investments in associates, net of income taxes. Impairment losses and gains or losses on sale of investments are recorded in the Consolidated statements of income, more specifically on the line item ’Investments in associates, net of income taxes’.
When the company’s share of losses exceeds its interest in an associate, the carrying amount of that interest is reduced to zero and recognition of further losses is discontinued except to the extent that the company has an obligation or made payments on behalf of the associate.
The nature of the company’s interests in its consolidated entities and associates, and the effects of those interests on the company’s financial position and financial performance are discussed below.
Below is a list of material subsidiaries as of December 31, 2023 representing greater than 5% of either the consolidated group Sales, Income from operations or Income from continuing operations (before any intra-group eliminations) of Group legal entities. All of the entities are fully consolidated in the Group financial statements.
Philips Group
Interests in group companies
in alphabetical order by country
2023
| Legal entity name | Principal country of business |
| Philips (China) Investment Company, Ltd. | China |
| Philips Medizin Systeme Böblingen GmbH | Germany1) |
| Philips Japan, Ltd. | Japan |
| Philips Consumer Lifestyle B.V. | Netherlands |
| Philips Medical Systems (Cleveland), Inc. | United States |
| ATL International LLC | United States |
| Philips North America LLC | United States |
| Philips RS North America LLC | United States |
As of December 31, 2023, four consolidated subsidiaries are not wholly owned by Philips (December 31, 2022: four). In 2023, Sales to third parties and Net income for these subsidiaries in aggregate are EUR 492 million (December 31, 2022: EUR 472 million) and EUR 27 million (December 31, 2022: EUR 28 million), respectively.
Philips has investments in a number of associates. During 2023, Philips made two investments in associates for a total amount of EUR 3 million.
Due to the loss of significant influence in Candid Care during 2023, Philips reclassified the investment to Other non-current financial asset at FVTOCI (Level 3). On reclassification Philips recorded a loss of EUR 23 million in Other business expenses. For more information about Other non-current financial asset at FVTOCI, refer to Other financial assets and Fair value of financial assets and liabilities.
In 2023, Philips recorded its share in negative results of associates of EUR 51 million and impairment of EUR 58 million. The impairment losses mainly related to HALO Dx (EUR 33 million) and were recorded within the Investments in associates, net of income taxes line item.
Cumulative translation adjustments related to investments in associates were EUR (21) million as of December 31, 2023 (2022: EUR (22) million).
Philips founded three Philips Medical Capital (PMC) entities, in the US, France and Germany, in which Philips holds a minority interest. Philips Medical Capital, LLC in the US is the most significant entity. PMC entities provide healthcare equipment financing and leasing services to Philips customers for diagnostic imaging equipment, patient monitoring equipment, and clinical IT systems.
The company concluded that it does not control, and therefore should not consolidate the PMC entities. In the US, PMC operates as a subsidiary of De Lage Landen Financial Services, Inc. The same structure and treatment is applied to the PMC entities in the other countries, with other majority shareholders. Operating agreements are in place for all PMC entities, whereby acceptance of sales and financing transactions resides with the respective majority shareholder. After acceptance of a transaction by PMC, Philips transfers control and does not retain any obligations towards PMC or its customers, from the sales contracts.
As of December 31, 2023, Philips’ shareholding in Philips Medical Capital, LLC had a carrying value of EUR 27 million (December 31, 2022: EUR 29 million).
The company does not have any material exposures to losses from interests in unconsolidated structured entities other than the invested amounts.
The company recognizes revenue when it transfers control over a good or service to a customer, in an amount that reflects the consideration (i.e., transaction price) to which the company expects to be entitled to in exchange for the good or service. The consideration expected by the company may include fixed and/or variable amounts which can be impacted by sales returns, trade discounts and volume rebates. The company adjusts the consideration for the time value of money if the period between the transfer of the promised goods or services to the customer and payment by the customer exceeds six months.
Transfer of control varies depending on the individual terms of the contract of sale. For consumer-type products in the Personal Health segment, control is transferred when the product is shipped and delivered to the customer and title and risk have passed to the customer (depending on the delivery conditions) and acceptance of the product has been obtained.
Revenues from transactions relating to distinct goods or services are accounted for separately based on their relative stand-alone selling prices. The stand-alone selling price is the price that would be charged for the goods or service in a separate transaction under similar conditions to similar customers. The transaction price is determined (considering variable considerations) and allocated to performance obligations based on their relative stand-alone selling prices. These transactions mainly occur in the segments Diagnosis & Treatment and Connected Care and include arrangements that require subsequent installation and training activities to make distinct goods operable for the customer. As such, the related installation and training activities are part of equipment sales rather than separate performance obligations. Revenue is recognized when the performance obligation is satisfied, i.e., when the installation has been completed and the equipment is ready to be used by the customer in the way contractually agreed.
Variable consideration is included in the transaction price to the extent that it is highly probable that a significant reversal in the amount of cumulative revenue recognized will not occur once associated uncertainties are resolved. Such assessment is performed on each reporting date to check whether it is constrained. For products for which a right of return exists during a defined period, revenue recognition is determined based on the historical pattern of actual returns, or in cases where such information is not available, revenue recognition is postponed until the return period has lapsed. Return policies are typically based on customary return arrangements in local markets. A provision is recognized for assurance-type product warranty at the time of revenue recognition and reflects the estimated costs of replacement and free-of-charge services that will be incurred by the company with respect to the products sold. For certain products, the customer has the option to purchase the warranty separately, which is considered a separate performance obligation on top of the assurance-type product warranty. For such warranties which provide distinct service, revenue recognition occurs on a straight-line basis over the extended warranty contract period. Occasionally, the company may offer a full or partial refund of consideration previously paid, for example as part of the resolution to warranty related matters. In such instances, a provision is recognized for the amounts expected to be refunded to customers, and remeasured at each reporting date to reflect changes in the estimated refunds, with a corresponding adjustment to revenue.
In the case of loss under a sales agreement, the loss is recognized immediately.
Revenues are recognized at a point in time when control of the goods passes to the buyer, based on the allocation of the transaction price to the performance obligation.
Revenues are recognized over time as the company transfers control of the services to the customer which is demonstrated by the customer simultaneously receiving and consuming the benefits provided by the company. The amount of revenues is measured by reference to the progress made towards complete satisfaction of the performance obligation, which in general is evenly over time. Service revenue related to repair and maintenance activities for goods sold is recognized ratably over the service period or as services are rendered.
Royalty income from brand license arrangements and from intellectual property rights, such as technology licenses or patents, is recognized on an accrual basis in accordance with the substance of the relevant agreement.
Expenses incurred for shipping and handling are mainly recorded as cost of sales. When shipping and handling are part of a project and billed to the customer, then the related expenses are recorded as cost of sales. Shipping and handling related to sales to third parties are partly recorded as selling expenses. When shipping and handling billed to customers are considered a distinct and separate performance obligation, the fees are recognized as revenue and costs included in cost of sales.
Other business income (expenses) includes gains and losses on the sale of property, plant and equipment, gains and losses on the sale of businesses as well as other gains and losses not related to the company’s operating activities.
Grants from governments are recognized at their fair value when there is a reasonable assurance that the grant will be received and the company will comply with the conditions. Grants related to costs are deferred in the consolidated balance sheet and recognized in the consolidated statement of income as a reduction of the related costs that they are intended to compensate. Grants related to assets are deducted from the cost of the asset and presented net in the consolidated balance sheets.
The company has sales promotions-related agreements with distributors and retailers designed to promote the sale of products. Among the programs are arrangements under which rebates and discounts can be earned by the distributors and retailers by attaining agreed upon sales levels, or for participating in specific marketing programs. Management estimates the sales-related accruals associated with these arrangements based on a combination of historical patterns and future expectations regarding which promotional targets are expected to be met by distributors and retailers. Accrued customer rebates are presented as other current liabilities, unless there is a right to offset against the respective accounts receivable.
A breakdown by nature of the income (loss) from operations is as follows:
Philips Group
Sales and costs by nature
in millions of EUR
| 2021 | 2022 | 2023 | |
|---|---|---|---|
| Sales | 17,156 | 17,827 | 18,169 |
| Costs of materials used | (4,142) | (4,320) | (4,626) |
| Employee benefit expenses | (6,246) | (6,952) | (6,903) |
| Depreciation and amortization1) | (1,323) | (1,602) | (1,261) |
| Impairment of goodwill | (15) | (1,357) | (8) |
| Shipping and handling | (645) | (756) | (668) |
| Advertising and promotion | (752) | (739) | (700) |
| Lease expenses | (19) | (39) | (51) |
| Other operational costs | (3,524) | (3,609) | (3,535) |
| Other business income (expenses) | 63 | 18 | (533) |
| Income from operations | 553 | (1,529) | (115) |
For information related to sales on a segment and geographical basis, refer to Information by segment and main country.
Philips Group
Sales composition
in millions of EUR
| 2021 | 2022 | 2023 | |
|---|---|---|---|
| Goods | 11,981 | 12,139 | 12,419 |
| Services | 4,374 | 4,878 | 4,926 |
| Royalties | 383 | 419 | 434 |
| Total sales from contracts with customers | 16,738 | 17,435 | 17,779 |
| Sales from other sources | 418 | 391 | 390 |
| Total sales | 17,156 | 17,827 | 18,169 |
Sales of goods include provisions of EUR 174 million that were recognized as a reduction of sales, primarily for (partial) refunds to customers in connection with the proposed Respironics consent decree. Refer to Provisions.
Total sales from other sources mainly relates to operating leases EUR 234 million (2022: EUR 258 million 2021: EUR 293 million). Sales represent revenue from external customers.
As of December 31, 2023, the aggregate amount of the transaction price allocated to remaining performance obligations from a sale of goods and services was EUR 15,571 million. The company expects to recognize approximately 47% of the remaining performance obligations within 1 year. Revenue expected to be recognized beyond 1 year is mostly related to longer term customer service and software contracts.
Sales over time represent services and Other also includes royalties over time (2023: EUR 283 million 2022: EUR 292 million 2021: EUR 220 million).
Sales per geographic area are reported based on country of destination.
Philips Group
Disaggregation of Sales per segment
in millions of EUR
| 2023 | |||||
|---|---|---|---|---|---|
| Sales at a point in time | Sales over time | Total sales from contracts with customers | Sales from other sources | Total sales | |
| Diagnosis & Treatment | 5,762 | 2,978 | 8,742 | 76 | 8,818 |
| Connected Care | 2,970 | 1,854 | 4,824 | 314 | 5,138 |
| Personal Health | 3,586 | 16 | 3,602 | 3,602 | |
| Other | 251 | 361 | 612 | - | 612 |
| Philips Group | 12,569 | 5,210 | 17,779 | 390 | 18,169 |
Philips Group
Disaggregation of Sales per segment
in millions of EUR
| 2022 | |||||
|---|---|---|---|---|---|
| Sales at a point in time | Sales over time | Total sales from contracts with customers | Sales from other sources | Total sales | |
| Diagnosis & Treatment | 5,285 | 2,950 | 8,234 | 55 | 8,290 |
| Connected Care | 3,079 | 1,853 | 4,932 | 336 | 5,268 |
| Personal Health | 3,615 | 11 | 3,626 | 3,626 | |
| Other | 284 | 357 | 643 | - | 643 |
| Philips Group | 12,263 | 5,172 | 17,435 | 391 | 17,827 |
Philips Group
Disaggregation of Sales per segment
in millions of EUR
| 2021 | |||||
|---|---|---|---|---|---|
| Sales at a point in time | Sales over time | Total sales from contracts with customers | Sales from other sources | Total sales | |
| Diagnosis & Treatment | 5,120 | 2,656 | 7,776 | 50 | 7,825 |
| Connected Care | 3,399 | 1,604 | 5,002 | 369 | 5,371 |
| Personal Health | 3,423 | 6 | 3,429 | 3,429 | |
| Other | 200 | 330 | 530 | - | 530 |
| Philips Group | 12,142 | 4,596 | 16,738 | 418 | 17,156 |
Philips Group
Disaggregation of Sales per geographic area
in millions of EUR
| 2023 | |||||
|---|---|---|---|---|---|
| Sales at a point in time | Sales over time | Total sales from contracts with customers | Sales from other sources | Total sales | |
| Western Europe | 2,552 | 1,221 | 3,770 | 49 | 3,819 |
| North America | 4,859 | 2,608 | 7,470 | 92 | 7,562 |
| Other mature geographies | 980 | 398 | 1,378 | 248 | 1,626 |
| Mature geographies | 8,392 | 4,227 | 12,618 | 389 | 13,007 |
| Growth geographies | 4,177 | 984 | 5,161 | 1 | 5,162 |
| Sales | 12,569 | 5,210 | 17,779 | 390 | 18,169 |
Philips Group
Disaggregation of Sales per geographic area
in millions of EUR
| 2022 | |||||
|---|---|---|---|---|---|
| Sales at a point in time | Sales over time | Total sales from contracts with customers | Sales from other sources | Total sales | |
| Western Europe | 2,387 | 1,183 | 3,572 | 31 | 3,603 |
| North America | 4,889 | 2,612 | 7,502 | 86 | 7,588 |
| Other mature geographies | 972 | 399 | 1,369 | 274 | 1,643 |
| Mature geographies | 8,248 | 4,194 | 12,443 | 390 | 12,833 |
| Growth geographies | 4,015 | 978 | 4,992 | 1 | 4,993 |
| Sales | 12,263 | 5,172 | 17,435 | 391 | 17,827 |
Philips Group
Disaggregation of Sales per geographic area
in millions of EUR
| 2021 | |||||
|---|---|---|---|---|---|
| Sales at a point in time | Sales over time | Total sales from contracts with customers | Sales from other sources | Total sales | |
| Western Europe | 2,537 | 1,087 | 3,624 | 21 | 3,645 |
| North America | 4,427 | 2,268 | 6,695 | 86 | 6,781 |
| Other mature geographies | 1,000 | 386 | 1,386 | 309 | 1,694 |
| Mature geographies | 7,964 | 3,741 | 11,705 | 415 | 12,120 |
| Growth geographies | 4,178 | 856 | 5,033 | 3 | 5,036 |
| Sales | 12,142 | 4,596 | 16,738 | 418 | 17,156 |
Cost of materials used represents the inventory recognized in cost of sales.
Philips Group
Employee benefit expenses
in millions of EUR
| 2021 | 2022 | 2023 | |
|---|---|---|---|
| Salaries and wages excluding share-based compensation | 5,014 | 5,594 | 5,635 |
| Share-based compensation | 115 | 104 | 97 |
| Post-employment benefit costs | 396 | 439 | 402 |
| Other social security and similar charges: | |||
| Required by law | 529 | 590 | 567 |
| Voluntary | 192 | 225 | 202 |
| Employee benefit expenses | 6,246 | 6,952 | 6,903 |
The employee benefit expenses relate to employees who are working on the payroll of Philips, both with permanent and temporary contracts.
For further information on post-employment benefit costs, refer to Post-employment benefits.
For details on the remuneration of the members of the Board of Management and the Supervisory Board, refer to Information on remuneration.
The average number (full-time equivalents, or FTEs) of employees by category is summarized as follows:
Philips Group
Employees by category
in FTEs
| 2021 | 2022 | 2023 | |
|---|---|---|---|
| Production | 38,618 | 39,742 | 35,281 |
| Research & development | 10,751 | 11,690 | 10,833 |
| Other | 22,543 | 23,019 | 23,001 |
| Employees | 71,912 | 74,451 | 69,115 |
| Third party workers | 4,533 | 4,086 | 3,149 |
| Philips Group | 76,445 | 78,538 | 72,264 |
Employees consist of those persons working on the payroll of Philips and whose costs are reflected in employee benefit expenses. Other consists of employees in commercial, general and administrative functions. Third party workers consist of personnel hired on a per-period basis, via external companies.
Philips Group
Employees by geographical location
in FTEs
| 2021 | 2022 | 2023 | |
|---|---|---|---|
| Netherlands | 11,142 | 11,180 | 9,794 |
| Other countries | 65,303 | 67,357 | 62,471 |
| Philips Group | 76,445 | 78,538 | 72,264 |
Depreciation of property, plant and equipment and amortization of intangible assets, including impairments, are as follows:
Philips Group
Depreciation and amortization1)
in millions of EUR
| 2021 | 2022 | 2023 | |
|---|---|---|---|
| Depreciation of property, plant and equipment | 630 | 711 | 689 |
| Amortization of software | 88 | 117 | 98 |
| Amortization of other intangible assets | 322 | 363 | 290 |
| Amortization of development costs | 284 | 411 | 184 |
| Depreciation and amortization | 1,323 | 1,602 | 1,261 |
Depreciation of property, plant and equipment is mainly included in cost of sales. Amortization of software is mainly included in general and administration expenses. Amortization of other intangible assets is included in selling expenses for brand names and customer relationships and is included in cost of sales for technology based and other intangible assets. Amortization of development costs is included in research and development expenses.
In 2023 a goodwill charge of EUR 8 million was recorded for the partial impairment of goodwill allocated to a business that was classified as held-for-sale as of December 31, 2023. During 2022, EUR 1,331 million of goodwill impairment charges were recorded in the Sleep & Respiratory Care business, due to revisions to the expected future cash flows. In addition, a EUR 27 million goodwill impairment was recognized in the Precision Diagnosis Solutions business. For further information refer to Goodwill.
Shipping and handling costs are included in cost of sales and selling expenses in the Consolidated statements of income.
Advertising and promotion costs are included in selling expenses in the Consolidated statements of income.
Lease expense relates to short-term and low value leases.
Other operational costs contain items which are dissimilar in nature and individually insignificant in amount to disclose separately. These costs contain among others expenses for outsourcing services, mainly in Information Technology and Human Resources, third party workers, consultants, warranty, patents, costs for travelling and external legal service. Government grants of EUR 95 million were recognized as cost reduction in 2023 (2022: EUR 103 million 2021: EUR 104 million). The grants mainly relate to research and development activities and business development.
The following table shows the fees attributable to the fiscal years 2021, 2022 and 2023 for services rendered by the external auditors.
Philips Group
Audit and audit-related fees
in millions of EUR
| 2021 | 2022 | 2023 | |||||||
|---|---|---|---|---|---|---|---|---|---|
| EY NL1) | EY Network | Total | EY NL1) | EY Network | Total | EY NL1) | EY Network | Total | |
| Audit fees | 10.3 | 5.4 | 15.7 | 9.5 | 5.6 | 15.2 | 9.7 | 5.1 | 14.7 |
| consolidated financial statements | 10.3 | 2.7 | 13.0 | 9.5 | 3.1 | 12.6 | 9.7 | 2.6 | 12.3 |
| statutory financial statements | 2.7 | 2.7 | 2.5 | 2.5 | 2.5 | 2.5 | |||
| Audit-related fees2) | 0.6 | 0.3 | 0.9 | 0.8 | 0.2 | 1.0 | 0.9 | 0.2 | 1.0 |
| divestment | |||||||||
| sustainability assurance | 0.5 | 0.5 | 0.6 | 0.6 | 0.8 | 0.8 | |||
| other | 0.1 | 0.3 | 0.4 | 0.1 | 0.2 | 0.3 | 0.1 | 0.2 | 0.3 |
| Tax fees | - | - | |||||||
| All other fees | |||||||||
| Fees | 10.9 | 5.7 | 16.6 | 10.3 | 5.8 | 16.2 | 10.6 | 5.2 | 15.8 |
Other business income (expenses) consists of the following:
Philips Group
Other business income (expenses)
in millions of EUR
| 2021 | 2022 | 2023 | |
|---|---|---|---|
| Result on disposal of businesses: | |||
| income | - | 4 | 50 |
| expenses | (75) | - | - |
| Result on disposal of fixed assets: | |||
| income | 24 | 3 | 12 |
| expenses | (5) | (1) | (1) |
| Result on other remaining businesses: | |||
| income | 161 | 121 | 49 |
| expenses | (43) | (109) | (643) |
| Other business income (expenses) | 63 | 18 | (533) |
| Total other business income | 186 | 127 | 112 |
| Total other business expenses | (123) | (109) | (645) |
The result on disposal of businesses mainly relates to divestment of non-strategic businesses. For more information refer to Acquisitions and divestments.
The result on disposal of fixed assets mainly relates to the sale of real estate assets.
The result on other remaining businesses mainly relates to the revaluation of contingent consideration and various legal matters. In 2023 Philips Respironics recorded a EUR 575 million provision in connection with the anticipated resolution of the economic loss class action. For more information on contingent consideration, refer to Provisions.
In 2023 a loss of EUR 23 million related to a minority participation was recognized in Other business expenses. For more information refer to Interests in entities.
Financial income and expenses are recognized on the accrual basis in the consolidated statements of income. Interest income and expense are measured using the effective interest method. Dividend income is recognized in the consolidated statements of income on the date that the company’s right to receive payment is established, which in the case of quoted securities is normally the ex-dividend date.
Philips Group
Financial income and expenses
in millions of EUR
| 2021 | 2022 | 2023 | |
|---|---|---|---|
| Interest income | 18 | 25 | 46 |
| Interest income from loans and receivables | 7 | 7 | 13 |
| Interest income from cash and cash equivalents | 11 | 18 | 33 |
| Dividend income from financial assets | 2 | 3 | 2 |
| Net gains from disposal of financial assets | - | - | - |
| Net change in fair value of financial assets through profit or loss | 95 | 9 | |
| Other financial income | 33 | 20 | 15 |
| Financial income | 149 | 58 | 63 |
| Interest expense | (159) | (235) | (277) |
| Interest expense on debt and borrowings | (126) | (200) | (229) |
| Finance charges under lease contract | (25) | (25) | (27) |
| Interest expense on pensions | (8) | (10) | (21) |
| Provision-related accretion expenses | (5) | (9) | (29) |
| Net foreign exchange gains (losses) | - | 9 | (23) |
| Net change in fair value of financial assets through profit or loss | (26) | ||
| Other financial expenses | (24) | (24) | (21) |
| Financial expenses | (188) | (258) | (376) |
| Financial income and expenses, net | (39) | (200) | (314) |
In 2023, financial income and expenses, net increased by EUR 114 million year-on-year, mainly due to fair value losses and net foreign exchange losses in 2023, compared to gains in 2022. The fair value losses mainly relate to power purchase agreements for renewable energy, limited-life funds (mainly Gilde Healthcare) and other investments recognized at fair value through profit and loss. Furthermore, provision-related accretion expenses and net interest expense were higher in 2023 compared to 2022. Net interest expense in 2023 was EUR 21 million higher than in 2022, mainly due the issuance of new debt in 2022 and 2023 and the impact of increasing interest rates.
In 2022, Financial income and expenses increased by EUR 161 million year-on-year, mainly due to higher interest expense and lower fair value gains. The lower fair value gains compared to 2021 are mainly from investments in limited-life funds (mainly Gilde Healthcare) and other investments recognized at fair value through profit or loss. Net interest expense in 2022 was EUR 69 million higher than in 2021, mainly due to the financial charges related to early redemption of EUR and USD bonds and the issuance of new EUR bonds in 2022. The decrease in 2022 compared to 2021 in other financial income is mainly due to higher interest income on tax in 2021.
Income taxes comprise of current, non-current and deferred tax. Income tax is recognized in the Consolidated statements of income except to the extent that it relates to items recognized directly within equity or in other comprehensive income. Current tax is the expected taxes payable on the taxable income for the year, using tax rates enacted or substantively enacted at the reporting date, and any adjustment to tax payable in respect of previous years.
In cases where it is concluded it is not probable that tax authorities will accept a tax treatment, the effect of the uncertainty is reflected in the recognition and measurement of tax assets and liabilities or, alternatively, a provision is made for the amount that is expected to be settled, where this can be reasonably estimated. This assessment relies on estimates and assumptions and may involve a series of judgments about future events. New information may become available that causes the company to change its judgment regarding the adequacy of existing tax assets and liabilities. Such changes to tax assets and liabilities will impact the income tax expense in the period during which such a determination is made.
Deferred tax assets and liabilities are recognized, using the consolidated balance sheet method, for the expected tax consequences of temporary differences between the carrying amounts of assets and liabilities and the amounts used for taxation purposes. Deferred tax is not recognized for the following temporary differences: (a) the initial recognition of goodwill; or (b) the initial recognition of an asset or liability in a transaction which: (i) is not a business combination, (ii) at the time of transaction, affects neither accounting profit nor taxable profit (tax loss), (iii) at the time of the transaction, does not give rise to equal amounts of taxable and deductible differences; or (c) differences relating to investments in subsidiaries, joint ventures and associates where the reversal of the respective temporary difference can be controlled by the company and it is probable that it will not reverse in the foreseeable future. Deferred taxes are measured at the tax rates that are expected to be applied to temporary differences when they reverse, based on the laws that have been enacted or substantively enacted by the reporting date. Deferred tax assets and liabilities are offset if there is a legally enforceable right to offset current tax liabilities and assets, and they relate to income taxes levied by the same tax authority on the same taxable entity or on different taxable entities, but the company intends to settle current tax liabilities and assets on a net basis or their tax assets and liabilities will be realized simultaneously.
A deferred tax asset is recognized for unused tax losses, tax credits and deductible temporary differences to the extent that it is probable that there will be future taxable profits against which they can be utilized. The ultimate realization of deferred tax assets is dependent upon the generation of future taxable income in the countries where the deferred tax assets originated and during the periods when the deferred tax assets become deductible. Management considers the scheduled reversal of deferred tax liabilities, projected future taxable income and tax planning strategies in making this assessment.
Deferred tax liabilities for withholding taxes are recognized for subsidiaries in situations where the income is to be paid out as dividend in the foreseeable future and for undistributed earnings of unconsolidated companies to the extent that these withholding taxes are not expected to be refundable or deductible. Changes in tax rates and tax laws are reflected in the period when the change was enacted or substantively enacted by the reporting date.
Any subsequent adjustment to a tax asset or liability that originated in discontinued operations and for which no specific arrangements were made at the time of divestment, due to a change in the tax base or its measurement, is allocated to discontinued operations (i.e. backwards tracing). Examples are a tax rate change or change in retained assets or liabilities directly relating to the discontinued operation. Any subsequent change to the recognition of deferred tax assets is allocated to the component in which the taxable gain is or will be recognized. The above principles are applied to the extent the ‘discontinued operations’ are sufficiently separable from continuing operations.
Consistent with the IAS 12 amendment regarding Pillar Two taxation as issued by the IASB and adopted by the EU, Philips does not recognize and disclose deferred taxes arising from tax laws that implement Pillar Two model rules published by the Organisation for Economic Co-operation and Development. Furthermore, Philips will recognize and disclose the impact (if any) from Pillar Two income taxes on current tax effective from 2024.
Deferred tax assets are recognized to the extent that it is probable that there will be future taxable profits against which these can be utilized. Significant judgment is involved in determining whether such profits are probable. Management determines this on the basis of expected taxable profits arising from the reversal of recognized deferred tax liabilities, appropriate tax planning opportunities to support business goals and on the basis of forecasts.
Uncertain tax positions are recognized as liabilities if and to the extent it is probable that additional tax will be due and the amount can be reliably measured. Significant judgment is involved in determining these positions.
The income tax benefit of continuing operations amounts to EUR 73 million (2022: EUR 113 million tax benefit, 2021: EUR 103 million tax benefit).
The components of income before taxes and income tax expense are as follows:
Philips Group
Income tax expense
in millions of EUR
| 2021 | 2022 | 2023 | |
|---|---|---|---|
| Income before taxes | 509 | (1,731) | (526) |
| Investments in associates, net of income taxes | (4) | (2) | (98) |
| Income before taxes and Investment in associates | 513 | (1,729) | (429) |
| Current tax (expense) benefit | (298) | (97) | (201) |
| Deferred tax (expense) benefit | 401 | 210 | 274 |
| Income tax (expense) benefit of continuing operations | 103 | 113 | 73 |
Income tax benefit of continuing operations excludes the tax benefit of the discontinued operations of EUR 9 million (2022: EUR 18 million benefit, 2021: EUR 737 million expense), mainly related to the release of provisions.
The components of income tax expense of continuing operations are as follows:
Philips Group
Current income tax expense
in millions of EUR
| 2021 | 2022 | 2023 | |
|---|---|---|---|
| Current year tax (expense) benefit | (291) | (111) | (211) |
| Prior year tax (expense) benefit | (7) | 14 | 10 |
| Current tax (expense) benefit | (298) | (97) | (201) |
Philips Group
Deferred income tax expense
In millions of EUR
| 2021 | 2022 | 2023 | ||
|---|---|---|---|---|
| Recognition of previously unrecognized tax loss and credit carryforwards | 138 | 2 | 72 | |
| Unrecognized tax loss and credit carryforwards | (10) | (13) | (41) | |
| Changes to recognition of temporary differences | (1) | (4) | (112) | |
| Prior year tax (expense) benefit | 20 | (1) | (2) | |
| Tax rate changes | 10 | (18) | 4 | |
| Origination and reversal of temporary differences, tax losses and tax credits | 245 | 244 | 353 | |
| Deferred tax (expense) benefit | 401 | 210 | 274 |
Philips’ operations are subject to income taxes in various foreign jurisdictions. The statutory income tax rate varies per country, which results in a difference between the weighted average statutory income tax rate and the Netherlands’ statutory income tax rate of 25.8% (2022: 25.8% 2021: 25.0%).
A reconciliation of the weighted average statutory income tax rate to the effective income tax rate of continuing operations is as follows:
Philips Group
Effective income tax rate
in %
| 2021 | 2022 | 2023 | |
|---|---|---|---|
| Weighted average statutory income tax rate in % | 22.7 | 23.6 | 22.0 |
| Recognition of previously unrecognized tax loss and credit carryforwards | (26.9) | 0.1 | 16.8 |
| Unrecognized tax loss and credit carryforwards | 1.9 | (0.7) | (9.6) |
| Changes to recognition of temporary differences | 0.3 | (0.2) | (26.2) |
| Non-taxable income and tax incentives | (40.6) | 5.8 | 22.8 |
| Non-deductible expenses | 19.3 | (22.9) | (10.7) |
| Withholding and other taxes | 7.2 | (1.4) | (5.1) |
| Tax rate changes | (1.9) | (1.0) | 0.9 |
| Prior year tax | (2.4) | 0.7 | 1.9 |
| Tax expense (benefit) due to change in uncertain tax treatments | 4.4 | 2.8 | 2.3 |
| Others, net | (4.0) | (0.2) | 1.9 |
| Effective income tax rate | (20.0) | 6.5 | 17.0 |
The effective income tax rate is lower than the weighted average statutory income tax rate in 2023 mainly due to the recognition of previously unrecognized tax loss and credit carryforwards, which is mainly related to a one-off recognition of tax credits and non-taxable income and tax incentives which includes recurring favorable tax incentives related to R&D investments, the innovation box regime in the Netherlands and export activities. This is partly offset by the changes to recognition of temporary differences, which mostly represents deferred tax assets not fully recognized in United States.
Due to the loss position in 2023, items such as non-deductible expense lead to a decrease of the effective income tax rate and items such as tax incentives lead to an increase in the effective income tax rate.
In December 2021, the OECD released model rules to introduce a global minimum corporate income tax rate of 15% applicable to multinational enterprise groups with global revenue over EUR 750 million (“Pillar Two”). The formal adoption of Directive (EU) 2022/2523 in December 2022 aims to achieve a coordinated implementation of Pillar Two in the EU Member States. The Dutch implementation of Pillar Two, the so-called Minimum Tax Rate Act 2024 (the “MTR Act”), was enacted in December 2023 and will apply to Philips from the financial year ending December 31, 2024 and onwards. Under this legislation, Philips may be required to pay top-up taxes on profits if the related Pillar Two jurisdictional effective tax rate is less than 15%.
Philips will be affected by the “MTR Act” as well as the implementation of Pillar Two per local law in other jurisdictions and has performed an assessment of the Group’s potential exposure to the Pillar Two legislation.
This assessment indicates potential exposure from the constituent entities in Hong Kong and the United Arab Emirates, where the Pillar Two effective tax rate is below 15%. This would potentially have resulted in top-up taxes had Pillar Two legislation been effective in 2023. The assessment of the potential exposure to top-up taxes is based on the profits and tax expenses determined as part of the preparation of Philips’ consolidated financial statement, most recent tax fillings and country-by-country reporting. The Pillar Two effective tax rate is lower in these jurisdictions due to exempted income and domestic tax rates either below or close to 15%.
The group effective tax rate, had Pillar Two legislation been effective from 2023, would have been 16.4% which is 0.6% lower than the reported effective tax rate of 17% under IFRS. The decrease in the effective tax rate can be attributed to the reduction in the income tax benefit of continuing operations resulting from the inclusion of potential top-up tax exposure (expense).
Deferred tax assets are recognized for temporary differences, unused tax losses, and unused tax credits to the extent that realization of the related tax benefits is probable. The ultimate realization of deferred tax assets is dependent upon the generation of future taxable income in the countries where the deferred tax assets originated and during the periods when the deferred tax assets become deductible. Management considers the scheduled reversal of deferred tax liabilities, projected future taxable income, and tax planning strategies in making this assessment.
Net deferred tax assets relate to the following underlying assets and liabilities and tax loss carryforwards (including tax credit carryforwards) and their movements during the years 2023 and 2022 respectively are presented in the following tables.
The net deferred tax assets of EUR 2,556 million (2022: EUR 2,358 million) consist of deferred tax assets of EUR 2,627 million (2022: EUR 2,449 million) and deferred tax liabilities of EUR 71 million (2022: EUR 91 million). Of the total deferred tax assets of EUR 2,627 million as of December 31, 2023 (2022: EUR 2,449 million), EUR 1,676 million (2022: EUR 1,453 million) is recognized in respect of entities in various countries where there have been tax losses in the current or preceding period, primarily the United States (US). The increase is mainly related to the US where there has been a tax loss in 2023, among others due to the Philips Respironics’ business operations. Philips assessed the recoverability of the tax losses and recognized the related deferred tax asset only to the extent future tax profits are considered probable. For the recoverability assessment, the income projections were determined using similar methodology as used for goodwill impairment testing (for more information please refer to note Goodwill). The company evaluated multiple risk-adjusted scenarios which support the assumption that it is probable that the results of future operations will generate sufficient taxable income to utilize the tax losses as well the deductible temporary differences. The projections include forward-looking assumptions whereby the most recent available information was used to determine the expected period of recovery of the deferred tax assets. Relevant developments potentially impacting the period and probability of recovery will be monitored closely.
As of December 31, 2023 the temporary differences associated with investments, including potential income tax consequences on dividends, for which no deferred tax liabilities are recognized, aggregate to EUR 444 million (2022: EUR 355 million).
Philips Group
Deferred tax assets and liabilities
in millions of EUR
| Balance as of January 1, 2023 | recognized in income statement | other1) | Balance as of December 31, 2023 | Assets | Liabilities | |
|---|---|---|---|---|---|---|
| Intangible assets | 630 | 61 | (12) | 679 | 826 | (147) |
| Property, plant and equipment | (2) | 18 | (103) | (88) | 44 | (132) |
| Inventories | 464 | (26) | (78) | 360 | 363 | (2) |
| Other assets | 44 | 20 | 120 | 184 | 233 | (48) |
| Pensions and other employee benefits | 153 | 69 | (29) | 193 | 204 | (11) |
| Other liabilities | 483 | (56) | 69 | 496 | 521 | (25) |
| Deferred tax assets on tax loss carryforwards | 586 | 188 | (44) | 730 | 730 | |
| Set-off deferred tax positions | (294) | 294 | ||||
| Net deferred tax assets | 2,358 | 274 | (77) | 2,556 | 2,627 | (71) |
Philips Group
Deferred tax assets and liabilities
in millions of EUR
| Balance as of January 1, 2022 | recognized in income statement | other1) | Balance as of December 31, 2022 | Assets | Liabilities | |
|---|---|---|---|---|---|---|
| Intangible assets | 587 | 63 | (20) | 630 | 783 | (152) |
| Property, plant and equipment | 29 | (33) | 2 | (2) | 49 | (52) |
| Inventories | 372 | 75 | 17 | 464 | 473 | (8) |
| Other assets | 68 | (16) | (8) | 44 | 98 | (55) |
| Pensions and other employee benefits | 180 | 6 | (32) | 153 | 175 | (22) |
| Other liabilities | 499 | (34) | 17 | 483 | 560 | (77) |
| Deferred tax assets on tax loss carryforwards | 398 | 149 | 38 | 586 | 586 | |
| Set-off deferred tax positions | (275) | 275 | ||||
| Net deferred tax assets | 2,134 | 210 | 14 | 2,358 | 2,449 | (91) |
The company has available tax loss and credit carryforwards, which expire as follows:
Philips Group
Expiry years of net operating loss and credit carryforwards
in millions of EUR
| Total balance as of December 31, 2022 | Unrecognized balance as of December 31, 2022 | Total balance as of December 31, 2023 | Unrecognized balance as of December 31, 2023 | |
|---|---|---|---|---|
| Within 1 year | 4 | 3 | 17 | 15 |
| 1 to 2 years | 10 | 5 | 20 | 16 |
| 2 to 3 years | 9 | 3 | 7 | 2 |
| 3 to 4 years | 13 | 4 | 9 | 5 |
| 4 to 5 years | 38 | 3 | 38 | 16 |
| Later | 812 | 93 | 808 | 81 |
| Unlimited | 2,301 | 920 | 2,997 | 1,231 |
| Total | 3,187 | 1,032 | 3,896 | 1,366 |
The increase in the unrecognized balance as of December 31, 2023 is mainly explained by the US.
As of December 31, 2023, the amount of deductible temporary differences for which no deferred tax asset has been recognized in the balance sheet was EUR 125 million (2022: EUR 45 million).
Philips is exposed to tax risks and uncertainty over tax treatments. For particular tax treatments that are not expected to be accepted by tax authorities, Philips either recognizes a liability or reflects the uncertainty in the recognition and measurement of its current and deferred tax assets and tax attributes. For the measurement of the uncertainty, Philips uses the most likely amount or the expected value of the tax treatment. The expected liabilities resulting from the uncertain tax treatments are included in non-current tax liabilities (2023: EUR 390 million, 2022: EUR 435 million, decrease due to release of liabilities, in combination with higher tax losses or similar tax carryforwards that can be used if uncertain tax treatments were settled for the presumed amount at balance sheet date). The positions include, among others, the following:
Philips has issued transfer pricing directives, which are in accordance with international guidelines such as those of the Organization of Economic Co-operation and Development. In order to reduce the transfer pricing uncertainties, monitoring procedures are carried out by Group Tax to safeguard the correct implementation of the transfer pricing directives. However, tax disputes can arise due to inconsistent transfer pricing regimes and different views on "at arm's length" pricing.
Due to the centralization of certain activities (such as research and development, IT and group functions), costs are also centralized. As a consequence, these costs and/or revenues must be allocated to the beneficiaries, i.e. the various Philips entities. For that purpose, service contracts such as intra-group service agreements and licensing agreements are signed with a large number of group entities. Tax authorities review these intra-group service and licensing agreements, and may reject the implemented intra-group charges. Furthermore, buy in/out situations in the case of (de)mergers could affect the cost allocation resulting from the intragroup service agreements between countries. The same applies to the specific service agreements.
When a subsidiary of Philips is disentangled, or a new company is acquired, tax risks may arise. Philips creates merger and acquisition (M&A) teams for these disentanglements or acquisitions. In addition to representatives from the involved business, these teams consist of specialists from various group functions and are formed, among other things, to identify tax risks and to reduce potential tax claims.
A permanent establishment may arise when a Philips entity has activities in another country, tax claims could arise in both countries on the same income.
The company presents basic and diluted earnings per share (EPS) data for its common shares. Basic EPS is calculated by dividing the Net income (loss) attributable to shareholders by the weighted average number of common shares outstanding (after deduction of treasury shares) during the period. Diluted EPS is determined by adjusting the Net income (loss) attributable to shareholders and the weighted average number of common shares outstanding (after deduction of treasury shares) during the period, for the effects of all dilutive potential common shares, which comprise performance shares, restricted shares and share options granted under share-based compensation plans as well as forward contracts to repurchase shares.
Philips Group
Earnings per share
in millions of EUR unless otherwise stated1)
| 2021 | 2022 | 2023 | |
|---|---|---|---|
| Income from continuing operations | 612 | (1,618) | (454) |
| Income from continuing operations attributable to shareholders | 608 | (1,622) | (456) |
| Income from continuing operations attributable to non-controlling interests | 4 | 3 | 2 |
| Income from discontinued operations | 2,711 | 13 | (10) |
| Income from discontinued operations attributable to shareholders | 2,711 | 13 | (10) |
| Net income | 3,323 | (1,605) | (463) |
| Net income attributable to shareholders | 3,319 | (1,608) | (466) |
| Net income attributable to non-controlling interests | 4 | 3 | 2 |
| Weighted average number of common shares outstanding (after deduction of treasury shares) during the period | 943,606,613 | 920,950,800 | 917,440,090 |
| Plus incremental shares from assumed conversions of: | |||
| Share options | 387,125 | 25,506 | |
| Performance shares | 2,548,891 | 1,147,790 | 2,623,097 |
| Restricted shares | 2,376,736 | 1,986,538 | 2,574,738 |
| Forward contracts to repurchase shares | 70,329 | 17,611,920 | 15,511,844 |
| Dilutive potential common shares2) | 5,383,080 | 20,771,753 | 20,709,680 |
| Diluted weighted average number of shares outstanding (after deduction of treasury shares) during the period | 948,989,692 | 920,950,800 | 917,440,090 |
| Basic earnings per common share in EUR | |||
| Income from continuing operations attributable to shareholders | 0.64 | (1.76) | (0.50) |
| Income from discontinued operations attributable to shareholders | 2.87 | 0.01 | (0.01) |
| Net income attributable to shareholders | 3.52 | (1.75) | (0.51) |
| Diluted earnings per common share in EUR2) | |||
| Income from continuing operations attributable to shareholders | 0.64 | (1.76) | (0.50) |
| Income from discontinued operations attributable to shareholders | 2.86 | 0.01 | (0.01) |
| Net income attributable to shareholders | 3.50 | (1.75) | (0.51) |
| Dividend distributed per common share in EUR | 0.85 | 0.85 | 0.85 |
On May 9, 2023, the General Meeting of Shareholders approved a dividend of EUR 0.85 per common share, in shares only. The dividend was settled in May through the issuance of 39,334,938 new common share. In accordance with IAS 33 Earnings Per Share, per share calculations have been adjusted retrospectively for all periods presented to reflect the issuance of shares for the share dividend in respect of 2022.
The cost of property, plant and equipment comprise all directly attributable costs (including the cost of material and direct labor).
Depreciation is generally calculated using the straight-line method over the useful life of the asset. Land and assets under construction are not depreciated. When assets under construction are ready for their intended use, they are transferred to the relevant asset category and depreciation starts. All other property, plant and equipment items are depreciated over their estimated useful lives to their estimated residual values.
The estimated useful lives of property, plant and equipment are as follows:
Philips Group
Useful lives of property, plant and equipment
| Buildings | from 5 to 50 years |
| Machinery and installations | from 3 to 20 years |
| Other equipment | from 1 to 10 years |
Property, plant and equipment are reviewed for impairment whenever events or changes in circumstances indicate that the book value of the assets concerned may not be recoverable. An impairment loss is recognized for the amount by which the asset's book value exceeds their recoverable amount. Impairments are reversed if and to the extent that the impairment no longer exists. The recoverable amount is defined as the higher of the asset’s fair value less costs of disposal and its value in use.
Gains and losses on the sale of property, plant and equipment are included in other business income. Costs related to repair and maintenance activities are expensed in the period in which they are incurred unless they extend the asset's original lifetime or capacity.
The company leases various items of real estate, vehicles and other equipment. The company determines whether an arrangement constitutes or contains a lease based on the substance of the arrangement at the lease inception. The arrangement constitutes or contains a lease if fulfillment is dependent on the use of a specific asset and the arrangement conveys a right to use the asset, even if that asset is not explicitly specified in the arrangement.
The company recognizes right-of-use assets and lease liabilities for leases with a term of more than twelve months if the underlying asset is not of low value. Payments for short-term and low-value leases are expensed over the lease term. Extension options are included in the lease term if their exercise is reasonably certain. Right-of-use assets are measured at cost less accumulated depreciation and impairment losses, adjusted for any remeasurements. Right-of-use assets are depreciated using the straight-line method over the shorter of the lease term and the useful life of the underlying assets.
When the company acts as a lessor, it determines at lease inception whether a lease is a finance lease or an operating lease. Leases in which the company does not transfer substantially all the risks and rewards incidental to ownership of an asset are classified as operating leases. The company recognizes lease payments received under operating leases as income on a straight-line basis over the lease term in the Consolidated statement of income.
Judgments are required, not only to determine whether there is an indication that an asset may be impaired, but also whether indications exist that impairment losses previously recognized may no longer exist or may have decreased (impairment reversal). After indications of impairment have been identified, estimates and assumptions are used in the determination of the recoverable amount of a fixed asset. These involve estimates of expected future cash flows (based on future growth rates and remaining useful life) and residual value assumptions, as well as discount rates to calculate the present value of the future cash flows.
Estimates are required to determine the (remaining) useful lives of fixed assets. Useful lives are determined based on an asset's age, the frequency of its use, repair and maintenance policy, technology changes in production and expected restructuring. The company estimates the expected residual value per asset item. The residual value is the higher of the asset's expected sales price (based on recent market transactions of similar sold items) and its material scrap value.
Judgment is required to determine the lease term. The assessment of whether the company is reasonably certain to exercise extension options impacts the lease term, which could affect the amount of lease liabilities and right-of-use assets recognized.
Property, plant and equipment are fixed assets that are owned or right-of-use assets under a lease agreement. Owned and right-of-use assets are held for use in Philips' operating activities.
Philips Group
Property, plant and equipment
in millions of EUR
| 2022 | 2023 | |
|---|---|---|
| Owned assets | 1,718 | 1,565 |
| Right-of-use assets | 919 | 919 |
| Total | 2,638 | 2,483 |
Philips Group
Property, plant and equipment - owned assets
in millions of EUR
| Land and buildings | Machinery and installations | Other equipment | Assets under construction | Total | |
|---|---|---|---|---|---|
| Balance as of January 1, 2023 | |||||
| Cost | 1,135 | 1,779 | 1,454 | 309 | 4,676 |
| Accumulated depreciation | (621) | (1,291) | (1,046) | (2,958) | |
| Book value | 514 | 488 | 408 | 309 | 1,718 |
| Additions | 1 | 115 | 77 | 239 | 433 |
| Assets available for use | 20 | 90 | 144 | (262) | (8) |
| Depreciation | (56) | (196) | (167) | (420) | |
| Impairments | (5) | (23) | (17) | - | (45) |
| Transfer (to) from AHFS | (1) | (1) | (45) | (46) | |
| Reclassifications | 15 | 2 | (17) | (5) | (6) |
| Translation differences and other | (14) | (22) | (19) | (7) | (62) |
| Total change | (39) | (35) | (45) | (35) | (154) |
| Balance as of December 31, 2023 | |||||
| Cost | 1,114 | 1,731 | 1,404 | 274 | 4,521 |
| Accumulated depreciation | (638) | (1,278) | (1,041) | (2,957) | |
| Book value | 476 | 453 | 363 | 274 | 1,565 |
Philips Group
Property, plant and equipment - right-of-use assets
in millions of EUR
| Land and buildings | Other equipment | Total | |
|---|---|---|---|
| Balance as of January 1, 2023 | |||
| Cost | 1,365 | 206 | 1,571 |
| Accumulated depreciation | (543) | (108) | (651) |
| Book value | 822 | 98 | 919 |
| Additions | 175 | 62 | 236 |
| Assets available for use | 2 | 6 | 8 |
| Depreciation | (150) | (51) | (201) |
| Impairments | (23) | - | (23) |
| Transfer (to) from AHFS | (2) | (2) | |
| Reclassifications | - | 4 | 4 |
| Translation differences and other | (18) | (5) | (23) |
| Total change | (16) | 15 | (1) |
| Balance as of December 31, 2023 | |||
| Cost | 1,425 | 216 | 1,641 |
| Accumulated depreciation | (619) | (104) | (722) |
| Book value | 806 | 112 | 919 |
Philips Group
Property, plant and equipment - owned assets
in millions of EUR
| Land and buildings | Machinery and installations | Other equipment | Assets under construction | Total | |
|---|---|---|---|---|---|
| Balance as of January 1, 2022 | |||||
| Cost | 1,097 | 1,585 | 1,382 | 208 | 4,273 |
| Accumulated depreciation | (591) | (1,074) | (967) | (2,632) | |
| Book value | 506 | 511 | 415 | 208 | 1,641 |
| Additions | 1 | 102 | 77 | 314 | 494 |
| Assets available for use | 34 | 69 | 111 | (220) | (6) |
| Depreciation | (56) | (215) | (176) | - | (447) |
| Impairments | (3) | (20) | (18) | (1) | (42) |
| Transfer (to) from AHFS | (3) | - | (3) | ||
| Reclassifications | 18 | 14 | (5) | 2 | 29 |
| Translation differences and other | 16 | 26 | 2 | 5 | 50 |
| Total change | 8 | (23) | (8) | 100 | 78 |
| Balance as of December 31, 2022 | |||||
| Cost | 1,135 | 1,779 | 1,454 | 309 | 4,676 |
| Accumulated depreciation | (621) | (1,291) | (1,046) | (2,958) | |
| Book value | 514 | 488 | 408 | 309 | 1,718 |
Philips Group
Property, plant and equipment - right-of-use assets
in millions of EUR
| Land and buildings | Machinery and installations | Other equipment | Total | |
|---|---|---|---|---|
| Balance as of January 1, 2022 | ||||
| Cost | 1,332 | 176 | 216 | 1,724 |
| Accumulated depreciation | (418) | (139) | (109) | (666) |
| Book value | 914 | 37 | 107 | 1,058 |
| Additions | 52 | - | 54 | 106 |
| Assets available for use | 5 | 1 | 6 | |
| Depreciation | (155) | (2) | (58) | (214) |
| Impairments | (8) | - | - | (9) |
| Transfer (to) from AHFS | 3 | 3 | ||
| Reclassifications | (19) | (13) | - | (32) |
| Translation differences and other | 31 | (23) | (6) | 1 |
| Total change | (92) | (37) | (9) | (139) |
| Balance as of December 31, 2022 | ||||
| Cost | 1,365 | - | 206 | 1,571 |
| Accumulated depreciation | (543) | (108) | (651) | |
| Book value | 822 | - | 98 | 919 |
Below are the references with respect to year-end disclosures as lessee:
Other qualitative and quantitative disclosures regarding the nature of lessee’s leasing activities and future lease obligations, refer to Debt.
Below are the references with respect to year-end disclosures as lessor:
The measurement of goodwill at initial recognition is described in the Acquisitions and divestments note. Goodwill is subsequently measured at cost less accumulated impairment losses.
Goodwill is not amortized but is instead tested for impairment annually in the fourth quarter, or more frequently if indicators of potential impairment exist. Internal and external sources of information are considered to assess if there are indicators that an asset or groups of cash-generating units (CGUs) may be impaired. Goodwill is allocated to groups of CGUs and tested for impairment at the business level (one level below segment), as this represents the lowest level at which goodwill is monitored for internal management purposes. An impairment loss is recognized in the Consolidated statements of income whenever and to the extent that the carrying amount of a group of CGUs exceeds the recoverable amount for the group of CGUs, whichever is the greater, its value in use or its fair value less cost of disposal. Value in use is measured as the present value of future cash flows expected to be generated by the asset. Fair value less cost of disposal is measured as the amount obtained from the sale of an asset in an arm’s length transaction, less costs of disposal.
The cash flow projections used in the value in use calculations for goodwill impairment testing contain various judgments and estimations as described in the ‘key assumptions’ section.
The changes in 2022 and 2023 were as follows:
Philips Group
Goodwill
in millions of EUR
| 2022 | 2023 | |
|---|---|---|
| Balance as of January 1 | ||
| Cost | 11,793 | 12,747 |
| Impairments | (1,156) | (2,509) |
| Book value | 10,637 | 10,238 |
| Acquisitions1) | 317 | 24 |
| Impairments | (1,357) | (8) |
| Divestments and transfers to assets classified as held for sale2) | (8) | |
| Translation differences and other | 641 | (370) |
| Total change | (399) | (362) |
| Balance as of December 31 | ||
| Cost | 12,747 | 12,133 |
| Impairments | (2,509) | (2,256) |
| Book value | 10,238 | 9,876 |
Effective from April 1, 2023, Philips implemented a simplified operating model (refer to relevant sections of General information to the Consolidated financial statements). As a result, the level at which goodwill is monitored has changed to align with the revised governance under the new operating model. Prior to April 1, 2023, goodwill was monitored at the business unit level. From April 1, 2023, goodwill impairment testing is performed at the business level (one level below segment), as this represents the lowest level at which goodwill is monitored for internal management purposes. The changes in the monitoring and management structure for recognized goodwill did not otherwise prevent recognition of an impairment that existed prior to the change, nor did it result in the recognition of an impairment charge.
For impairment testing, goodwill is allocated to groups of CGUs and tested for impairment at the business level (one level below segment level), which represents the lowest level at which the goodwill is monitored internally for management purposes. Goodwill is tested for impairment annually in the fourth quarter, or more frequently if indicators of potential impairment exist.
An impairment trigger assessment is performed on a quarterly basis to determine whether there is an indication based on either internal or external sources of information, that a group of CGUs may be impaired. During 2023, interim impairment tests were completed for the Sleep & Respiratory Care (S&RC) business mainly following revisions to the expected future cashflow assumptions regarding the estimated impact of the proposed Respironics consent decree, along with updates to expected business performance and changes to the pre-tax discount rate. The interim goodwill impairment tests did not result in an impairment.
Goodwill allocated to the businesses (groups of cash-generating units) as of December 31, 2023, is presented in the following table:
Philips Group
Goodwill by business
in millions of EUR
| 2022 | 2023 | |
|---|---|---|
| Monitoring1) | 4,110 | 3,964 |
| Image-Guided Therapy | 3,154 | 3,044 |
| Precision Diagnosis | 1,429 | 1,363 |
| Sleep & Respiratory Care | 731 | 687 |
| Personal Health | 488 | 483 |
| Enterprise Informatics | 327 | 336 |
| Book value | 10,238 | 9,876 |
The carrying amount of each group of CGUs is compared to the recoverable amount of the group of CGUs. Unless otherwise noted, the recoverable amount for each group of CGUs is based on value in use calculations. Value in use is measured as the present value of future cash flows expected to be generated from the continuing use of the assets. In the 2023 annual goodwill impairment test, these cash flow projections were determined using Royal Philips managements’ internal forecasts that cover an initial forecast period from 2024 to 2026. Projections were extrapolated using the growth rates disclosed in the following table for an extrapolation period of 4 years (2027-2030), after which a terminal value was calculated per 2031. For the terminal value calculation, growth rates were capped at a historical long-term average growth rate. The company uses scenarios in the business forecasting process and the most reasonable and supportable assumptions which represent management’s best estimate are used as the basis for the value in use calculations.
Key assumptions used in the value in use calculations were compound sales growth rates, EBITA*) in the terminal value and the rates used for discounting the projected cash flows.
The compound sales growth rate is the annualized steady nominal growth rate over the forecast period calculated with reference to the latest full year of actual sales as the base for the growth. The compound sales growth rate used to calculate terminal value is only applied to the first year after the extrapolation period, after which no further growth is assumed for the terminal value calculation.
The compound sales growth rates and EBITA*) used to estimate cash flows are based on past performance, external market growth assumptions and industry long-term growth averages. EBITA*) for each group of CGUs is expected to increase over the projection period as a result of volume growth and cost efficiencies. By their nature, these assumptions involve risk and uncertainty because they relate to future events and circumstances and there are many factors that could cause actual results and developments to differ materially from the plans, goals and expectations set forth in these assumptions.
The rates used for discounting the projected cash flows in goodwill impairment testing is based on a weighted cost of capital (WACC), which in turn is based on business-specific inputs along with other inputs as mentioned below. The WACC is based on post-tax cost of equity and cost of debt, and is further calculated based on market data and inputs to accurately capture changes to the time value of money, such as the risk-free interest rate, the beta factor and country risk premium. In order to properly reflect the different risk-profiles of different businesses, a WACC is determined for each business. As such, the beta factor is determined based on a selection of peer companies, which can differ per business. Different businesses have different geographical footprints, resulting in business-specific inputs for variables like country risk. Philips performs the value in use calculations using post-tax cashflows and discount rate, the implicit pre-tax rate discount rate is derived from an iterative calculation for disclosure purposes.
The values assigned to the key assumptions used for the value in use calculations were as follows:
Philips Group
Key assumptions
2023
| compound sales growth rate | ||||
|---|---|---|---|---|
| initial forecast period | extrapolation period | used to calculate terminal value | pre-tax discount rates | |
| Monitoring | 8.2% | 5.5% | 2.5% | 9.5% |
| Image-Guided Therapy | 7.9% | 5.2% | 2.5% | 10.7% |
| Precision Diagnosis | 3.8% | 3.4% | 2.5% | 10.4% |
| Sleep & Respiratory Care | 9.5% | 9.3% | 2.5% | 10.8% |
| Personal Health | 5.0% | 4.6% | 2.5% | 10.3% |
| Enterprise Informatics | 5.3% | 5.8% | 2.5% | 9.0% |
The assumptions used for the 2022 value in use calculations for cash-generating units to which a significant amount of goodwill was allocated were as follows:
Philips Group
Key assumptions
2022
| compound sales growth rate | ||||
|---|---|---|---|---|
| initial forecast period | extrapolation period | used to calculate terminal value | pre-tax discount rates | |
| Ambulatory Monitoring & Diagnostics1) | 15.4% | 9.5% | 2.5% | 8.5% |
| Hospital Patient Monitoring1) | 4.8% | 3.4% | 2.5% | 8.5% |
| Image-Guided Therapy | 8.7% | 5.0% | 2.5% | 10.6% |
| Sleep & Respiratory Care | 10.0% | 5.0% | 2.5% | 9.9% |
The S&RC compound sales growth rate during the extrapolation period increased from 5.0% in 2022 to 9.3% in 2023. The growth rate percentage is calculated with reference to the last year of the initial forecast period. Although the absolute forecasted sales during the extrapolation period used in 2023 decreased compared to that used in 2022, the larger decline in the forecasted sales of the respective reference year results in a higher calculated growth rate percentage compared to 2022.
Goodwill impairment charges for the years ended December 31, 2023 and 2022, were EUR 8 million and EUR 1,357 million, respectively.
The 2023 charge relates to the partial impairment of goodwill allocated to a business that was classified as held-for-sale as of December 31, 2023. At the time of classification as held-for-sale, goodwill totaling EUR 16 million was allocated from the Precision Diagnosis business to the held-for-sale business, of which EUR 8 million was subsequently impaired. For further information refer to Discontinued operations and assets classified as held for sale.
The 2022 charges relate to the impairment charge of EUR 1,331 million in the S&RC CGU within the Connected Care segment and a charge of EUR 27 million recognized in relation to the Precision Diagnosis Solutions CGU, which was formerly part of the Diagnosis & Treatment segment but is now included in the Enterprise Informatics business within the Connected Care segment.
In performing the value-in-use calculations for the S&RC CGU, it was necessary for management to make assumptions regarding the estimated impact on the business of the proposed Respironics consent decree. These assumptions include, amongst others, the expected financial impact of the scope of products, geography, and duration of the proposed consent decree, as well as expected additional costs. These assumptions were determined by management based on the proposed Respironics consent decree and other available sources of information.
The value-in-use of the S&RC CGU remains sensitive to the assumptions set out above. This means that there is a higher risk that deviations in the mentioned key assumptions could cause the recoverable amount to fall below the level of its carrying value. There continues to be uncertainty associated with the initiated voluntary recall notification in the US and field safety notice outside the US for certain sleep and respiratory care products and the impact on the business of the proposed Respironics consent decree.
Based on the annual impairment test, the estimated recoverable amount of the S&RC CGU exceeds the carrying value by EUR 326 million. It was noted that an increase of 190 basis points in the pre-tax discount rate, a 690 basis points decline in the compound sales growth rate during the extrapolation period or a 27% decrease in terminal value would, individually, cause its recoverable amount to fall to the level of its carrying value. Additionally, any significant adverse changes to the assumptions related to the expected financial impact of the proposed Respironics consent decree could cause the recoverable amount of the CGU to fall below its carrying value, resulting in impairment.
The results of the annual impairment tests of Monitoring, Image-Guided Therapy, Precision Diagnosis, Personal Health and Enterprise Informatics indicate that a reasonably possible change in key assumptions would not cause the value in use to fall to the level of the carrying value.
Acquired finite-lived intangible assets are amortized using the straight-line method over their estimated useful life. The useful lives are evaluated annually. Intangible assets are initially capitalized at cost, with the exception of intangible assets acquired as part of a business combination, which are capitalized at their acquisition date fair value.
The company expenses all research costs as incurred. Expenditure on development activities, whereby research findings are applied to a plan or design for the production of new or substantially improved products and processes, is capitalized as an intangible asset if the product or process is technically and commercially feasible, the company has sufficient resources and the intention to complete development and can measure the attributable expenditure reliably.
The capitalized development expenditure comprises of all directly attributable costs (including the cost of materials and direct labor). Other development expenditures and expenditures on research activities are recognized in the Consolidated statements of income. Capitalized development expenditure is stated at cost less accumulated amortization and impairment losses. Amortization of capitalized development expenditure is charged to the Consolidated statements of income on a straight-line basis over the estimated useful lives of the intangible assets.
The expected useful lives of the intangible assets excluding goodwill are as follows:
Philips Group
Expected useful lives of intangible assets excluding goodwill
in years
| Brand names | 2-20 |
| Customer relationships | 2-25 |
| Technology | 3-20 |
| Other | 1-10 |
| Software | 1-10 |
| Product development | 3-10 |
The weighted average expected remaining life of brand names, customer relationships, technology and other intangible assets is 9.3 years as of December 31, 2023 (2022: 9.4 years).
Intangible assets not yet ready for use are not amortized but are tested for impairment annually and whenever impairment indicators require. In the case of intangible assets not yet ready for use, either internal or external sources of information are considered to assess if there are indicators that an asset or a CGU may be impaired.
Non-financial assets other than goodwill, intangible assets not yet ready for use, inventories and deferred tax assets are reviewed for impairment whenever events or changes in circumstances indicate that the carrying amount of an asset may not be recoverable. Recoverability of assets to be held and used is assessed by a comparison of the carrying amount of an asset with the greater of its value in use and fair value less cost of disposal. Value in use is measured as the present value of future cash flows expected to be generated by the asset. Fair value less cost of disposal is measured as the amount obtained from a sale of an asset in an arm’s length transaction, less costs of disposal. If the carrying amount of an asset is deemed not recoverable, an impairment charge is recognized in the amount by which the carrying amount of the asset exceeds the recoverable amount. The review for impairment is carried out at the level where cash flows occur that are independent of other cash flows.
Impairment losses recognized in prior periods for Intangible assets other than goodwill are assessed at each reporting date for any indications that the loss has decreased or no longer exists. An impairment loss is reversed if and to the extent that there has been a change in the estimates used to determine the recoverable amount. The loss is reversed only to the extent that the asset’s carrying amount does not exceed the carrying amount that would have been determined, net of depreciation or amortization, if no impairment loss had been recognized. Reversals of impairment are recognized in the Consolidated statements of income.
The cash flow projections used in the value in use calculations for intangible assets excluding goodwill contain various judgments and estimations. For intangible assets excluding goodwill, estimates are required to determine the (remaining) useful lives.
Philips Group
Intangible assets excluding goodwill
in millions of EUR
| brand names | customer relationships | technology | product development | product development construction in progress | software | other | total | |
|---|---|---|---|---|---|---|---|---|
| Balance as of January 1, 2023 | ||||||||
| Cost | 647 | 2,735 | 2,947 | 2,605 | 648 | 869 | 152 | 10,602 |
| Amortization / impairments | (507) | (1,665) | (1,845) | (2,212) | (146) | (589) | (113) | (7,077) |
| Book value | 140 | 1,070 | 1,102 | 393 | 502 | 280 | 39 | 3,526 |
| Additions | 33 | - | 214 | 70 | - | 317 | ||
| Assets available for use | 157 | (157) | ||||||
| Acquisitions | 40 | - | - | 40 | ||||
| Amortization | (20) | (137) | (131) | (169) | (97) | (1) | (556) | |
| Impairments | - | - | - | (7) | (7) | (1) | - | (16) |
| Transfers to assets classified as held for sale | (1) | (20) | (8) | (2) | (32) | |||
| Translation differences and other | (1) | (37) | (30) | (38) | 1 | 18 | - | (87) |
| Total change | (22) | (195) | (89) | (57) | 42 | (13) | (1) | (335) |
| Balance as of December 31, 2023 | ||||||||
| Cost | 629 | 2,593 | 2,908 | 2,432 | 635 | 929 | 139 | 10,265 |
| Amortization / impairments | (511) | (1,718) | (1,895) | (2,096) | (91) | (662) | (101) | (7,075) |
| Book Value | 118 | 875 | 1,013 | 336 | 544 | 267 | 38 | 3,190 |
Philips Group
Intangible assets excluding goodwill
in millions of EUR
| brand names | customer relationships | technology | product development | product development construction in progress | software | other | total | |
|---|---|---|---|---|---|---|---|---|
| Balance as of January 1, 2022 | ||||||||
| Cost | 644 | 2,590 | 2,605 | 2,701 | 505 | 754 | 146 | 9,944 |
| Amortization / impairments | (481) | (1,447) | (1,605) | (2,102) | (91) | (467) | (101) | (6,294) |
| Book value | 162 | 1,143 | 1,000 | 599 | 414 | 287 | 44 | 3,650 |
| Additions | (3) | - | 51 | - | 257 | 109 | 1 | 416 |
| Assets available for use | 118 | (118) | - | - | - | |||
| Acquisitions | 1 | 3 | 177 | - | - | - | 180 | |
| Amortization | (24) | (141) | (140) | (206) | (1) | (100) | (3) | (614) |
| Impairments | - | (6) | (46) | (123) | (81) | (17) | (2) | (276) |
| Translation differences and other | 4 | 71 | 59 | 5 | 31 | 1 | (2) | 169 |
| Total change | (22) | (74) | 102 | (206) | 88 | (7) | (6) | (125) |
| Balance as of December 31, 2022 | ||||||||
| Cost | 647 | 2,735 | 2,947 | 2,605 | 648 | 869 | 152 | 10,602 |
| Amortization / impairments | (507) | (1,665) | (1,845) | (2,212) | (146) | (589) | (113) | (7,077) |
| Book Value | 140 | 1,070 | 1,102 | 393 | 502 | 280 | 39 | 3,526 |
Acquisitions in 2023 involved intangible assets of EUR 40 million in aggregate (2022: EUR 180 million). For more information, refer to Acquisitions and divestments.
Impairments in 2023 were EUR 16 million (2022: EUR 276 million) and mainly relate to product development construction in progress and product development.
The company uses scenarios in the business forecasting process and the most reasonable and supportable assumptions which represent management’s best estimate are used as the basis for the value-in-use calculations.
The amortization and impairment of intangible assets is further specified in Income from operations.
The most notable intangible assets as of December 31, 2023 relate to the BioTelemetry customer relationships and technology with a carrying value of EUR 327 million and EUR 123 million and a remaining amortization period of 13 years and 9 years, respectively and Spectranetics customer relationships and technology with a carrying value of EUR 261 million and EUR 175 million and a remaining amortization period of 14 years and 9 years, respectively. The most notable intangible assets as of December 31, 2022 relate to the BioTelemetry customer relationships and technology with value of EUR 385 million and EUR 150 million and a remaining amortization period of 14 years and 10 years, respectively and Spectranetics customer relationships and technology with a carrying value of EUR 291 million and EUR 203 million and a remaining amortization period of 15 years and 10 years, respectively.
The classification of financial assets at initial recognition depends on the financial asset’s contractual cash flow characteristics and the company’s business model for managing them.
The company initially measures a financial asset at its fair value plus, in the case of a financial asset not at fair value through profit or loss, transaction costs.
For the purposes of subsequent measurement, financial assets are classified into four categories:
The company recognizes a loss allowance for expected credit losses for trade receivables, contract assets, lease receivables, debt investments carried at amortized cost and fair value through other comprehensive income (FVTOCI).
At each balance sheet date, the company assesses whether there is objective evidence that a financial asset or a group of financial assets is impaired and recognizes a loss allowance for expected credit losses for financial assets measured at either amortized costs or at fair value through other comprehensive income. If, at the reporting date, the credit risk on a financial instrument has not increased significantly since initial recognition, the company measures the loss allowance for the financial instrument at an amount equal to 12 months of expected credit losses. If, at the reporting date, the credit risk on a financial instrument has increased significantly since initial recognition, the company measures the loss allowance for the financial instrument at an amount equal to the lifetime-expected credit losses. For all trade receivables, contract assets and lease receivables the company measures the loss allowance at an amount equal to lifetime-expected credit losses.
The determination of fair value is subject to estimates for investments that are not publicly traded. Refer to Fair value of financial assets and liabilities
Financial assets classified at amortized cost and at fair value through OCI are subject to impairment assessment. The calculation of expected credit losses requires the company to apply significant judgment and make estimates and assumptions that involve significant uncertainty at the time they are made. Changes to these estimates and assumptions can result in significant changes to the timing and amount of expected credit losses to be recognized.
In 2023, Other current financial assets decreased from EUR 11 million to EUR 3 million (2022: increased from EUR 2 million to EUR 11 million).
The company’s investments in Other non-current financial assets mainly consist of investments in common shares of companies in various industries and investments in limited life funds. The changes during 2023 and 2022 were as follows:
Philips Group
Other non-current financial assets
in millions of EUR
| Non-current financial assets at FVTP&L | Non-current financial assets at FVTOCI | Non-current financial assets at Amortized cost | Total | |
|---|---|---|---|---|
| Balance as of January 1, 2023 | 322 | 284 | 54 | 660 |
| Changes: | ||||
| Acquisitions/additions | 71 | 14 | 20 | 105 |
| Sales/redemptions/reductions | (33) | (14) | (11) | (58) |
| Impairments | ||||
| Value adjustment through OCI | - | (17) | (17) | |
| Value adjustment through P&L | (39) | - | (39) | |
| Translation differences and other | (29) | (14) | (1) | (44) |
| Reclassifications | (8) | 5 | 15 | 12 |
| Balance as of December 31, 2023 | 284 | 258 | 77 | 619 |
Philips Group
Other non-current financial assets
in millions of EUR
| Non-current financial assets at FVTP&L | Non-current financial assets at FVTOCI | Non-current financial assets at Amortized cost | Total | |
|---|---|---|---|---|
| Balance as of January 1, 2022 | 283 | 300 | 47 | 630 |
| Changes: | ||||
| Acquisitions/additions | 114 | 18 | 18 | 150 |
| Sales/redemptions/reductions | (75) | (3) | (8) | (86) |
| Impairments | (3) | (1) | (5) | |
| Value adjustment through OCI | - | (35) | (35) | |
| Value adjustment through P&L | 5 | - | 5 | |
| Translation differences and other | (2) | 5 | (1) | 2 |
| Reclassifications | 1 | (2) | (1) | (2) |
| Balance as of December 31, 2022 | 322 | 284 | 54 | 660 |
As of December 31, 2023, equity investments of EUR 231 million (2022: EUR 259 million) are accounted under the FVTOCI category based on the company's election at initial recognition mainly because such investments are neither held for trading purposes nor primarily for their increase in value and the elected presentation is considered to reflect the nature and purpose of the investment.
The company recognizes contract assets for revenue earned from installation services because the receipt of consideration is conditional on successful completion of the installation. Upon completion of the installation and acceptance by the customer, the amount recognized as contract assets is reclassified to trade receivables.
Other assets are measured at amortized cost minus any impairment losses.
Other non-current assets as of December 31, 2023 were EUR 93 million (2022: EUR 98 million). These are mainly related to prepaid expenses.
Other current assets as of December 31, 2023 of EUR 500 million (2022: EUR 490 million) included contract assets of EUR 297 million (2022: EUR 292 million), accrued income of EUR 6 million (2022: EUR 24 million) and prepaid expenses of EUR 197 million (2022: EUR 174 million) mainly related to Diagnosis & Treatment businesses and Connected Care businesses.
Inventories are stated at the lower of cost or net realizable value. The cost of inventories comprises all costs of purchase, costs of conversion and other costs incurred in bringing the inventories to their present location and condition. The costs of conversion of inventories include direct labor and fixed and variable production overheads, considering the stage of completion and the normal capacity of production facilities. Costs of idle facility and abnormal waste are expensed. The cost of inventories is determined using the first-in, first-out (FIFO) method. The write-down of inventories to net realizable value is included in cost of sales.
Inventory is reduced for the estimated losses due to obsolescence. This reduction is determined for groups of products based on sales in the recent past and/or expected future demand.
Inventories are summarized as follows:
Philips Group
Inventories
in millions of EUR
| 2022 | 2023 | |
|---|---|---|
| Raw materials and supplies | 1,541 | 1,309 |
| Work in process | 648 | 552 |
| Finished goods | 1,860 | 1,629 |
| Inventories | 4,049 | 3,491 |
In 2023, overall global inventories have operationally decreased in all categories due to the deployment of strategic management of aging and unhealthy inventory accompanied by a more optimized tracking in both production and commercial inventories.
The write-down of inventories to net realizable value was EUR 339 million in 2023 (2022: EUR 215 million), including EUR 82 million related to the proposed Respironics consent decree (refer to Provisions).
Receivables are held by the company to collect the related cash flows. These receivables are measured at fair value and subsequently measured at amortized cost minus any impairment losses.
Receivables are derecognized when the company has transferred substantially all risks and rewards, which includes transactions in which the company enters into factoring transactions, or if the company does not retain control over the receivables.
Receivables are subject to impairment assessment, which involves estimating expected credit losses. Refer to Other financial assets for accounting policies on impairment of financial assets.
Non-current receivables are associated mainly with customer financing in the Diagnosis & Treatment businesses amounting to EUR 102 million (2022: EUR 69 million), for Signify indemnification amounting to EUR 4 million (2022: EUR 26 million), an income tax receivable amounting to EUR 12 million (which includes an interest receivable of EUR 3 million) for which Philips expects to get a refund (2022: EUR 126 million) and insurance receivables in the US amounting to EUR 33 million (2022: EUR 30 million).
Current receivables of EUR 3,733 million (2022: EUR 4,115 million) as of December 31, 2023 included trade accounts receivable (net of allowance) of EUR 3,546 million (2022: EUR 3,832 million), accounts receivable other of EUR 170 million (2022: EUR 228 million) and accounts receivable from investments in associates of EUR 18 million (2022: EUR 55 million).
The trade accounts receivable, net, per segment are as follows:
Philips Group
Trade accounts receivable, net
in millions of EUR
| 2022 | 2023 | |
|---|---|---|
| Diagnosis & Treatment | 1,795 | 1,688 |
| Connected Care | 1,332 | 1,105 |
| Personal Health | 479 | 576 |
| Other | 226 | 177 |
| Trade accounts receivable, net | 3,832 | 3,546 |
The aging analysis of trade accounts receivable, net, representing current and overdue but not fully impaired receivables, is as follows:
Philips Group
Aging analysis
in millions of EUR
| 2022 | 2023 | |
|---|---|---|
| Current | 3,280 | 3,132 |
| Overdue 1-30 days | 169 | 117 |
| Overdue 31-180 days | 282 | 234 |
| Overdue more than 180 days | 101 | 63 |
| Trade accounts receivable, net | 3,832 | 3,546 |
The changes in the allowance for doubtful accounts receivable are as follows:
Philips Group
Allowance for accounts receivable
in millions of EUR
| 2022 | 2023 | |
|---|---|---|
| Balance as of January 1 | 190 | 226 |
| Additions charged to expense | 66 | 27 |
| Deductions from allowance1) | (51) | (26) |
| Transfer to assets held for sale | (1) | |
| Other movements | 21 | (10) |
| Balance as of December 31 | 226 | 216 |
The allowance for doubtful accounts receivable has been primarily established for receivables that are past due. The allowance presented also includes the allowance for Non-current customer finance receivables of EUR 8 million (2022: EUR 7 million). Other movements in the current period are mainly related to foreign currency valuations.
Included in the above balances as of December 31, 2023 are allowances for individually impaired receivables of EUR 210 million (2022: EUR 222 million).
Common shares are classified as equity. Incremental costs directly attributable to the issuance of shares are recognized as a deduction from equity. Where the company repurchases the company’s equity share capital (treasury shares), the consideration paid, including any directly attributable incremental transaction costs (net of income taxes), is deducted from shareholders’ equity until such treasury shares are cancelled or reissued.
Where such treasury shares are subsequently reissued, any consideration received, net of any directly attributable incremental transaction costs and the related income tax effects, is included in shareholders’ equity.
Call options on own shares are treated as equity instruments.
Dividends are recognized as a liability in the period in which they are declared and approved by shareholders. The income tax consequences of dividends are recognized when a liability to pay the dividend is recognized.
As of December 31, 2023, authorized common shares consist of 2 billion shares (December 31, 2022: 2 billion; December 31, 2021: 2 billion) and the issued and fully paid share capital consists of 913,515,966 common shares, each share having a par value of EUR 0.20 (December 31, 2022: 889,315,082; December 31, 2021: 883,898,969).
As a means to protect the company against (an attempt at) an unsolicited takeover or other attempt to exert (de facto) control of the company, the ‘Stichting Preferente Aandelen Philips’ has been granted the right to acquire preference shares in the company. As of December 31, 2023, no such right has been exercised and no preference shares have been issued. Authorized preference shares consist of 2 billion shares as of December 31, 2023 (December 31, 2022: 2 billion; December 31, 2021: 2 billion).
Under its share-based compensation plans, the company granted stock options on its common shares and other conditional rights to receive common shares in the future such as restricted shares and performance shares (refer to Share-based compensation).
In connection with the company’s share repurchase programs, shares which have been repurchased and are held in Treasury for the purpose of (i) delivery under share-based compensation plans upon exercise of options, or vesting of restricted or performance shares, and (ii) capital reduction, are accounted for as a reduction of shareholders’ equity. Treasury shares are recorded at cost, representing the market price on the acquisition date. When treasury shares are delivered by the company under its share-based compensation plans, such shares are removed from treasury shares on a first-in, first-out (FIFO) basis.
When treasury shares are delivered by the company upon exercise of options, the difference between the cost and the cash received is recorded in retained earnings. When treasury shares are delivered by the company upon vesting of restricted shares or performance shares (granted under the company’s share-based compensation plans), the difference between the market price of the shares and the cost is recorded in retained earnings, and the market price is recorded in capital in excess of par value.
The following table shows the movements in the outstanding number of shares over the last three years:
Philips Group
Outstanding number of shares
| 2021 | 2022 | 2023 | |
|---|---|---|---|
| Balance as of January 1 | 905,128,293 | 870,182,445 | 881,480,527 |
| Dividend distributed | 6,345,968 | 14,174,568 | 39,334,938 |
| Purchase of treasury shares | (45,486,392) | (5,080,693) | (15,964,445) |
| Delivery of treasury shares | 4,194,577 | 2,204,207 | 1,552,136 |
| Balance as of December 31 | 870,182,445 | 881,480,527 | 906,403,156 |
The following table reflects transactions that took place in relation to former and current share-based compensation plans:
Philips Group
Transactions related to share-based compensation plans
| 2021 | 2022 | 2023 | |
|---|---|---|---|
| Shares acquired | 3,996,576 | 2,142,445 | 3,000,000 |
| Average market price | EUR 36.15 | EUR 31.76 | EUR 41.59 |
| Amount paid | EUR 144 million | EUR 68 million | EUR 125 million |
| Shares delivered | 4,194,577 | 2,204,207 | 1,552,136 |
| Average price (FIFO) | EUR 34.14 | EUR 35.16 | EUR 34.59 |
| Cost of delivered shares | EUR 143 million | EUR 77 million | EUR 54 million |
| Total shares in treasury at year-end | 5,726,708 | 5,664,946 | 7,112,810 |
| Total cost | EUR 201 million | EUR 191 million | EUR 262 million |
The following transactions took place for capital reduction purposes:
Philips Group
Transactions related to capital reduction
| 2021 | 2022 | 2023 | |
|---|---|---|---|
| Shares acquired | 41,489,816 | 2,938,248 | 12,964,445 |
| Average market price | EUR 36.22 | EUR 36.61 | EUR 37.25 |
| Amount paid | EUR 1,503 million | EUR 108 million | EUR 483 million |
| Cancellation of treasury shares (shares) | 33,500,000 | 8,758,455 | 15,134,054 |
| Cancellation of treasury shares (EUR) | EUR 1,216 million | EUR 299 million | EUR 566 million |
| Total shares in treasury at year-end | 7,989,816 | 2,169,609 | |
| Total cost | EUR 287 million | EUR 83 million |
Share purchase transactions related to employee option and share plans, as well as transactions related to the reduction of share capital, involved a cash outflow of EUR 662 million in 2023. In 2023, the settlement of forward contracts resulted in a withholding tax liability for an amount of EUR 66 million relating to the dividend distribution. As of December 31, 2023, the remaining liability to be settled amounted to EUR 11 million.
Philips uses different methods to repurchase shares in its own capital: (i) share buyback repurchases in the open market via an intermediary; (ii) repurchase of shares via forward contracts for future delivery of shares; and (iii) the unwinding of call options on own shares. During 2023, Philips used method (ii) to repurchase shares for capital reduction purposes and share-based compensation plans.
On June 14, 2023, Royal Philips announced that it will repurchase up to 7.1 million shares to cover certain of its obligations arising from its long-term incentive and employee stock purchases plans. Under this program, Philips entered into one forward contract for an amount of EUR 138 million to acquire 7.1 million shares with settlement dates varying between November 2024 and November 2025 and a weighted average forward price of EUR 19.43.
On June 13, 2022, Royal Philips announced that it will repurchase up to 3.2 million shares to cover certain of its obligations arising from its long-term incentive and employee stock purchases plans. Under this program, Philips entered into one forward contract for an amount of EUR 63 million to acquire 3.2 million shares with settlement dates in November 2024 and December 2024 and a weighted average forward price of EUR 19.75.
On May 19, 2021, Royal Philips announced that it will repurchase up to 2 million shares to cover certain of its obligations arising from its long-term incentive and employee stock purchase plans. Under this program, Philips entered into one forward contract for an amount of EUR 90 million to acquire 2 million shares with settlement dates in October 2023 and November 2023 and a weighted average forward price of EUR 44.85. As of December 31, 2023, all shares under this program were acquired (settled in the fourth quarter of 2023). This resulted in a EUR 90 million increase in retained earnings against treasury shares.
On January 29, 2020, Philips announced that it will repurchase up to 6 million shares to cover certain of its obligations arising from its long-term incentive and employee stock purchase plans. Under this program, Philips entered into three forward contracts to acquire in total 5 million for an amount of EUR 174 million to acquire with settlement dates varying between October 2021 and November 2022 and a weighted average forward price of EUR 34.85. On October 26, 2022, the original settlement date of two tranches entered into under this program (in total 1.75 million shares) has been extended from November 23, 2022 to November 2023, and November 2024, respectively. As of December 31, 2023, a total of 4.3 million shares (December 31, 2022: 3.3 million shares) under this program were acquired (settled in the fourth quarter of 2021, 2022, and 2023). This resulted in a EUR 35 million (2022: EUR 57 million) increase in retained earnings against treasury shares.
As of December 31, 2023, the remaining forward contracts to cover obligations under share-based compensation plans related to 11.1 million shares (December 31, 2022: 7.0 million shares) and amounted to EUR 224 million (December 31, 2022: EUR 211 million).
On July 26, 2021, Philips announced a share buyback program for share cancellation purposes for an amount of up to EUR 1.5 billion. Consequently, in the third quarter of 2021 Philips entered into three forward contracts for an amount of EUR 731 million to acquire 20 million shares with settlement dates in 2022, 2023 and 2024 and a weighted average forward price of EUR 37.36. Philips executed the remainder of the program through open market purchases by an intermediary in the fourth quarter of 2021 (acquiring 21 million shares) and January 2022 (acquiring 0.8 million shares). This resulted in a EUR 781 million increase in retained earnings against treasury shares. As of December 31, 2023, a total of 15.1 million (December 31, 2022: 2.2 million) shares under this program were acquired (in the fourth quarter of 2022 and third and fourth quarters of 2023). This resulted in EUR 483 million (including dividend adjustment) increase in retained earnings against treasury shares (2022: EUR 83 million).
As of December 31, 2023, the remaining forward contracts entered into for capital reduction purposes relate to 4.4 million shares (December 31, 2022: 17.4 million shares) and amounted to EUR 167 million (December 31, 2022: EUR 648 million).
In 2016, Philips purchased EUR-denominated and USD-denominated call options on its own shares to hedge options granted to employees up to 2013.
On December 31, 2022, there were 55,750 EUR-denominated call options outstanding. As of December 31, 2023, all outstanding EUR-denominated call options have expired.
In December 2023, Philips completed the cancellation of 15.1 million of its common shares (with a cost price of EUR 566 million). The cancelled shares were acquired as part of Philips’ EUR 1.5 billion share repurchase program announced on July 26, 2021.
In May 2023, Philips distributed a dividend of EUR 0.85 per common share, representing a total value of EUR 749 million (including costs). The dividend was distributed in the form of shares only, resulting in the issuance of 39,334,938 new common shares. Per share calculations have been adjusted retrospectively for all periods presented to reflect the issuance of shares for the share dividend in respect of 2022. Further reference is made to Earnings per share.
A proposal will be submitted to the 2024 Annual General Meeting of Shareholders to pay a dividend of EUR 0.85 per common share, in common shares only, against retained earnings for 2023.
In May 2022, Philips distributed a dividend of EUR 0.85 per common share, representing a total value of EUR 741 million (including costs). Shareholders could elect for a cash dividend or a share dividend. Approximately 45% of the shareholders elected for a share dividend, resulting in the issuance of 14,174,568 new common shares. The settlement of the cash dividend involved an amount of EUR 411 million (including costs).
In June 2021, Philips distributed a dividend of EUR 0.85 per common share, representing a total value of EUR 773 million (including costs). Shareholders could elect for a cash dividend or a share dividend. Approximately 38% of the shareholders elected for a share dividend, resulting in the issuance of 6,345,968 new common shares. The settlement of the cash dividend involved an amount of EUR 482 million (including costs).
As of December 31, 2023, pursuant to Dutch law, certain limitations exist relating to the distribution of shareholders’ equity of EUR 2,435 million. Such limitations relate to common shares of EUR 183 million, as well as to legal reserves required by Dutch law included under retained earnings of EUR 990 million and unrealized currency translation differences of EUR 1,263 million. The unrealized gain related to cash flow hedges of EUR 6 million and unrealized loss related to fair value through OCI financial assets of EUR 390 million qualify as revaluation reserves and reduce the distributable amount due to the fact that these reserves are negative.
The legal reserves required by Dutch law of EUR 990 million included under retained earnings relates to any legal or economic restrictions on the ability of affiliated companies to transfer funds to the parent company in the form of dividends.
As of December 31, 2022, these limitations in distributable amounts were EUR 3,054 million and related to common shares of EUR 178 million, as well as to legal reserves required by Dutch law included under retained earnings of EUR 1,010 million and unrealized currency translation differences of EUR 1,866 million. The unrealized losses related to fair value through OCI financial assets of EUR 376 million and unrealized loss related to cash flow hedges of EUR 2 million qualify as a revaluation reserve and reduce the distributable amount due to the fact that this reserve is negative.
Non-controlling interests relate to minority stakes held by third parties in consolidated group companies.
Philips manages capital based upon the IFRS measures, net cash provided by operating activities and net cash used for investing activities as well as the non-IFRS measure net debt. The definition of this non-IFRS measure and a reconciliation to the IFRS measure is included below.
Net debt is defined as the sum of long and short-term debt minus cash and cash equivalents. Group equity is defined as the sum of shareholders’ equity and non-controlling interests. This measure is used by Philips Treasury management and investment analysts to evaluate financial strength and funding requirements. The Philips net debt position is managed with the intention of retaining the current strong investment grade credit rating. Furthermore, Philips’ aim when managing the net debt position is dividend stability and a pay-out ratio of 40% to 50% of Adjusted income from continuing operations attributable to shareholders (reconciliation to the most directly comparable IFRS measure, Net income, is provided at the end of this note).
Philips Group
Composition of net debt and group equity
in millions of EUR unless otherwise stated
| 2021 | 2022 | 2023 | |
|---|---|---|---|
| Long-term debt | 6,473 | 7,270 | 7,035 |
| Short-term debt | 506 | 931 | 654 |
| Total debt | 6,980 | 8,201 | 7,689 |
| Cash and cash equivalents | 2,303 | 1,172 | 1,869 |
| Net debt | 4,676 | 7,028 | 5,820 |
| Shareholders' equity | 14,438 | 13,249 | 12,028 |
| Non-controlling interests | 36 | 34 | 33 |
| Group equity | 14,475 | 13,283 | 12,061 |
| Net debt and group equity ratio | 24:76 | 35:65 | 33:67 |
Adjusted income from continuing operations attributable to shareholders is not a recognized measure of financial performance under IFRS. The reconciliation of Adjusted income from continuing operations attributable to shareholders to the most directly comparable IFRS measure, Net income for 2023 is included in the following table.
Philips Group
Adjusted income from continuing operations attributable to shareholders
1) in millions of EUR
| 2021 | 2022 | 2023 | |
|---|---|---|---|
| Net income | 3,323 | (1,605) | (463) |
| Discontinued operations, net of income taxes | (2,711) | (13) | 10 |
| Income from continuing operations | 612 | (1,618) | (454) |
| Income from continuing operations attributable to non-controlling interests | (4) | (3) | (2) |
| Income from continuing operations attributable to shareholders1) | 608 | (1,622) | (456) |
| Adjustments for: | |||
| Amortization and impairment of acquired intangible assets | 322 | 363 | 290 |
| Impairment of goodwill | 15 | 1,357 | 8 |
| Restructuring costs and acquisition-related charges | 95 | 202 | 381 |
| Other items: | 1,069 | 925 | 1,358 |
| Respironics litigation provision | 575 | ||
| Respironics field-action connected to the proposed consent decree | 719 | 250 | 363 |
| Respironics field-action running remediation cost | 94 | 210 | 224 |
| Quality remediation actions | 94 | 59 | 175 |
| R&D project impairments | 134 | ||
| Portfolio realignment charges | 109 | ||
| Impairment of assets in S&RC | 39 | ||
| Provision for public investigations tender irregularities | 60 | ||
| Provision for a legal matter | 31 | ||
| Investment re-measurement loss | 23 | ||
| Loss (gain) on divestment of business | 76 | (35) | |
| Remaining items | 87 | 63 | 2 |
| Net finance income/expenses | (84) | (4) | 18 |
| Tax impact of adjusted items and tax only adjusting items | (527) | (376) | (450) |
| Adjusted Income from continuing operations attributable to shareholders1) | 1,497 | 845 | 1,148 |
Debt is initially measured at fair value net of directly attributable transaction costs. Subsequently, debt is measured at amortized cost using the effective interest rate method. Amortized cost is calculated by taking into account any discount or premium on acquisition and fees or costs that are an integral part of the effective interest rate. Debt is derecognized when the obligation under the liability is discharged, cancelled or has expired.
Lease liabilities are measured at the present value of the lease payments due over the lease term, generally discounted using the incremental borrowing rate. Lease liabilities are subsequently measured at amortized cost using the effective interest method. Lease liabilities are remeasured in case of modifications or reassessments of the lease.
Philips has a USD 2.5 billion Commercial Paper Program and a EUR 1 billion committed standby revolving credit facility that can be used for general group purposes, such as a backstop of its Commercial Paper Program. As of December 31, 2023, Philips did not have any loans outstanding under either facility. These facilities do not have a material adverse change clause, have no financial covenants and no credit-rating-related acceleration possibilities. Philips established a Euro Medium-Term Note (EMTN) program, a framework that facilitates the issuance of notes for a total amount up to EUR 10 billion. As of December 31, 2023, Philips has EUR 3.3 billion outstanding under this program of which EUR 500 million fixed rate notes were issued in August 2023 with a maturity date in 2031.
The provisions applicable to all USD-denominated corporate bonds issued by the company in March 2008 and March 2012 (due 2038 and 2042) contain a ‘Change of Control Triggering Event’. If the company would experience such an event with respect to a series of corporate bonds the company might be required to offer to purchase the bonds that are still outstanding at a purchase price equal to 101% of their principal amount, plus accrued and unpaid interest, if any. Furthermore, the conditions applicable to the EUR-denominated corporate bonds issued since 2018 contain a similar provision (‘Change of Control Put Event’). Upon the occurrence of such an event, the company might be required to redeem or purchase any of such bonds at their principal amount together with interest accrued. Philips’ outstanding long-term debt do not contain financial covenants.
In 2023, Philips issued EUR 500 million of fixed rate notes under the company’s EMTN program that mature in 2031 and used the proceeds for general corporate purposes, including the repayment of EUR 500 million that was outstanding under the credit facility entered into in the fourth quarter of 2022. In 2023, Philips entered into a total amount of EUR 138 million forward contracts relating to the company’s long-term incentive plans. These forwards mature in the fourth quarters of 2024 (EUR 61m) and 2025 (EUR 77m). In addition, a total of EUR 125 million forward contracts relating to the long-term incentive and employee stock purchase plans and EUR 481 million of forwards related to the share buyback program announced in 2021 matured throughout 2023.
In 2022, Philips announced a series of Liability Management transactions to optimize its debt maturity profile. The transactions included the issuance of three series of Notes under its EMTN program for a total of EUR 2 billion with maturities in 2027, 2029 and 2033. Part of the proceeds were used to tender certain of Philips’ outstanding US Dollar denominated bonds due 2025 and 2026 and Euro-denominated bonds due 2023, 2024 and 2025, as well as make-whole and fully redeem the Euro-denominated bonds due 2023 and 2024 that were not purchased as part of the Euro tender offer. Philips issued Commercial Paper of EUR 200 million in September 2022 and EUR 101 million in October 2022. These tranches were repaid throughout the fourth quarter of 2022. In addition, in October 2022 Philips entered into a EUR 1 billion credit facility that could be used for general corporate purposes. The credit facility matured in October 2023 and had a 12-month extension option at Philips discretion. Per year-end 2022, EUR 500 million was utilized and outstanding under the credit facility. In 2022, Philips entered into a total amount of EUR 63 million forward contracts relating to the company’s long-term incentive and employee stock purchase plans. A total of EUR 57 million forward contracts relating to the long-term incentive and employee stock purchase plans and EUR 83 million of forwards related to the share buyback program announced in 2021 matured throughout 2022.
The following tables present information about the long-term debt outstanding, its maturity and average interest rates in 2023 and 2022.
Philips Group
Long-term debt
in millions of EUR unless otherwise stated
| 2023 | |||||||
|---|---|---|---|---|---|---|---|
| amount outstanding | Current portion | Non-current portion | Between 1 and 5 years | amount due after 5 years | average remaining term (in years) | average rate of interest | |
| USD bonds | 1,325 | 1,325 | 240 | 1,085 | 13.3 | 6.3% | |
| EUR bonds | 4,569 | 4,569 | 2,335 | 2,234 | 5.1 | 2.0% | |
| Forward contracts | 396 | 321 | 76 | 76 | 0.8 | 1.4% | |
| Lease liabilities | 1,074 | 211 | 864 | 505 | 358 | 3.9 | 3.1% |
| Bank borrowings | 203 | 1 | 201 | 201 | 1.2 | 4.2% | |
| Other long-term debt | - | - | - | - | - | 7.4 | 1.2% |
| Long-term debt | 7,568 | 532 | 7,035 | 3,357 | 3,678 | 6.0 | 2.9% |
Philips Group
Long-term debt
in millions of EUR unless otherwise stated
| 2022 | |||||||
|---|---|---|---|---|---|---|---|
| amount outstanding | Current portion | Non-current portion | Between 1 and 5 years | amount due after 5 years | average remaining term (in years) | average rate of interest | |
| USD bonds | 1,378 | 1,378 | 250 | 1,128 | 14.3 | 6.3% | |
| EUR bonds | 4,061 | 4,061 | 1,836 | 2,225 | 5.7 | 1.7% | |
| Forward contracts | 858 | 606 | 252 | 252 | 1.0 | ||
| Lease liabilities | 1,082 | 230 | 852 | 504 | 348 | 3.9 | 2.4% |
| Bank borrowings | 705 | 2 | 702 | 702 | 1.9 | 1.7% | |
| Other long-term debt | 28 | 4 | 24 | 17 | 6 | 8.9 | 2.9% |
| Long-term debt | 8,111 | 842 | 7,270 | 3,562 | 3,706 | 6.1 | 2.4% |
The following table presents the amount outstanding and effective rate of bonds.
Philips Group
Unsecured Bonds
in millions of EUR unless otherwise stated
| effective rate | 2022 | 2023 | |
|---|---|---|---|
| Unsecured EUR Bonds | |||
| Due 30/03/2025; 1 3/8% | 1.509% | 346 | 346 |
| Due 22/05/2026; 1/2% | 0.608% | 750 | 750 |
| Due 05/05/2027; 1 7/8% | 2.049% | 750 | 750 |
| Due 02/05/2028; 1 3/8% | 1.523% | 500 | 500 |
| Due 05/11/2029; 2 1/8% | 2.441% | 650 | 650 |
| Due 30/03/2030; 2% | 2.128% | 500 | 500 |
| Due 08/09/2031; 4 2/8% | 4.330% | 500 | |
| Due 05/05/2033; 2 5/8% | 2.710% | 600 | 600 |
| Unsecured USD Bonds | |||
| Due 15/05/2025; 7 3/4% | 7.429% | 51 | 49 |
| Due 15/05/2025; 7 1/8% | 6.794% | 78 | 75 |
| Due 01/06/2026; 7 1/5% | 6.885% | 119 | 114 |
| Due 03/11/2038; 6 7/8% | 7.210% | 683 | 657 |
| Due 15/03/2042; 5% | 5.273% | 470 | 452 |
| Adjustments1) | (57) | (47) | |
| Unsecured Bonds | 5,439 | 5,894 |
The following table presents a reconciliation between the total of future minimum lease payments and their present value.
Philips Group
Lease liabilities
in millions of EUR
| 2022 | 2023 | |||||
|---|---|---|---|---|---|---|
| future minimum lease payments | interest | present value of minimum lease payments | future minimum lease payments | interest | present value of minimum lease payments | |
| Less than one year | 251 | 21 | 230 | 239 | 28 | 211 |
| Between one and five years | 554 | 49 | 505 | 572 | 67 | 505 |
| More than five years | 376 | 28 | 348 | 388 | 30 | 358 |
| Lease liabilities | 1,180 | 98 | 1,082 | 1,200 | 125 | 1,074 |
Philips Group
Short-term debt
in millions of EUR
| 2022 | 2023 | |
|---|---|---|
| Short-term bank borrowings | 89 | 122 |
| Current portion of long-term debt | 842 | 532 |
| Short-term debt | 931 | 654 |
During 2023, the weighted average interest rate on the bank borrowings was 8.6% (2022: 5.7%). This increase was mainly driven by higher interest rate environments across various countries globally.
A provision is a liability of uncertain timing or amount. Provisions are recognized if, as a result of a past event, the company has a present legal or constructive obligation, it is probable that an outflow of economic benefits will be required to settle the obligation and the amount can be estimated reliably. Provisions are measured at the present value of the expenditures expected to be required to settle the obligation using a pre-tax discount rate that reflects current market assessments of the time value of money. The increase in the provision due to passage of time (accretion) is recognized as interest expense.
Provisions for severance and termination benefits are recognized for those costs only when the company has a detailed formal plan for the restructuring and has raised a valid expectation with those affected that it will carry out the restructuring by starting to implement that plan or announcing its main features to those affected by it. Before a provision is established, the company recognizes any impairment loss on the assets associated with the restructuring.
By their nature, the recognition of provisions requires estimates and assumptions regarding the timing and the amount of outflow of resources. The main estimates include:
Philips Group
Provisions
in millions of EUR
| Post-employment benefits | Respironics field-action | Product warranty | Environmental | Restructuring- related | Legal | Contingent consideration | Other | Total | |
|---|---|---|---|---|---|---|---|---|---|
| Current | 366 | 287 | 20 | 134 | 74 | 23 | 112 | 1,018 | |
| Non-current | 546 | 23 | 57 | 83 | 6 | 14 | 89 | 279 | 1,097 |
| Balance as of December 31, 2022 | 546 | 390 | 344 | 104 | 140 | 89 | 113 | 390 | 2,115 |
| Additions | 112 | 240 | 313 | 18 | 263 | 644 | 24 | 223 | 1,836 |
| Utilizations | (91) | (285) | (268) | (14) | (219) | (235) | (20) | (134) | (1,266) |
| Releases | (10) | (20) | (2) | (67) | (10) | (7) | (45) | (159) | |
| Accretion | 5 | 23 | 1 | (3) | 25 | ||||
| Acquisitions | 6 | 6 | |||||||
| Changes in discount rate | (6) | (6) | |||||||
| Translation differences and other | - | (10) | (12) | (3) | (2) | (23) | (2) | (1) | (53) |
| Total change | 12 | (55) | 13 | (2) | (24) | 399 | 2 | 39 | 383 |
| Current | 331 | 293 | 22 | 102 | 477 | 57 | 181 | 1,463 | |
| Non-current | 558 | 3 | 64 | 80 | 14 | 10 | 58 | 248 | 1,035 |
| Balance as of December 31, 2023 | 558 | 334 | 357 | 102 | 116 | 487 | 115 | 429 | 2,498 |
Philips Group
Provisions
in millions of EUR
| Post-employment benefits | Respironics field-action | Product warranty | Environmental | Restructuring -related | Legal | Contingent consideration | Other | Total | |
|---|---|---|---|---|---|---|---|---|---|
| Current | 525 | 207 | 26 | 58 | 39 | 52 | 92 | 998 | |
| Non-current | 659 | 52 | 32 | 99 | 8 | 53 | 156 | 257 | 1,315 |
| Balance as of December 31, 2021 | 659 | 577 | 238 | 124 | 66 | 91 | 208 | 349 | 2,313 |
| Additions | 61 | 250 | 320 | 15 | 154 | 89 | 160 | 1,049 | |
| Utilizations | (185) | (486) | (224) | (17) | (61) | (100) | (105) | (95) | (1,274) |
| Releases | (1) | (2) | (18) | (3) | (35) | (59) | |||
| Accretion | 4 | - | (3) | 2 | |||||
| Acquisitions | 4 | 96 | 99 | ||||||
| Changes in discount rate | (27) | (27) | |||||||
| Fair value changes | (86) | (86) | |||||||
| Translation differences and other | 12 | 49 | 9 | 7 | (1) | 7 | 14 | 97 | |
| Total change | (113) | (187) | 105 | (21) | 74 | (3) | (95) | 41 | (198) |
| Current | 366 | 287 | 20 | 134 | 74 | 23 | 112 | 1,018 | |
| Non-current | 546 | 23 | 57 | 83 | 6 | 14 | 89 | 279 | 1,097 |
| Balance as of December 31, 2022 | 546 | 390 | 344 | 104 | 140 | 89 | 113 | 390 | 2,115 |
On June 14, 2021, Philips’ subsidiary, Philips Respironics initiated a voluntary recall notification in the United States and field safety notice outside the US for certain sleep and respiratory care products related to the polyester-based polyurethane (PE-PUR) sound abatement foam in these devices. The remediation is progressing globally. As of December 31, 2023, the production required for the delivery of replacement devices to patients has been substantially completed and the total number of units expected to be remediated remained stable during the year at 5.6 million devices (specific CPAP, BiPAP and mechanical ventilator devices), excluding certain end-of-life-devices which are expected to be retired.
Philips has recognized a provision based on Philips’ best estimate of the costs to repair, replace or refund devices, subject to the Respironics field action. The provision is related to the cost to repair, replace or refund affected devices and includes, amongst others, the costs for the remaining production, the cost of intensified communication with physicians and patients, material costs, labor cost and logistics, as well as costs relating to the (partial) refunds provided to customers under the field action. The provision does not include any product liability costs or other claims.
The additions for the year primarily reflect the impact of the revised remediation approach in relation to the mechanical ventilator devices subject to the recall, following the agreed terms of the proposed consent decree (see below). The revised approach, which includes a revised repair program and assumes (partial) refunds to customers (refer to Income from operations), resulted in an increase in the costs associated with the remediation of these devices. Utilizations for the year reflect the costs incurred in executing the remediation during the year.
The completion of the field action continues to be subject to uncertainty, which requires management to make estimates and assumptions about items such as quantities and the portion to be replaced, repaired and refunded. An increase in the assumption for the refund portion by 10 percentage points, could have the effect of increasing the provision by an estimated EUR 19 million. Actual outcomes in future periods may differ from these estimates and affect the company’s results of operations, financial position and cash flows.
Further to the above, running remediation costs of EUR 224 million (2022: EUR 210 million) related to the remediation, such as testing, external advisory and regulatory response and additional right-of-return and warranty provisions, have been incurred.
Following the US Food and Drug Administration (FDA) inspection of certain of Philips Respironics' facilities in the US in 2021 and the subsequent inspectional observations, the US Department of Justice, acting on behalf of the FDA, in July 2022 started discussions with Philips regarding the terms of a consent decree to resolve the identified issues, which Philips has now agreed. As a consequence of addressing the consent decree, the company recorded charges of EUR 363 million in December 2023, mainly consisting of EUR 240 million addition to the Respironics field action provision, EUR 82 million inventory write-down (refer to Inventories), EUR 31 million onerous contract provision and EUR 6 million fixed asset impairment.
In addition to the above, Philips and its affiliates are defendants in a number of consumer class action lawsuits from users of the affected devices and a number of individual personal injury and other compensation claims. For legal matters including claims refer to the legal provisions section of this note as well as Contingencies.
The field action provision in connection with the Philips Respironics voluntary recall notification is shown separately above.
Additions in 2023 include quality remediation actions of EUR 81 million in the Diagnosis & Treatment segment.
The company expects the provisions to be utilized mainly within the next year.
The environmental provisions include accrued costs recorded with respect to environmental remediation in various countries. In the US, subsidiaries of the company have been named as potentially responsible parties in state and federal proceedings for the clean-up of certain sites.
The additions and the releases of the provisions originate from additional insights in relation to factors like the estimated cost of remediation, changes in regulatory requirements and efficiencies in completion of various site work phases.
Approximately EUR 63 million of the long-term provision is expected to be utilized after one to five years, with the remainder after five years. For more details on the environmental remediation refer to Contingencies.
Philips Group
Restructuring-related provisions
in millions of EUR
| December 31, 2022 | December 31, 2023 | |
|---|---|---|
| Diagnosis & Treatment | 42 | 36 |
| Connected Care | 42 | 18 |
| Personal Health | 10 | 7 |
| Other | 47 | 56 |
| Philips Group | 140 | 116 |
Further to the workforce reduction in 2022, measures were announced on January 30, 2023 that primarily focus on the reduction of 6,000 positions by 2025. In 2023, the restructuring costs, net of releases, for these measures were EUR 140 million.
In addition, restructuring projects were executed during the year, of which the most significant impacted Connected Care and Other and mainly took place in the US and Netherlands. The restructuring mainly comprised product portfolio rationalization and the reorganization of global support functions. The company expects the provisions to be utilized mainly within the next year.
In 2022, Philips initiated general productivity actions aimed at simplifying the organization to streamline the way of working and reduce operating expenses. This includes an immediate reduction of around 4,000 positions globally across the organization, with severance and termination-related costs of EUR 80 million recorded in 2022.
The company and certain of its group companies and former group companies are involved as a party in legal proceedings, including regulatory and other governmental proceedings.
Additions mainly relate to a EUR 575 million in connection with the anticipated resolution of the economic loss class action in the US. The final cost of the settlement may vary based on, among other things, how many patients and other settlement class members participate in the settlement.
Utilizations mainly relate to the settlement the company reached with the US Securities and Exchange Commission (SEC) to resolve the SEC inquiry regarding alleged tender irregularities in the medical device industry in China, for which the company had recorded a provision of approximately EUR 60 million in 2022. The settlement reached was in line with the amount provided for and EUR 58 million was subsequently paid in 2023. In addition the company funded an amount of USD 155 million (EUR 141 million) into the Qualified Settlement Fund in relation to the economic loss class action settlement announced on September 7, 2023.
For details of other legal matters, including regulatory and other governmental proceedings, refer to Contingencies.
The company expects the provisions to be utilized mainly within the next three years.
In 2023, the addition of EUR 24 million is largely offset by utilizations of EUR 20 million. The acquisition of a business within Ultrasound resulted in a EUR 6 million increase.
Approximately EUR 28 million of the long-term provision is expected to be utilized within the next three years, with the remainder after four years.
The main elements of other provisions are:
Philips Group
Other provisions
in millions of EUR unless otherwise stated
| 2022 | 2023 | |
|---|---|---|
| Employee jubilee funds | 83 | 77 |
| Self-insurance | 57 | 63 |
| Non-income taxes / social security | 46 | 51 |
| Rights of return | 36 | 39 |
| Decommissioning costs | 33 | 34 |
| Onerous contracts | 38 | 76 |
| Remaining | 97 | 89 |
| Balance as of December 31 | 390 | 429 |
Onerous contracts reflect non-cancellable commitments on supplies for which no future demand or alternative usage has been identified, including EUR 31 million in connection with the proposed Respironics consent decree as of December 31, 2023.
Remaining provisions relate to a variety of positions, for example provision for disability of employees and provision for royalty obligations.
Releases in 2022 and 2023 are due to the reassessment of the positions in other provisions throughout the year.
The company expects the other provisions to be utilized mainly within the next five years.
A defined contribution plan is a post-employment benefit plan for which the company pays fixed contributions into a separate entity and will have no legal or constructive obligation to pay further amounts. Obligations for contributions to defined contribution pension plans are recognized as an employee benefit expense in the Consolidated statements of income in the periods during which services are rendered by employees.
A defined benefit plan is a post-employment benefit plan that is not a defined contribution plan. Defined benefit plans define an amount of pension benefit that an employee will receive after retirement. That pension benefit typically depends on several factors such as years of service, age and salary.
The net pension asset or liability recognized in the Consolidated balance sheets in respect of defined benefit plans is the fair value of plan assets less the present value of the projected defined benefit obligation at the balance sheet date. The defined benefit obligation is calculated annually by qualified actuaries using the projected unit credit method. Recognized assets are limited to the present value of any reductions in future contributions or any future refunds. The net pension liability is presented as a long-term provision; no distinction is made for the short-term portion.
For the company’s major plans, a full discount rate curve of high-quality corporate bonds is used to determine the defined benefit obligation, where available. The curves are based on the Mercer Yield Curve methodology, which uses data of corporate bonds rated AA or equivalent. For the other plans the Mercer Yield Curve/Mercer Methodology has also been used taking into account the cash flows as much as possible in case there is a deep market in corporate bonds. For plans in countries without a deep corporate bond market, the discount rate is based on government bonds and the plan’s maturity.
Pension costs in respect of defined benefit plans primarily represent the increase of the actuarial present value of the obligation for post-employment benefits based on employee service during the year and the interest on the net recognized asset or liability in respect of employee service in previous years.
Remeasurements of the net defined benefit asset or liability comprise actuarial gains and losses, the return on plan assets (excluding interest) and the effect of the asset ceiling (excluding interest). The company recognizes all remeasurements in Other comprehensive income.
Past service costs arising from the introduction of a change to the benefit payable under a plan or a significant reduction of the number of employees covered by a plan (curtailment) are recognized in full in the Consolidated statements of income.
Short-term employee benefit obligations are measured on an undiscounted basis and are expensed as the related service is provided. The company recognizes a liability and an expense for bonuses and incentives based on a formula that takes into consideration the profit attributable to the company’s shareholders after certain adjustments.
The company’s net obligation in respect of other long-term employee benefits is the amount of future benefit that employees have earned in return for their service in the current and prior periods, such as jubilee entitlements. That benefit is discounted to determine its present value. Remeasurements are recognized in the Consolidated statements of income in the period in which they arise.
Further information on other employee benefits can be found in Provisions in the Other provisions section.
To make the actuarial calculations for the valuation of defined benefit obligations, assumptions are needed for interest rates, healthcare cost increases, future pension increases, life expectancy and employee turnover rates. The actuarial calculations are made by external actuaries based on inputs from observable market data, such as corporate bond returns and yield curves to determine the discount rates to apply, mortality tables to determine life expectancy and inflation rates to determine future salary and pension growth assumptions.
Employee post-employment benefit plans have been established in many countries in accordance with the legal requirements, customs and the local practice in the countries involved. The larger part of post-employment benefits are company pension plans, of which some are funded and some are unfunded. All funded post-employment benefit plans are considered to be related parties.
Most employees that take part in a company pension plan are covered by defined contribution (DC) pension plans. The main DC plans are in the Netherlands and the United States. The company also sponsors a number of defined benefit (DB) pension plans. The benefits provided by these plans are based on employees’ years of service and compensation levels.
The company also sponsors a limited number of DB retiree medical plans. The benefits provided by these plans typically cover a part of the healthcare costs after retirement. None of these plans are individually significant to the company and are therefore not further separately disclosed.
The larger funded DB and DC plans are governed by independent Trustees who have a legal obligation to protect the interests of all plan members and operate under the local regulatory framework.
The DB plans in Germany and the US make up most of the defined benefit obligation (DBO) and the net position. The company also has DB plans in the rest of the world; however these are individually not significant to the company and do not have a significantly different risk profile that would warrant separate disclosure.
The adjacent table provides a break-down of the present value of the funded and unfunded DBO, the fair value of plan assets and the net position in Germany, the US and in Other Countries. The table also provides the value of reimbursement rights.
Philips Group
Post-employment benefits
in millions of EUR
| Germany | United States | Other Countries | Total | |||||
|---|---|---|---|---|---|---|---|---|
| 2022 | 2023 | 2022 | 2023 | 2022 | 2023 | 2022 | 2023 | |
| Present value of funded DBO | (489) | (511) | (440) | (404) | (179) | (182) | (1,108) | (1,097) |
| Present value of unfunded DBO | (249) | (253) | (128) | (118) | (136) | (137) | (513) | (508) |
| Total present value of DBO | (738) | (764) | (568) | (522) | (315) | (319) | (1,621) | (1,605) |
| Fair value of plan assets | 477 | 481 | 474 | 442 | 171 | 166 | 1,122 | 1,089 |
| Net position | (261) | (283) | (94) | (80) | (144) | (153) | (499) | (516) |
| Value of reimbursement rights | 6 | 8 | 6 | 8 | ||||
The classification of the net position is as follows:
Philips Group
Classification net position
in millions of EUR
| Germany | United States | Other Countries | Total | |||||
|---|---|---|---|---|---|---|---|---|
| 2022 | 2023 | 2022 | 2023 | 2022 | 2023 | 2022 | 2023 | |
| Total asset for plans in a surplus | 9 | - | 34 | 39 | 4 | 2 | 46 | 41 |
| Total liability for plans in a deficit | (270) | (283) | (128) | (118) | (148) | (156) | (546) | (558) |
| Provisions for post-employment benefit plans under AHFS | ||||||||
| Net position | (261) | (283) | (94) | (80) | (144) | (153) | (499) | (516) |
The company has several DB plans in Germany, which are partially unfunded, meaning that after retirement the company is responsible for the benefit payments to retirees.
Due to the relatively high level of social security in Germany, the company’s pension plans mainly provide benefits for the higher earners. The plans are open for future pension accrual. Indexation is mandatory due to legal requirements. Some of the German plans have a DC design, but are accounted for as DB plans due to a legal minimum return requirement.
Company pension commitments in Germany are partly protected against employer bankruptcy via the “Pensions-Sicherungs-Verein” which charges a fee to all German companies providing pension promises.
Philips is one of the sponsors of Philips Pensionskasse VVaG in Germany, which is a multi-employer plan. The plan is classified and accounted for as a DC plan.
The US DB pension plans are closed plans without future pension accrual. For the funding of any deficit in the US plan the Group adheres to the minimum funding requirements of the US Pension Protection Act.
The assets of the US funded pension plans are in Trusts governed by fiduciaries. The non-qualified pension plans that cover accrual above the maximum salary of the funded qualified plan are unfunded.
The company’s qualified pension commitments in the US are covered via the Pension Benefit Guaranty Corporation which charges a fee to US companies providing DB pension plans. The fee is also dependent on the amount of unfunded vested liabilities.
DB plans expose the company to various demographic and economic risks such as longevity risk, investment risks, currency and interest rate risk and in some cases inflation risk. The latter plays a role in the assumed wage increase but more importantly in some countries where indexation of pensions is mandatory.
The company has an active de-risking strategy in which it constantly looks for opportunities to reduce the risks associated with its DB plans. Liability-driven investment strategies, lump sum cash-out options, buy-ins, buy-outs and a change to DC are examples of the strategy.
Pension fund trustees are responsible for and have full discretion over the investment strategy of the plan assets. The plan assets of the Philips pension plans are invested in well diversified portfolios. The interest rate sensitivity of the fixed income portfolio is closely aligned to that of the plan’s pension liabilities for most of the plans. Any contributions from the sponsoring company are used to further increase the fixed income part of the assets. As part of the investment strategy, any improvement in the funded ratio over time is used to further decrease the interest rate mismatch between the plan assets and the pension liabilities.
The adjacent table contains the total of current and past service costs, administration costs and settlement results as included in Income from operations and the interest cost as included in Financial expenses.
Philips Group
Pre-tax costs for post-employment benefits
in millions of EUR
| 2021 | 2022 | 2023 | |
|---|---|---|---|
| Defined benefit plans | 36 | 50 | 47 |
| - included in income from operations | 28 | 39 | 25 |
| - included in financial expense | 8 | 10 | 21 |
| - included in Discontinued operations | 1 | ||
| Defined contribution plans | 375 | 400 | 376 |
| - included in income from operations | 368 | 400 | 376 |
| - included in Discontinued operations | 7 | ||
| Post-employment benefits costs | 411 | 449 | 423 |
The adjacent tables contain the reconciliations for the DBO and plan assets.
Philips Group
Defined benefit obligations
in millions of EUR
| 2022 | 2023 | |
|---|---|---|
| Balance as of January 1 | 1,970 | 1,621 |
| Service cost | 32 | 32 |
| Interest cost | 36 | 71 |
| Employee contributions | 4 | 3 |
| Actuarial (gains) / losses | ||
| - demographic assumptions | 2 | |
| - financial assumptions | (366) | 48 |
| - experience adjustment | 12 | 2 |
| (Negative) past service cost | 16 | (9) |
| Settlements | - | 2 |
| Benefits paid from plan | (95) | (104) |
| Benefits paid directly by employer | (41) | (39) |
| Translation differences and other | 52 | (22) |
| Balance as of December 31 | 1,621 | 1,605 |
Philips Group
Plan assets
in millions of EUR
| 2022 | 2023 | |
|---|---|---|
| Balance as of January 1 | 1,380 | 1,122 |
| Interest income on plan assets | 26 | 49 |
| Admin expenses paid | (1) | (1) |
| Return on plan assets excluding interest income | (254) | 23 |
| Employee contributions | 4 | 3 |
| Employer contributions | 17 | 14 |
| Settlements | ||
| Benefits paid from plan | (95) | (104) |
| Translation differences and other | 45 | (17) |
| Balance as of December 31 | 1,122 | 1,089 |
The past service cost in 2023 and 2022 mainly relate to the retiree medical plans in Brazil.
The asset allocation in the company’s DB plans as of December 31, was as follows:
Philips Group
Plan assets allocation
in millions of EUR
| 2022 | 2023 | |
|---|---|---|
| Assets quoted in active markets | ||
| - Debt securities | 560 | 513 |
| - Equity securities | ||
| - Other | 203 | 182 |
| Assets not quoted in active markets | ||
| - Debt securities | ||
| - Equity securities | 101 | 31 |
| - Other | 258 | 363 |
| Total assets | 1,122 | 1,089 |
The plan assets in 2023 contain 36% (2022: 32%) unquoted plan assets. Plan assets in 2023 do not include property occupied by or financial instruments issued by the company.
The mortality tables used for the company’s largest DB plans are:
Germany: Heubeck-Richttafeln 2018 Generational, assuming 93% of mortality rates for male retirees between age 60 and 85
US: PRI-2012 Generational with MP2021 improvement scale + white collar adjustment
The weighted averages of the assumptions used to calculate the DBO as of December 31, were as follows:
Philips Group
Assumptions used for defined benefit obligations
in %
| Germany | United States | Other Countries | Total | |||||
|---|---|---|---|---|---|---|---|---|
| 2022 | 2023 | 2022 | 2023 | 2022 | 2023 | 2022 | 2023 | |
| Discount rate | 4.1% | 3.7% | 5.2% | 5.0% | 4.9% | 4.9% | 4.7% | 4.3% |
| Inflation rate | 2.0% | 2.0% | 2.3% | 2.3% | 2.6% | 2.5% | 2.2% | 2.2% |
| Salary increase | 2.8% | 2.8% | 0.0% | 0.0% | 3.3% | 4.3% | 2.9% | 3.0% |
The following table illustrates the approximate impact on the DBO from movements in key assumptions. The DBO was recalculated using a change in the assumptions of 1% which overall is considered a reasonably possible change. The impact on the DBO because of changes in discount rate is normally accompanied by offsetting movements in plan assets, especially when using matching strategies.
The average duration in years of the DBO of the DB plans is 10 (Germany: 11, United States: 8, and Other countries: 10) as of December 31, 2023 (2022: 8).
Philips Group
Sensitivity of key assumptions
in millions of EUR
| 2022 | 2023 | |
|---|---|---|
| Increase | ||
| Discount rate (1% movement) | (122) | (123) |
| Pension increase (1% movement) | 57 | 60 |
| Salary increase (1% movement) | 12 | 12 |
| Longevity1) | 32 | 32 |
| Decrease | ||
| Discount rate (1% movement) | 145 | 147 |
| Pension increase (1% movement) | (49) | (52) |
| Salary increase (1% movement) | (11) | (11) |
Cash outflows in relation to post-employment benefits are estimated to amount to EUR 434 million in 2024, consisting of:
The service and administration cost for 2024 is expected to amount to EUR 30 million for DB plans. The net interest cost for 2024 for the DB plans is expected to amount to EUR 21 million. The cost for DC pension plans in 2024 is equal to the expected DC cash flow.
Accrued liabilities are initially measured at fair value and subsequently at amortized cost and are derecognized when the obligation under the liability is discharged, cancelled or has expired.
Accrued liabilities are summarized as follows:
Philips Group
Accrued liabilities
in millions of EUR
| 2022 | 2023 | |
|---|---|---|
| Personnel-related costs: | ||
| - Salaries and wages | 490 | 791 |
| - Accrued holiday entitlements | 97 | 96 |
| - Other personnel-related costs | 101 | 93 |
| Fixed-asset-related costs: | ||
| - Gas, water, electricity, rent and other | 46 | 43 |
| Communication and IT costs | 64 | 61 |
| Distribution costs | 110 | 99 |
| Sales-related costs: | ||
| - Commission payable | 8 | 12 |
| - Advertising and marketing-related costs | 127 | 133 |
| - Other sales-related costs | 20 | 20 |
| Material-related costs | 132 | 138 |
| Interest-related accruals | 71 | 76 |
| Other accrued liabilities | 361 | 324 |
| Accrued liabilities | 1,626 | 1,887 |
Other liabilities are initially measured at fair value and subsequently at amortized cost and are derecognized when the obligation under the liability is discharged, cancelled or has expired.
The company recognizes contract liabilities if a payment is received or a payment is due (whichever is earlier) from a customer before the company transfers the related goods or services. Contract liabilities are recognized as revenue when the company performs under the contract (i.e., transfers control of the related goods or services to the customer).
Non-current liabilities were EUR 54 million as of December 31, 2023 (December 31, 2022: EUR 60 million).
Non-current liabilities are associated mainly with indemnification and non-current accruals.
Other current liabilities are summarized as follows:
Philips Group
Other current liabilities
in millions of EUR
| 2022 | 2023 | |
|---|---|---|
| Accrued customer rebates | 213 | 186 |
| Other taxes including social security premiums | 115 | 129 |
| Other liabilities | 120 | 98 |
| Other current liabilities | 448 | 414 |
Non-current contract liabilities were EUR 469 million as of December 31, 2023 (December 31, 2022: EUR 515 million) and current contract liabilities were EUR 1,809 million as of December 31, 2023 (December 31, 2022: EUR 1,696 million).
The current contract liabilities increased by EUR 113 million, which is mainly driven by an increase in deferred balances for customer service contracts.
The current contract liabilities as of December 31, 2022 resulted in revenue recognized of EUR 1,696 million in 2023.
Cash and cash equivalents include all cash balances, certain money market funds and short-term highly liquid investments with an original maturity of three months or less that are readily convertible into known amounts of cash. Bank overdrafts are included in borrowings in current liabilities.
The cash flow statement is prepared using the indirect method. Cash flows related to interest and tax are included in operating activities. Assets and liabilities acquired as part of a business combination are included in investing activities (net of cash acquired). Dividends paid to shareholders are included in financing activities. Dividends received are included in operating activities.
Cash flows arising from transactions in a foreign currency are translated into the company’s functional currency using the exchange rate at the date of the cash flow. Cash flows from derivative instruments that are accounted for as cash flow hedges are classified in the same category as the cash flows from the hedged items. Cash flows from other derivative instruments are classified as investing cash flows.
Income taxes in 2023 include EUR 2 million of interest related to uncertain tax positions.
In 2023, gross lease payments of EUR 271 million (2022: EUR 316 million; 2021: EUR 308 million) included interest of EUR 27 million (2022: EUR 25 million; 2021: EUR 25 million).
In 2023, a total of EUR 46 million cash was paid with respect to foreign exchange derivative contracts related to activities for liquidity management (2022: EUR 72 million outflow; 2021: EUR 48 million inflow).
In 2023, the net cash outflow is EUR 44 million. In 2022, the net cash outflow is EUR 38 million. In 2021, the net cash flow is EUR 0 million.
Certain items in the statements of cash flows do not correspond to the differences between the balance sheet amounts for the respective items, principally because of the effects of translation differences and consolidation changes.
Philips Group
Reconciliation of liabilities arising from financing activities
in millions of EUR
| Balance as of December 31, 2022 | Cash flow | Currency effects and consolidation changes | Other1) | Balance as of December 31, 2023 | |
|---|---|---|---|---|---|
| Long term debt2) | 8,111 | (210) | (96) | (238) | 7,567 |
| EUR bonds | 4,061 | 497 | 11 | 4,569 | |
| USD bonds | 1,378 | (53) | 1,325 | ||
| Leases | 1,082 | (200) | (42) | 235 | 1,074 |
| Forward contracts3) | 858 | (462) | 396 | ||
| Bank borrowings | 705 | (502) | 203 | ||
| Other long-term debt | 28 | (5) | (1) | (22) | |
| Short term debt2) | 89 | 29 | 3 | 122 | |
| Short-term bank borrowings | 89 | 46 | (14) | 122 | |
| Other short-term loans | (17) | 17 | |||
| Equity | (1,133) | (666) | 1,143 | (656) | |
| Dividend payable | (4) | 4 | |||
| Forward contracts3) | (858) | 465 | (394) | ||
| Treasury shares4) | (275) | (662) | 675 | (262) | |
| Total | (848) |
Philips Group
Reconciliation of liabilities arising from financing activities
in millions of EUR
| Balance as of December 31, 2021 | Cash flow | Currency effects and consolidation changes | Other1) | Balance as of December 31, 2022 | |
|---|---|---|---|---|---|
| Long term debt2) | 6,933 | 1,045 | 107 | 27 | 8,111 |
| EUR bonds | 3,233 | 827 | 4,061 | ||
| USD bonds | 1,313 | (20) | 85 | 1,378 | |
| Leases | 1,220 | (260) | 17 | 105 | 1,082 |
| Forward contracts3) | 934 | (76) | 858 | ||
| Bank borrowings | 203 | 498 | 4 | 705 | |
| Other long-term debt | 30 | (1) | 1 | (1) | 28 |
| Short term debt2) | 47 | 47 | (6) | 1 | 89 |
| Short-term bank borrowings | 47 | 47 | (6) | 1 | 89 |
| Other short-term loans | |||||
| Equity | (1,410) | (593) | 869 | (1,133) | |
| Dividend payable | (418) | 418 | |||
| Forward contracts3) | (934) | 76 | (858) | ||
| Treasury shares | (476) | (174) | 375 | (275) | |
| Total | 500 |
A contingent liability is a liability of uncertain timing and amount. Contingencies are not recognized in the balance sheet because they are dependent on the occurrence or non-occurrence of one or more uncertain future events not wholly within the control of the company or because the risk of loss is estimated to be possible but not probable or because the amount cannot be measured reliably. Pursuant to IAS 37, Provisions, Contingent Liabilities and Contingent Assets, certain information is not disclosed for legal proceedings for which the company concludes that disclosure can be expected to seriously prejudice the outcome of the matter.
Contingent assets are disclosed if the inflow of economic benefits is probable, but not virtually certain. If the inflow of economic benefits becomes virtually certain, the asset would be considered no longer contingent and its recognition appropriate. Contingent assets are assessed continually and require management to apply judgment, especially to estimate the likelihood of the inflow of economic benefits.
Philips’ policy is to provide guarantees and other letters of support only in writing. Philips does not stand by other forms of support. The company recognizes a liability at the fair value of the obligation at the inception of a financial guarantee contract. The guarantee is subsequently measured at the higher of the best estimate of the obligation or the amount initially recognized less, when appropriate, cumulative amortization.
Significant judgment is required to determine the likelihood of a potential outflow of resources. In addition, judgment is involved in determining whether the amount of an obligation can be measured with sufficient reliability. Contingencies involve inherent uncertainties including, but not limited to, court rulings, negotiations between affected parties, governmental actions, tax and environmental remediation.
The total fair value of guarantees recognized on the balance sheet amounts to EUR nil million for both 2023 and 2022. Remaining off-balance-sheet business related guarantees on behalf of third parties and associates to EUR 2 million in 2023 (December 31, 2022: EUR 2 million).
The company and its subsidiaries are subject to environmental laws and regulations. Under these laws, the company and/or its subsidiaries may be required to remediate the effects of certain manufacturing activities on the environment.
The company and certain of its group companies and former group companies are involved as a party in legal proceedings, regulatory and other governmental proceedings, including discussions on potential remedial actions, relating to such matters as competition issues, commercial transactions, product liability, participations, and environmental pollution.
While it is not feasible to predict or determine the outcome of all pending or threatened legal proceedings, regulatory and governmental proceedings, the company is of the opinion that the cases described below may have, or have had in the recent past, a significant impact on the company’s consolidated financial position, results of operations and cash flows.
In May 2023, the company reached a settlement with the US Securities and Exchange Commission (SEC) to resolve the SEC inquiry regarding alleged tender irregularities in the medical device industry in China, for which the company had recorded a provision of approximately EUR 60 million in 2022. The settlement reached was in line with the amount provided for. In addition, the previously disclosed SEC inquiry regarding alleged similar conduct in Brazil and Bulgaria has been discontinued. The US Department of Justice (DOJ) has closed its parallel inquiry into these matters.
In February 2023, the company received a statement of objections from the French Competition Authority (FCA) initiating a formal investigation to verify whether the company and certain other manufacturers of small domestic appliances breached antitrust rules in France in the period 2009-2014 through the alleged exchange of commercially sensitive information. The company filed its response to the statement of objections denying such allegations in May 2023 and is continuing to defend itself. The FCA is expected to organize a hearing and issue its decision in 2024. It is the company’s assessment that it is possible but not probable that this matter could lead to an outflow of economic resources. Given the uncertain outcome of the investigation and subsequent proceedings, the company is not able to reliably estimate the financial impact, if any, and no provision has been recognized as of December 31, 2023.
On June 14, 2021, Philips’ subsidiary Philips RS North America LLC (Philips Respironics) issued a voluntary recall notification in the United States and field safety notice outside the United States for specific Philips Respironics CPAP, Bi-Level PAP, and mechanical ventilator devices (the “Recalled Devices”).
On August 26, 2021, the US Food and Drug Administration (FDA) commenced an inspection of the Philips Respironics manufacturing facility in Murrysville, Pennsylvania and provided Philips Respironics with its preliminary inspectional observations on November 9, 2021. Philips Respironics responded to the FDA's inspectional observations in December 2021, which described the actions already taken by the company, as well as additional planned actions. Philips Respironics is also providing periodic updates to the FDA on its progress for the planned actions. In July 2022, Philips started discussions with the DOJ, acting on behalf of the FDA on a consent decree that would, among other things, address compliance requirements for future sales, the resolution of the inspectional findings and the completion of the recall. On January 29, 2024, Philips announced that it agrees on the terms of a consent decree with the DOJ, representing the FDA. For further details please see Subsequent events.
On April 8, 2022, Philips Respironics and certain of Philips' subsidiaries in the US received a subpoena from the DOJ to provide information related to events leading to the Respironics recall. The relevant subsidiaries are cooperating with the investigation. The criminal and civil investigation is being conducted by the DOJ's Consumer Protection Branch and Civil Fraud Section, and the US Attorney’s Office for the Eastern District of Pennsylvania. Given the early stages of the investigation, the company is not able to reliably estimate the financial impact, if any.
Following the voluntary recall notification, a number of civil complaints have been filed in several jurisdictions against Philips Respironics and certain of its affiliates (including the company) generally alleging economic loss, personal injury and/or the potential for personal injury allegedly caused by the Recalled Devices.
In the United States, consumer and commercial class action lawsuits have been filed alleging economic loss and medical monitoring claims. Individual personal injury lawsuits have also been filed. On October 8, 2021, a Multi-District Litigation (MDL) in the US District Court for the Western District of Pennsylvania was formed, and most of these class action and personal injury lawsuits have been consolidated in the MDL for pre-trial proceedings. As of December 31, 2023, plaintiffs have filed a consolidated economic loss class action complaint on behalf of device users, hospitals, and insurers and other third-party payers, a consolidated medical monitoring class action complaint on behalf of device users, and over 600 individual personal injury complaints. The company anticipates that the number of individual personal injury complaints will continue to increase in 2024.
On September 7, 2023, Philips Respironics reached agreement on a class action settlement in relation to the economic loss class action complaint, for which the company recorded a EUR 575 million provision in the first quarter of 2023. Under the agreement, which was preliminarily approved by the US District Court for the Western District of Pennsylvania on October 10, 2023, the Philips defendants will provide predefined cash awards to all eligible participants in the US depending on the type of device, extended warranties on all remediated devices provided as part of Respironics’ recall program, and an additional cash award if they return the Recalled Device to Philips Respironics. The settlement also provides for compensation for individuals who acquired replacement devices in the market after the recall and prior to the announcement of the settlement. The settlement also provides for compensation to private insurers and other third-party payers. The final cost of the settlement may vary based on, among other things, how many patients and other settlement class members participate in the settlement. The final approval hearing is scheduled for April 11, 2024.
In September 2022, the MDL court established a voluntary, court-approved census registry, and associated tolling, for potential claimants who have not filed claims, but may file claims in the future, relating to the Recalled Devices. The census registry replaced the private tolling agreement that had been in effect before the establishment of the census registry. At the time of termination, approximately 60,000 individuals had entered into the private tolling agreement. In the event these individuals wish to pursue or preserve their claims, they will need to file a lawsuit or register on the census registry. By December 31, 2023, approximately 57,000 individuals had joined the census registry. The company anticipates that the number of individuals on the census registry will increase in 2024. To better assess the claimed injuries and their relation, if any, to use of the Recalled Devices, Philips Respironics is working to require census registrants to supplement the information they are required to submit in the census registry established by the MDL court.
In Australia, a consumer class action lawsuit alleging personal injury was filed against the company’s subsidiary Philips Electronics Australia Ltd on October 4, 2021. In the course of 2022, the plaintiff in the case sought leave of the court to discontinue the class action citing that there is insufficient evidence to warrant the continuation of the class action and that since the issue of proceedings, Philips Respironics has been repairing, replacing, or (partially) refunding the devices which are the subject of the recall, meaning that any compensation relating to financial loss would be relatively confined. During the process for withdrawal of the case, a new lead plaintiff came forward in the second half of 2023 and is now continuing the class action.
Philips Respironics and certain of its affiliates (including the company) are also defendants in consumer class action lawsuits in Canada and Israel and collective actions in Chile, France and the Netherlands alleging economic loss and/or personal injury. In Canada, where various class actions had been filed, the court issued a decision on a carriage motion in April 2023, deciding that a class action filed in British Columbia may continue as a nationwide class action while defendants are seeking for all other class actions to be stayed.
While the company believes it is probable that these lawsuits will in the aggregate lead to an outflow of economic resources for Philips Respironics or other Philips entities, given the significant uncertainty regarding the nature of the relevant events and potential obligations, the company is not currently able to reliably estimate the amount of the obligation associated with these various lawsuits. The final outcome of the lawsuits and the cost to resolve them cannot currently be determined due to a number of variables, including uncertainty regarding the ultimate number of claimants and their allegations. Moreover, Philips Respironics has not yet completed its test and research program, including the additional testing requested by the FDA, for the Recalled Devices.
For the United States specifically, the lack of clarity around the nature of the specific injury each census registrant is claiming and its relation, if any, to use of the Recalled Devices contribute to the uncertainty. In addition, the MDL court has not yet decided several significant motions, and plaintiffs have not yet filed their motion for class certification in the medical monitoring action. Further, while document discovery has progressed, expert discovery has not yet begun, and the Court has not yet been asked to decide the question of whether any of the claimed injuries could have been caused by use of the Recalled Devices. An adverse outcome with respect to any or all of these lawsuits and/or any future claims could have a material impact on the company’s consolidated financial position, results of operations and cash flows.
The company has product liability insurance in place that it expects to partially cover product liability-related cash outflows. Based on ongoing discussions with certain insurance carriers that took place during 2023, management of the company concluded that the likelihood of cash inflows changed to probable, but (consistent with prior periods) not virtually certain. Given the uncertainties associated with the cash outflows of the above claims and the applicable conditions of insurance coverage, no reliable estimate can be made or disclosed in relation to the expected insurance recovery.
On August 16, 2021, a securities class action complaint was filed against the company, its former CEO and its CFO in the US District Court for the Eastern District of New York alleging violations of the Securities Exchange Act of 1934 causing damage to investors. On January 3, 2022, the lead plaintiff in the case filed its amended complaint seeking to represent individuals that purchased Philips shares between February 23, 2016, through November 12, 2021. Following the filing and briefing of the company’s motion to dismiss in the first half of 2022, plaintiff filed a second amended complaint on November 30, 2022, naming an additional defendant and expanding the alleged damage period to include certain share price declines that were allegedly based on disclosures made in 2022. The second amended complaint now focuses on share price declines that allegedly occurred as a result of various disclosures starting on April 26, 2021 through October 2022. The company's motion to dismiss the second amended complaint was filed in the first quarter of 2023. As of December 31, 2023, that motion is still pending with the Court.
In the Netherlands, in addition to the September 2022 letter from shareholders representative organization European Investors-VEB, holding the company and its directors liable for an alleged failure to make timely disclosures in relation to the Respironics recall, the company received letters from two other parties with similar allegations. As of December 31, 2023, no formal claims have been filed in this respect.
It is the company’s assessment that it is possible but not probable that these cases could lead to a certain outflow of economic resources. The company is not able to reliably estimate the financial impact, if any. An adverse outcome of these cases could have a material impact on the company’s consolidated financial position, results of operations and cash flows.
On October 12, 2021, SoClean, a company offering ozone-based cleaning products for sleep devices, filed a lawsuit against the company and certain of its affiliates alleging that the defendants’ statements about the potential adverse effect ozone cleaning may have on the Recalled Devices has significantly damaged its business. Philips believes that the claim is without merit and will vigorously defend itself. In November 2023, the Court ruled on one of the motions to dismiss filed by defendants and partially dismissed some of SoClean’s claims. On January 4, 2024, Philips and its affiliates filed their answer and counterclaims against SoClean and one of its affiliates.
In addition, some of Philips Respironics’ business partners such as distributors and durable medical equipment providers have filed or threatened to file claims alleging economic losses suffered as a consequence of the voluntary recall. Philips Respironics is engaging with certain of its business partners on the level of compensation they allege to be entitled to under Philips Respironics’ replacement program of the Recalled Devices.
It is the company’s assessment that it is possible but not probable that these cases could lead to a certain outflow of economic resources. The company is not able to reliably estimate the financial impact, if any. In the event of an adverse outcome, these matters could have a material impact on the company’s consolidated financial position, results of operations and cash flows.
To date, other than for the economic loss class action settlement, no provisions have been recorded for the litigation and investigations associated with the Respironics field action.
In the second half of 2023, Electro Medical Systems S.A., a manufacturer of among others medical devices for dental prophylaxis, filed a lawsuit against the company alleging that the company materially breached its duties under a cooperation agreement entered into between the parties in 2016, claiming damages in excess of EUR 300 million, alleging loss of profit and lost increase in brand value. Philips disagrees with the allegations and will vigorously defend itself.
For details on other contractual obligations, please refer to liquidity risk in Details of treasury and other financial risks.
In the normal course of business, Philips purchases and sells goods and services from/to various related parties in which Philips typically holds between 20% and 50% equity interest and has significant influence. These transactions are generally conducted with terms comparable to transactions with third parties.
Philips Group
Related-party transactions
in millions of EUR
| 2021 | 2022 | 2023 | |
|---|---|---|---|
| Sales of goods and services | 116 | 111 | 106 |
| Purchases of goods and services | 41 | 46 | 42 |
| Receivables from related parties | 40 | 55 | 18 |
| Payables to related parties | 2 | 2 | 2 |
The above table includes sales transactions between Philips and PMC of EUR 87 million in 2023 (2022: EUR 101 million; 2021: EUR 106 million), under which PMC has leased the equipment to the ultimate customer. In addition, as part of its S&RC operations in the US, Philips Medical Capital LLC funded durable medical equipment (DMEs) providers, through loans and leases. PMC-funded transactions these DMEs entered into with Philips amount to EUR 117 million in 2023 (2022: EUR 117 million; 2021: EUR 162 million). The associated costs of these funding transactions are borne by the ultimate customer and settled directly with Philips Medical Capital LLC. Philips Medical Capital LLC, a Pennsylvania limited liability company, is owned 60% by De Lage Landen Financial Services, Inc. (DLL) and 40% by Philips Electronics North America Corporation (Philips).
On August 14, 2023, it was announced that Exor N.V. acquired a 15% minority stake in Philips’ shares and entered into a relationship agreement with the company. This relationship agreement includes Exor’s right to propose one member to the Supervisory Board. It is expected that the Supervisory Board will, upon Exor’s exercise of its right, submit a proposal for the appointment of the relevant nominee at the upcoming 2024 Annual General Meeting of Shareholders. Upon such appointment, Exor will be considered a related party for reporting purposes.
In light of the composition of the Executive Committee, the company considers the members of the Executive Committee and the Supervisory Board to be the key management personnel as defined in IAS 24 Related Party Disclosures.
For remuneration details of the Executive Committee, the Board of Management and the Supervisory Board see Information on remuneration.
For Post-employment benefit plans see Post-employment benefits.
Philips share-based compensation is an equity-settled plan comprising restricted and performance shares. The restricted shares are subject to a three-year service condition and the performance shares include both market and non-market-based performance conditions, in addition to a three-year service condition. These shares are awarded to the Executive Committee and Senior Management.
The grant date fair value of market-based performance shares is determined through a Monte Carlo valuation model. The grant date fair value of non-market-based performance shares and restricted shares is determined as the share price at the grant date as participants receive notional dividends throughout the vesting period. The costs of share-based compensation plans are revised for expected performance (non-market-based performance shares) and forfeiture and are spread evenly over the service period.
In 2023, an additional non-recurring retention option grant was issued for certain key employees. This grant has an exercise price that was 15% higher than the share price at grant and will vest in two years and expires ten years after the grant date. The grant date fair value was calculated using the Black-Scholes-Merton option valuation model.
Share-based compensation is recognized over the service period as personnel expense in the consolidated statement of income, with a corresponding increase to equity.
The use of a valuation model to determine market-based performance share fair value requires estimates for the expected volatility of the Philips share price and correlation among input variables.
At each reporting date, Philips calculates the expected realization the of non-market-based performance targets and revises the expected share-based compensation expense. The cumulative effect is recorded in the consolidated statement of income with a corresponding adjustment in equity.
No expense is recognized for awards that do not ultimately vest because non-market performance and/or service conditions have not been met.
The purpose of the share-based compensation plans is to align the interests of management with those of shareholders by providing incentives to improve the company’s performance on a long-term basis, thereby increasing shareholder value.
The company has the following plans:
Since 2013 the Board of Management and other members of the Executive Committee are only granted performance shares*). Performance shares as well as restricted shares can be granted to executives, certain selected employees and new employees. Prior to 2013, options were also granted.
Under the terms of employee stock purchase plans established by the company in various countries, employees are eligible to purchase a limited number of Philips shares at discounted prices through payroll withholdings.
Share-based compensation costs were EUR 97 million (2022: EUR 104 million; 2021: EUR 115 million). This includes the employee stock purchase plan of EUR 9 million, which is not a share-based compensation that affects equity. In the Consolidated statements of changes in equity EUR 88 million is recognized in 2023 and represent the costs of the share-based compensation plans. The amount recognized as an expense is adjusted for forfeiture. USD-denominated performance shares, restricted shares and options are granted to employees in the United States only.
The performance is measured over a three-year performance period. The performance shares have three performance conditions, relative Total Shareholders’ Return ('TSR') compared to a peer group of 20 companies including Philips (2022: 20 companies; 2021: 20 companies, 2020: 20 companies), adjusted Earnings Per Share growth**) ('EPS') and a sustainability criterion. The criterion is based on three Sustainable Development Goals ('SDG') as defined by the United Nations that are included in Philips’ strategy on sustainability (refer to Environment, Social and Governance). The performance conditions are weighted as follows: TSR 50%, EPS 40% and SDG 10%.
The performance shares vest three years after the grant date. The number of performance shares that will vest is dependent on achieving the performance conditions provided that the grantee is still employed with the company.
The amount recognized as an expense is adjusted for actual performance of adjusted EPS growth**) and the actual realization of the SDGs since these are non-market performance conditions. It is not adjusted for non-vesting or extra vesting of performance shares due to a relative TSR performance that differs from the performance anticipated at the grant date, since this is a market-based performance condition.
The fair value of the performance shares is measured based on Monte-Carlo simulation, which takes into account dividend payments between the grant date and the vesting date by including reinvested dividends as well as the market conditions expected to impact relative Total Shareholders’ Return performance in relation to selected peers. The following weighted-average assumptions were used for the 2023 grants:
The assumptions were used for these calculations only and do not necessarily represent an indication of Management’s expectation of future developments for other purposes. The company has based its volatility assumptions on historical experience measured over a ten-year period.
A summary of the status of the company’s performance share plans as of December 31, 2023 and changes during the year are presented in the following table:
Philips Group
Performance shares
| 2022 | 2023 | |||
|---|---|---|---|---|
| shares | weighted average grant-date fair value | shares | weighted average grant-date fair value | |
| EUR-denominated | ||||
| Outstanding as of January 1 | 3,097,713 | 45.28 | 4,385,837 | 33.13 |
| Granted | 2,323,435 | 20.55 | 2,299,280 | 23.65 |
| Notional dividends1) | 155,067 | 33.91 | 240,977 | 27.15 |
| Vested/Issued | (434,329) | 40.90 | (154,987) | 44.08 |
| Forfeited | (233,556) | 38.67 | (489,295) | 27.05 |
| Adjusted quantity2) | (522,493) | 40.48 | (889,777) | 44.27 |
| Outstanding as of December 31 | 4,385,837 | 33.13 | 5,392,035 | 27.22 |
| USD-denominated | ||||
| Outstanding as of January 1 | 2,005,000 | 51.48 | 2,749,983 | 36.66 |
| Granted | 1,530,585 | 21.93 | 1,667,812 | 25.96 |
| Notional dividends1) | 98,883 | 37.15 | 152,750 | 29.78 |
| Vested/Issued | (248,848) | 45.23 | (121,760) | 48.33 |
| Forfeited | (309,570) | 44.04 | (596,846) | 28.95 |
| Adjusted quantity2) | (326,066) | 45.26 | (590,890) | 48.28 |
| Outstanding as of December 31 | 2,749,983 | 36.66 | 3,261,048 | 29.73 |
As of December 31, 2023, a total of EUR 102 million of unrecognized compensation costs relate to non-vested performance shares (as of December 31, 2022 EUR 103 million; as of December 31, 2021 EUR 110 million). These costs are expected to be recognized over a weighted-average period of 1.98 years.
The fair value of restricted shares is equal to the share price at grant date. The company issues restricted shares that, in general, have a 3 year cliff-vesting period provided that the grantee is still employed with the company.
A summary of the status of the company’s restricted shares as of December 31, 2023 and changes during the year are presented in the following table:
Philips Group
Restricted shares
| 2022 | 2023 | |||
|---|---|---|---|---|
| shares | weighted average grant-date fair value | shares | weighted average grant-date fair value | |
| EUR-denominated | ||||
| Outstanding as of January 1 | 1,618,488 | 39.93 | 2,321,250 | 30.73 |
| Granted | 1,349,003 | 22.03 | 1,471,975 | 16.35 |
| Notional dividends1) | 81,500 | 35.67 | 135,791 | 27.98 |
| Vested/Issued | (540,930) | 35.82 | (595,796) | 35.07 |
| Forfeited | (186,811) | 35.06 | (337,968) | 24.46 |
| Outstanding as of December 31 | 2,321,250 | 30.73 | 2,995,252 | 23.39 |
| USD-denominated | ||||
| Outstanding as of January 1 | 1,611,021 | 46.26 | 2,345,263 | 33.87 |
| Granted | 1,463,855 | 23.60 | 1,284,761 | 17.72 |
| Notional dividends1) | 83,151 | 39.37 | 126,498 | 31.12 |
| Vested/Issued | (541,336) | 41.48 | (679,430) | 37.83 |
| Forfeited | (271,427) | 38.51 | (422,899) | 26.79 |
| Outstanding as of December 31 | 2,345,263 | 33.87 | 2,654,193 | 26.04 |
As of December 31, 2023, a total of EUR 63 million of unrecognized compensation costs relate to non-vested restricted shares (as of December 31, 2022 EUR 72 million; as of December 31, 2021 EUR 66 million). These costs are expected to be recognized over a weighted-average period of 1.80 years.
In previous years, the company granted options that expire after ten years. These options vest after three years, provided that the grantee is still employed with the company. All outstanding options have vested under this option plan and as of December 31, 2022, there were 55,000 Accelerate! EUR-denominated options with weighted average exercise price of EUR 22.43, 750 EUR-denominated options with weighted average exercise price of EUR 22.43, and 1,950 USD-denominated options with weighted average exercise price of USD 30.27 exercisable. All outstanding options under this plan have expired as of December 31, 2023.
Since all the outstanding options have expired in 2023, there were no cash received from exercises under the company's previous option plans including Accelerate! options (2022: EUR 7 million, 2021: EUR 10 million) and no actual tax deductions realized as a result of options exercises including Accelerate! options (2022: EUR 0.7 million, 2021: EUR 1 million).
In April 2023, the Company granted non-recurring retention options that expire after ten years. These options vest after two years, provided that the grantee is still employed with the company.
The fair value of the options under this plan is measured based on Black-Scholes-Merton option pricing model. The following table list the inputs to the model used for the options granted:
Philips Group
Black-Scholes-Merton option pricing model inputs
| EUR-denominated listed share | USD-denominated listed share | |
|---|---|---|
| Share price at grant date | EUR 18.24 | USD 21.12 |
| Exercise price | EUR 22.16 | USD 24.42 |
| Risk-free interest rate | 2.37% | 3.5% |
| Expected dividend yield | 4.45% | 4.45% |
| Expected option life | 6 years | 6 years |
| Expected share price volatility | 30.47% | 32.31% |
The fair value of a EUR-denominated option was EUR 2.61 and the fair value of a USD-denominated option was USD 3.89.
The assumptions were used for these calculations only and do not necessarily represent an indication of Management’s expectation of future developments for other purposes.
The Company has based its volatility assumptions on historical experience for a period equal to the expected life of the options. The expected life of the options is calculated as the average between vesting period (2 years) and the total contractual life (10 years).
The following tables summarize information about the company’s options as of December 31, 2023 and changes during the year:
Philips Group
Options on EUR-denominated listed share
| options | weighted average exercise price | |
|---|---|---|
| Granted on April 28, 2023 | 3,831,000 | 22.16 |
| Forfeited | (171,000) | 22.16 |
| Outstanding as of December 31, 2023 | 3,660,000 | 22.16 |
There were no exercisable EUR-denominated options as of December 31, 2023. The weighted average remaining contractual term for options outstanding and options exercisable as of December 31, 2023, was 9.3 years.
Philips Group
Options on USD-denominated listed share
| options | weighted average exercise price | |
|---|---|---|
| Granted on April 28, 2023 | 2,179,500 | 24.42 |
| Forfeited | (250,500) | 24.42 |
| Outstanding as of December 31, 2023 | 1,929,000 | 24.42 |
There were no exercisable USD-denominated options as of December 31, 2023. The weighted average remaining contractual term for options outstanding and options exercisable as of December 31, 2023, was 9.3 years.
As of December 31, 2023, a total of EUR 11 million of unrecognized compensation costs relate to outstanding options. These costs are expected to be recognized over a weighted-average period of 1.3 years.
Philips Group
Outstanding options
in millions of EUR unless otherwise stated
| number of options | intrinsic value | weighted average remaining contractual term in years | |
|---|---|---|---|
| EUR-denominated | |||
| 20-25 | 3,660,000 | 0 | 9.3 |
| Outstanding options | 3,660,000 | 0 | 9.3 |
| USD-denominated | |||
| 20-25 | 1,929,000 | 0 | 9.3 |
| Outstanding options | 1,929,000 | 0 | 9.3 |
In 2023, the total remuneration costs relating to the members of the Executive Committee (consisting of 16 members throughout the year, including the members of the Board of Management) amounted to EUR 32.8 million (2022: EUR 25.6 million; 2021: EUR 33.4 million) consisting of the elements in the following table.
Philips Group
Remuneration costs of the Executive Committee1)
in EUR
| 2021 | 2022 | 2023 | |
|---|---|---|---|
| Base salary/Base compensation | 9,598,588 | 9,528,279 | 8,729,458 |
| Annual incentive2) | 5,250,408 | 208,370 | 11,405,130 |
| Performance shares3) | 12,610,073 | 11,242,581 | 7,272,815 |
| Stock options | 13,358 | ||
| Restricted share rights3) | 1,380,644 | 1,191,529 | 1,907,511 |
| Pension allowances4) | 2,107,953 | 1,949,204 | 1,346,937 |
| Pension scheme costs | 306,694 | 288,179 | 260,554 |
| Other compensation5) | 2,104,044 | 1,216,163 | 1,900,224 |
| Total | 33,358,405 | 25,624,305 | 32,835,987 |
As of December 31, 2023, the members of the Executive Committee (including the members of the Board of Management) held 0 stock options (2022: 0; 2021: 184,900).
In 2023, the total remuneration costs relating to the members of the Board of Management amounted to EUR 9.9 million (2022: EUR 8.4 million; 2021: EUR 10.3 million), see the following table.
Philips Group
Remuneration costs of individual members of the Board of Management
in EUR
| base compensation/salary | annual incentive1) | performance shares2) | restricted share rights2) | pension allowances3) | pension scheme costs | other compensation | total costs | |
|---|---|---|---|---|---|---|---|---|
| 2023 | ||||||||
| R. Jakobs | 1,200,000 | 2,004,480 | 968,922 | 267,798 | 31,891 | 109,256 | 4,582,347 | |
| A. Bhattacharya | 810,000 | 1,075,939 | 793,429 | 197,133 | 31,891 | 94,516 | 3,002,907 | |
| M.J. van Ginneken | 630,000 | 846,922 | 614,840 | 125,298 | 31,891 | 53,446 | 2,302,397 | |
| 2,640,000 | 3,927,341 | 2,377,191 | 590,228 | 95,673 | 257,218 | 9,887,650 | ||
| 2022 | ||||||||
| R. Jakobs4) | 256,438 | 112,737 | 57,973 | 6,012 | 11,507 | 444,667 | ||
| F.A. van Houten4) | 1,041,849 | 208,370 | 2,930,068 | 444,051 | 22,121 | 42,533 | 4,688,992 | |
| A. Bhattacharya | 806,250 | 763,140 | 237,250 | 28,133 | 61,308 | 1,896,081 | ||
| M.J. van Ginneken | 626,250 | 585,490 | 141,622 | 28,133 | 35,343 | 1,416,837 | ||
| 2,730,788 | 208,370 | 4,391,434 | 880,896 | 84,398 | 150,691 | 8,446,577 | ||
| 2021 | ||||||||
| F.A. van Houten | 1,325,000 | 850,915 | 2,626,295 | 565,403 | 27,462 | 57,224 | 5,452,299 | |
| A. Bhattacharya | 790,000 | 360,103 | 1,172,533 | 233,857 | 27,462 | 68,908 | 2,652,864 | |
| M.J. van Ginneken | 605,000 | 317,192 | 886,035 | 150,755 | 27,462 | 42,610 | 2,029,054 | |
| 2,720,000 | 1,528,211 | 4,684,863 | 950,014 | 82,387 | 168,742 | 10,134,217 |
The accumulated annual pension entitlements and the pension costs of individual members of the Board of Management are as follows:
Philips Group
Accumulated annual pension entitlements and pension-related costs
in EUR unless otherwise stated
| age at December 31, 2023 | accumulated annual pension as of December 31, 2023 | total pension related costs | |
|---|---|---|---|
| R. Jakobs | 49 | 56,383 | 299,689 |
| A. Bhattacharya | 62 | 40,324 | 229,024 |
| M.J. van Ginneken | 50 | 53,769 | 157,189 |
| Pension costs | 685,901 |
When pension rights are granted to members of the Board of Management, necessary payments (if insured) and all necessary provisions are made in accordance with the applicable accounting principles. In 2023, no (additional) pension benefits were granted to former members of the Board of Management.
The remuneration of the members of the Supervisory Board amounted to EUR 1.5 million (2022: EUR 1.5 million; 2021: EUR 1.3 million). Former members received no remuneration.
The members of the Supervisory Board do not receive any share-based remuneration. Therefore, as of December 31, 2023 the members of the Supervisory Board held no stock options, performance shares or restricted shares.
The individual members of the Supervisory Board received, by virtue of the positions they held, the following remuneration:
Philips Group
Remuneration of the Supervisory Board
in EUR
| membership | committees | other compensation1) | total | |
|---|---|---|---|---|
| 2023 | ||||
| F. Sijbesma | 155,000 | 35,000 | 16,345 | 206,345 |
| P.A.M. Stoffels | 115,000 | 35,000 | 22,269 | 172,269 |
| D.E.I. Pyott | 100,000 | 35,000 | 19,769 | 154,769 |
| A.M. Harrison | 100,000 | 14,000 | 19,769 | 133,769 |
| M.E. Doherty | 100,000 | 27,000 | 27,269 | 154,269 |
| P. Löscher | 100,000 | 32,000 | 17,269 | 149,269 |
| I. Nooyi | 100,000 | 14,000 | 17,269 | 131,269 |
| S.K. Chua | 100,000 | 18,000 | 22,269 | 140,269 |
| H. Verhagen | 100,000 | 14,000 | 7,269 | 121,269 |
| S. Poonen | 100,000 | 18,000 | 19,769 | 137,769 |
| 1,070,000 | 242,000 | 189,266 | 1,501,266 | |
| 2022 | ||||
| F. Sijbesma | 155,000 | 35,000 | 16,345 | 206,345 |
| P.A.M. Stoffels | 115,000 | 35,000 | 27,269 | 177,269 |
| N. Dhawan | 35,616 | 6,411 | 5,808 | 47,836 |
| D.E.I. Pyott | 100,000 | 35,000 | 17,269 | 152,269 |
| A.M. Harrison | 100,000 | 14,000 | 12,269 | 126,269 |
| M.E. Doherty | 100,000 | 27,000 | 24,769 | 151,769 |
| P. Löscher | 100,000 | 32,000 | 24,769 | 156,769 |
| I. Nooyi | 100,000 | 14,000 | 17,269 | 131,269 |
| S.K. Chua | 100,000 | 18,000 | 22,269 | 140,269 |
| H. Verhagen | 100,000 | 14,000 | 7,269.0 | 121,269 |
| S. Poonen | 100,000 | 18,000 | 17,269 | 135,269 |
| 1,105,616 | 248,411 | 192,574 | 1,546,602 | |
| 2021 | ||||
| J. van der Veer | 53,507 | 12,082 | 3,916 | 69,505 |
| C.A. Poon | 39,699 | 16,915 | 783 | 57,397 |
| N. Dhawan | 100,000 | 18,000 | 2,269 | 120,269 |
| O. Gadiesh | 34,521 | 4,833 | 783 | 40,137 |
| D.E.I. Pyott | 100,000 | 36,370 | 2,269 | 138,639 |
| P.A.M. Stoffels | 109,863 | 27,808 | 4,769 | 142,440 |
| A.M. Harrison | 100,000 | 14,000 | 2,269 | 116,269 |
| M.E. Doherty | 100,000 | 27,000 | 4,769 | 131,769 |
| P. Löscher | 100,000 | 32,000 | 4,769 | 136,769 |
| F. Sijbesma | 141,301 | 27,808 | 8,237 | 177,346 |
| I. Nooyi | 100,000 | 14,000 | 2,269 | 116,269 |
| S.K. Chua | 65,753 | 11,836 | 1,492 | 79,081 |
| 1,044,644 | 242,652 | 38,595 | 1,325,891 |
Members of the Supervisory Board and of the Board of Management are prohibited from writing call and put options or similar derivatives of Philips securities.
| December 31, 2022 | December 31, 2023 | |
|---|---|---|
| R. Jakobs | 109,422 | 126,809 |
| A. Bhattacharya | 169,517 | 177,088 |
| M.J. van Ginneken | 123,914 | 129,447 |
| P. Stoffels | 17,000 | 17,759 |
| S. Poonen | 3,000 | 3,133 |
| I. Nooyi | 3,100 | 3,238 |
| D. Pyott | 19,000 | 19,848 |
| S.K. Chua | 2,000 | 2,089 |
| F. Sijbesma | 12,500 | 25,000 |
| M. Harrison | 1,500 | 1,567 |
| P. Löscher | 20,732 | 21,658 |
For financial reporting purposes, financial instruments are categorized into Level 1, 2 or 3, based on the degree to which the inputs to the fair value measurements are observable and the significance of the inputs to the fair value measurement in its entirety, which are as follows:
Transfers between levels of the fair value hierarchy are recognized at the end of the reporting period during which the change has occurred.
Financial assets and liabilities are offset and the net amount is reported in the balance sheet when, and only when, the company has currently a legally enforceable right to set-off the amounts and the group intends either to settle them on a net basis or to realize the asset and settle the liability simultaneously.
Determining the fair value of financial instruments requires the use of estimates according to the method applied for each type of financial asset of liability. The estimated fair value of financial instruments has been determined by the company using available market information and appropriate valuation methods. The estimates presented are not necessarily indicative of the amounts that will ultimately be realized by the company upon maturity or disposal. The use of different market assumptions and/or estimation methods may have a material effect on the estimated fair value amounts.
Specific valuation techniques used to value financial instruments include:
Level 1
Instruments included in level 1 are comprised primarily of listed equity investments classified as financial assets carried at fair value through profit or loss or carried at fair value through other comprehensive income. The fair value of financial instruments traded in active markets is based on quoted market prices at the balance sheet date. A market is regarded as active if quoted prices are readily and regularly available from an exchange, dealer, broker, industry group, pricing service, or regulatory agency, and those prices represent actual and regularly occurring market transactions on an arm’s length basis.
Level 2
The fair value of financial instruments that are not traded in an active market (for example, over-the-counter derivatives or convertible bond instruments) is determined by using valuation techniques. These valuation techniques maximize the use of observable market data where it is available and rely as little as possible on entity-specific estimates. If all significant inputs required to fair value an instrument are based on observable market data, the instrument is included in level 2. The fair value of derivatives is calculated as the present value of the estimated future cash flows based on observable interest yield curves, basis spread and foreign exchange rates. The valuation of convertible bond instruments uses observable market quoted data for the options and present value calculations using observable yield curves for the fair value of the bonds.
The fair value of debt is estimated on the basis of the quoted market prices for certain issuances, or on the basis of discounted cash flow analysis using market rates plus Philips’ spread for the particular tenors of the borrowing arrangement. Accrued interest is not included within the carrying amount or estimated fair value of debt.
Level 3
If one or more of the significant inputs are not based on observable market data, such as third-party pricing information without adjustments, the instrument is included in level 3.
The fair value of contingent consideration is dependent on the terms of the respective acquisition agreement that may require Philips to pay additional consideration to former shareholders if specified future events occur or conditions are met, such as the achievement of certain regulatory milestones or the achievement of certain commercial milestones. The fair value of the contingent consideration provision is generally determined using a probability-weighted and a risk-adjusted approach to estimate the achievement of future regulatory and commercial milestones, respectively. The discount rates used in the risk adjusted approach reflect the inherent risk related to achieving the commercial milestones. Both regulatory and commercial milestones are discounted for the time value of money at risk-free rates. The fair value measurement is based on management’s estimates and assumptions and hence classified as Level 3 in the fair value hierarchy.
The following tables show the carrying amounts and fair values of financial assets and financial liabilities, including their levels in the fair value hierarchy. Fair value information for financial assets and financial liabilities not carried at fair value is not included if the carrying amount is a reasonable approximation of fair value.
Philips Group
Fair value of financial assets and liabilities
in millions of EUR
| carrying amount | estimated fair value1) | Level 1 | Level 2 | Level 3 | |
|---|---|---|---|---|---|
| December 31, 2023 | |||||
| Financial assets | |||||
| Carried at fair value: | |||||
| Debt instruments | 226 | 226 | 226 | ||
| Equity instruments | 2 | 2 | 2 | ||
| Other financial assets | 56 | 56 | 34 | 22 | |
| Financial assets carried at FVTP&L | 284 | 284 | 34 | 250 | |
| Debt instruments | 27 | 27 | 26 | ||
| Equity instruments | 231 | 231 | 14 | 217 | |
| Current financial assets | 3 | 3 | 3 | ||
| Receivables - current | 32 | 32 | 32 | ||
| Financial assets carried at FVTOCI | 293 | 293 | 14 | 26 | 253 |
| Derivative financial instruments | 48 | 48 | 48 | ||
| Financial assets carried at fair value | 624 | 624 | 14 | 108 | 503 |
| Carried at (amortized) cost: | |||||
| Cash and cash equivalents | 1,869 | ||||
| Loans and receivables: | |||||
| Current loans receivables | - | ||||
| Other non-current loans and receivables | 77 | ||||
| Receivables - current | 3,701 | ||||
| Receivables - non-current | 193 | ||||
| Financial assets carried at (amortized) cost | 5,840 | ||||
| Total financial assets | 6,465 | ||||
| Financial liabilities | |||||
| Carried at fair value: | |||||
| Contingent consideration | (115) | (115) | (115) | ||
| Financial liabilities carried at FVTP&L | (115) | (115) | (115) | ||
| Derivative financial instruments | (43) | (43) | (43) | ||
| Financial liabilities carried at fair value | (158) | (158) | (43) | (115) | |
| Carried at (amortized) cost: | |||||
| Accounts payable | (1,917) | ||||
| Interest accrual | (76) | ||||
| Debt (Corporate bonds and leases) | (6,969) | (6,798) | (5,724) | (1,074) | |
| Debt (excluding corporate bonds and leases) | (721) | ||||
| Financial liabilities carried at (amortized) cost | (9,682) | ||||
| Total financial liabilities | (9,840) |
Philips Group
Fair value of financial assets and liabilities
in millions of EUR
| carrying amount | estimated fair value1) | Level 1 | Level 2 | Level 3 | |
|---|---|---|---|---|---|
| December 31, 2022 | |||||
| Financial assets | |||||
| Carried at fair value: | |||||
| Debt instruments | 232 | 232 | 232 | ||
| Equity instruments | 4 | 4 | 1 | 2 | |
| Other financial assets | 86 | 86 | 35 | 51 | |
| Financial assets carried at FVTP&L | 322 | 322 | 1 | 35 | 285 |
| Debt instruments | 25 | 25 | 25 | ||
| Equity instruments | 259 | 259 | 30 | 229 | |
| Current financial assets | 9 | 9 | 9 | ||
| Receivables - current | 26 | 26 | 26 | ||
| Financial assets carried at FVTOCI | 319 | 319 | 30 | 25 | 264 |
| Derivative financial instruments | 127 | 127 | 127 | ||
| Financial assets carried at fair value | 768 | 768 | 32 | 187 | 549 |
| Carried at (amortized) cost: | |||||
| Cash and cash equivalents | 1,172 | ||||
| Loans and receivables: | |||||
| Current loans receivables | 2 | ||||
| Other non-current loans and receivables | 54 | ||||
| Receivables - current | 4,088 | ||||
| Receivables - non-current | 279 | ||||
| Financial assets carried at (amortized) cost | 5,596 | ||||
| Total financial assets | 6,364 | ||||
| Financial liabilities | |||||
| Carried at fair value: | |||||
| Contingent consideration | (113) | (113) | (113) | ||
| Financial liabilities carried at FVTP&L | (113) | (113) | (113) | ||
| Derivative financial instruments | (211) | (211) | (211) | ||
| Financial liabilities carried at fair value | (324) | (324) | (211) | (113) | |
| Carried at (amortized) cost: | |||||
| Accounts payable | (1,968) | ||||
| Interest accrual | (71) | ||||
| Debt (Corporate bonds and leases) | (6,520) | (6,083) | (5,001) | (1,082) | |
| Debt (excluding corporate bonds and leases) | (1,680) | ||||
| Financial liabilities carried at (amortized) cost | (10,240) | ||||
| Total financial liabilities | (10,564) |
The following table shows the reconciliation from the beginning balance to the end balance for Level 3 fair value measurements.
Philips Group
Reconciliation of Level 3 fair value measurements
in millions of EUR
| Financial assets | Financial liabilities | |
|---|---|---|
| Balance as of January 1, 2023 | 549 | 113 |
| Acquisitions | 6 | |
| Purchase | 85 | |
| Sales | (56) | |
| Utilizations | (20) | |
| Recognized in profit and loss: | ||
| other business income | 16 | |
| financial income and expenses1) | (43) | 1 |
| Recognized in other comprehensive income2) | (40) | (2) |
| Receivables held to collect and sell | 6 | |
| Reclassification | 1 | |
| Balance as of December 31, 2023 | 503 | 115 |
Philips Group
Reconciliation of Level 3 fair value measurements
in millions of EUR
| Financial assets | Financial liabilities | |
|---|---|---|
| Balance as of January 1, 2022 | 523 | 208 |
| Acquisitions | 96 | |
| Purchase | 131 | |
| Sales | (76) | |
| Utilizations | (105) | |
| Recognized in profit and loss: | ||
| other business income | (85) | |
| financial income and expenses | 7 | (8) |
| Recognized in other comprehensive income1) | 8 | |
| Receivables held to collect and sell | (41) | |
| Reclassification from associates | 5 | |
| Balance as of December 31, 2022 | 549 | 113 |
Transactions in derivatives are subject to master netting and set-off agreements. In the case of certain termination events, under the terms of the master agreement, Philips can terminate the outstanding transactions and aggregate their positive and negative values to arrive at a single net termination sum (or close-out amount). This contractual right is subject to the following:
Philips Group
Financial assets subject to offsetting, enforceable master netting arrangements or similar agreements
in millions of EUR
| 2022 | 2023 | |
|---|---|---|
| Derivatives | ||
| Gross amounts of recognized financial assets | 127 | 48 |
| Gross amounts of recognized financial liabilities offset in the balance sheet | ||
| Net amounts of financial assets presented in the balance sheet | 127 | 48 |
| Related amounts not offset in the balance sheet | ||
| Financial instruments | (54) | (34) |
| Net amount | 73 | 13 |
Philips Group
Financial liabilities subject to offsetting, enforceable master netting arrangements or similar agreements
in millions of EUR
| 2022 | 2023 | |
|---|---|---|
| Derivatives | ||
| Gross amounts of recognized financial liabilities | (211) | (43) |
| Gross amounts of recognized financial assets offset in the balance sheet | ||
| Net amounts of financial liabilities presented in the balance sheet | (211) | (43) |
| Related amounts not offset in the balance sheet | ||
| Financial instruments | 54 | 34 |
| Net amount | (157) | (9) |
The company uses derivative financial instruments principally to manage its foreign currency risks and, to a more limited extent, interest rate and commodity price risks. All derivative financial instruments are accounted for at the trade date and classified as current or non-current assets or liabilities based on the maturity date or the early termination date. The company measures all derivative financial instruments at fair value that is derived from the market prices of the instruments, calculated on the basis of the present value of the estimated future cash flows based on observable interest yield curves, basis spread, credit spreads and foreign exchange rates, or derived from option pricing models, as appropriate. Gains or losses arising from changes in fair value of derivatives are recognized in the Consolidated statements of income, except for derivatives that are highly effective and qualify for cash flow or net investment hedge accounting.
Changes in the fair value of foreign exchange forward contracts attributable to forward points and changes in the time value of the option contracts are deferred in the cash flow hedges reserve within equity. The deferred amounts are recognized in the Consolidated statements of income against the related hedged transaction when it occurs.
Changes in the fair value of a derivative that is highly effective and that is designated and qualifies as a cash flow hedge are recorded in OCI until the Consolidated statements of income are affected by the variability in cash flows of the designated hedged item. To the extent that the hedge is ineffective, changes in the fair value are recognized in the Consolidated statements of income.
The company formally assesses, both at the hedge’s inception and on an ongoing basis, whether the derivatives that are used in hedging transactions are highly effective in offsetting changes in fair values or cash flows of hedged items. When it is established that a derivative is not highly effective as a hedge or that it has ceased to be a highly effective hedge, the company discontinues hedge accounting prospectively. When hedge accounting is discontinued because it is expected that a forecasted transaction will not occur, the company continues to carry the derivative on the Consolidated balance sheets at its fair value, and gains and losses that were accumulated in OCI are recognized immediately in the same line item as they relate to in the Consolidated statements of income.
Foreign currency differences arising upon retranslation of financial instruments designated as a hedge of a net investment in a foreign operation are recognized directly in the currency translation differences reserve through OCI, to the extent that the hedge is effective. To the extent that the hedge is ineffective, such differences are recognized in the Consolidated statements of income.
Financial assets are subject to impairment assessment, which involves estimating expected credit losses. Refer to Other financial assets for accounting policies on impairment of financial assets.
Philips is exposed to several types of financial risks which are further analyzed below. Philips does not purchase or hold derivative financial instruments for speculative purposes. Information regarding financial instruments is included in Fair value of financial assets and liabilities.
Liquidity risk is the risk that an entity will encounter difficulty in meeting obligations associated with financial liabilities.
Liquidity risk for the group is monitored through the Treasury liquidity committee, which tracks the development of the actual cash flow position for the group and uses input from a number of sources in order to forecast the overall liquidity position on both short and longer term basis. Philips invests surplus cash in short-term deposits with appropriate maturities to ensure sufficient liquidity is available to meet liabilities when due and in money market funds.
The rating of the company’s debt by major rating agencies may improve or deteriorate. As a result, Philips’ future borrowing capacity may be influenced and its financing costs may fluctuate. Philips has various sources to mitigate the liquidity risk for the group. As of December 31, 2023, Philips had EUR 1,869 million in cash and cash equivalents (2022: EUR 1,172 million), within which short-term deposits of EUR 1,399 million (2022: EUR 482 million). Cash and cash equivalents include all cash balances, money market funds and short-term highly liquid investments with an original maturity of three months or less that are readily convertible into known amounts of cash. Philips pools cash from subsidiaries to the extent legally and economically feasible; cash not pooled remains available for the company’s operational or investment needs.
Philips faces cross-border foreign exchange controls and/or other legal restrictions in a few countries that could limit its ability to make these balances available on short notice for general use by the group.
Philips has a USD 2.5 billion Commercial Paper Program and a EUR 1 billion committed standby revolving credit facility that can be used for general group purposes, such as a backstop for its Commercial Paper Program. As of December 31, 2023, Philips did not have any loans outstanding under either facility. These facilities do not have a material adverse change clause, have no financial covenants and no credit-rating-related acceleration possibilities. As per March 9, 2020, Philips established a Euro Medium-Term Note (EMTN) program, a framework that facilitates the issuance of notes for a total amount up to EUR 10 billion. As of December 31, 2023, Philips has EUR 3.3 billion outstanding under this program of which EUR 500 million fixed rates notes were issued in August 2023 with maturity date in 2031. For a description of Philips’ credit facilities, refer to Debt.
In addition to cash and cash equivalents, as of December 31, 2023, Philips also held EUR 14 million of listed (level 1) equity investments at fair value (classified as other non-current financial assets).
The following table presents a summary of the Group’s fixed contractual cash obligations and commitments as of December 31, 2023. These amounts are an estimate of future payments which could change as a result of various factors such as a change in interest rates, foreign exchange, contractual provisions, as well as changes in business strategy and needs. Therefore, the actual payments made in future periods may vary from those presented in the following table:
| payments due by period | |||||
|---|---|---|---|---|---|
| total | less than 1 year | 1-3 years | 3-5 years | after 5 years | |
| Long-term debt | 7,615 | 533 | 1,934 | 1,431 | 3,717 |
| Short-term debt | 122 | 122 | |||
| Interest on debt | 1,704 | 180 | 328 | 285 | 911 |
| Derivative liabilities | 39 | 38 | 1 | ||
| Purchase obligations3) | 668 | 355 | 286 | 27 | |
| Trade and other payables | 1,917 | 1,917 | |||
| Contractual cash obligations | 12,065 | 3,145 | 2,549 | 1,716 | 4,655 |
Philips has contracts with investment funds where it committed itself to make, under certain conditions, capital contributions to these funds of an aggregated remaining amount of EUR 153 million (2022: EUR 127 million). As of December 31, 2023 capital contributions already made to these investment funds are recorded as non-current financial assets.
Philips offers voluntary supply chain finance programs with third parties which provide participating suppliers the opportunity to factor their trade receivables at the sole discretion of both the suppliers and the third parties. Philips continues to recognize these liabilities as trade payables and settles them accordingly on the invoice maturity date based on the terms and conditions of those arrangements. As of December 31, 2023 approximately EUR 114 million (2022: EUR 151 million) of the Philips account payable were transferred under these arrangements.
With respect to the Respironics field action, please refer to Contingencies. The management continues to monitor the risks associated with such potential claims and its impact on liquidity position, if any.
The company leases various items of real estate, vehicles and other equipment where it acts as a lessee. The company has multiple extension and termination options in a number of lease contracts. These are used to maximize operational flexibility in terms of managing the assets used in the company's operations. The options considered reasonably certain are part of lease liabilities. In addition, the company is committed to leases not yet commenced to EUR 128 million. The company's lease contracts do not contain financial covenants.
The company enters into sale-and-leaseback transactions primarily for its Sleep & Respiratory Care businesses. These transactions are accounted for at market value. The payments for these leases are considered in determining lease liabilities. Principal repayments are part of cash flows used for financing activities and interest payments are part of cash flows used for operating activities. The cash inflows arising from the sales transactions are part of cash flows provided by financing activities. Lease payments under sale-and-leaseback arrangements for 2023 were EUR 55 million (2022: EUR 72 million). The remaining minimum payment under sale-and-leaseback arrangements included in lease obligations above are as follows:
Philips Group
Remaining minimum payments under sale-and-leaseback arrangements
in millions of EUR
| 2024 | 43 |
| 2025 | 30 |
| 2026 | 21 |
| 2027 | 12 |
| 2028 | 5 |
| Thereafter | 26 |
Philips has leasing activities where it acts as lessor. In such arrangements, Philips provides the customer with a right to use of medical equipment in exchange for a series of payments. Residual values of assets under lease form an insignificant part of the carrying amount of those assets. Residual values are influenced by asset market prices and are therefore subject to management estimation. Residual values are at least reassessed on an annual basis, or more often when necessary. Reassessments are based on a combination of realization of assets sold, expert knowledge and judgment of local markets. For lease receivables, the value of unguaranteed residual values as of December 31, 2023 was EUR 0.0 million (2022: EUR 0.6 million). In order to reduce residual value risk exposures there may be residual value guarantees or purchase options embedded in the customer contract. Credit risk for lease receivables is reviewed regularly and mitigated, for example, by retaining a security interest in the leased asset.
Currency risk is the risk that reported financial performance or the fair value or future cash flows of a financial instrument will fluctuate because of changes in foreign exchange rates. Philips operates in many countries and currencies and therefore currency fluctuations may impact Philips’ financial results. Philips is exposed to currency risk in the following areas:
It is Philips’ policy to reduce the potential year-on-year volatility caused by foreign-currency movements on its net earnings by hedging the anticipated net exposure of foreign currencies resulting from foreign-currency sales and purchases. In general, net anticipated exposures for the Group are hedged during a period of 15 months in layers of 20% up to a maximum hedge of 80%. Philips’ policy requires significant committed foreign currency exposures to be fully hedged, generally using forwards. However, not every foreign currency can or shall be hedged as there may be regulatory barriers or prohibitive hedging cost preventing Philips from effectively and/or efficiently hedging its currency exposures. As a result, hedging activities cannot and will not eliminate all currency risks for anticipated and committed transaction exposures.
The following table outlines the estimated nominal value in millions of EUR for committed and anticipated transaction exposure and related hedges for Philips’ most significant currency exposures consolidated as of December 31, 2023:
Philips Group
Estimated transaction exposure and related hedges
in millions of EUR
| Sales/Receivables | Purchases/Payable | |||
|---|---|---|---|---|
| exposure | hedges | exposure | hedges | |
| Balance as of December 31, 2023 | ||||
| Exposure currency | ||||
| USD | 1,793 | (1,449) | (888) | 805 |
| JPY | 547 | (319) | (14) | 14 |
| GBP | 312 | (196) | (12) | 12 |
| CNY | 439 | (304) | (98) | 95 |
| CAD | 249 | (161) | (1) | 1 |
| PLN | 91 | (103) | ||
| AUD | 226 | (137) | ||
| CHF | 103 | (63) | (1) | 1 |
| CZK | 63 | (70) | ||
| SEK | 33 | (18) | (3) | 3 |
| EUR | 233 | (232) | (114) | 113 |
| Others | 198 | (134) | (216) | 130 |
| Total 2023 | 4,287 | (3,185) | (1,346) | 1,173 |
| Total 2022 | 3,779 | (2,920) | (1,468) | 1,326 |
Philips uses foreign exchange spot and forward contracts, as well as zero cost collars in hedging the exposure. The derivatives related to transactions are, for hedge accounting purposes, split into hedges of on-balance-sheet accounts receivable/ payable and forecasted sales and purchases. Changes in the value of on-balance-sheet foreign-currency accounts receivable/payable, as well as the changes in the fair value of the hedges related to these exposures, are reported in the income statement under costs of sales. Hedges related to forecasted transactions, where hedge accounting is applied, are accounted for as cash flow hedges. The results from such hedges are deferred in other comprehensive income within equity to the extent that the hedge is effective. As of December 31, 2023, a gain of EUR 6 million was deferred in equity as a result of these hedges (2022: EUR 2 million loss). The result deferred in equity will be released to earnings mostly during 2024 at the time when the related hedged transactions affect the income statement. During 2023, nil (2022: EUR 1 million net gain) was recorded in the consolidated statement of income as a result of ineffectiveness on certain anticipated cash flow hedges. Ineffectiveness arises when anticipated exposures are no longer expected to be highly probable. During 2023, a gain of EUR 19 million included in the cash flow hedges reserve in equity pertaining to changes in fair value of foreign exchange forward and option contracts was released to income statement.
The total net fair value of hedges related to transaction exposure as of December 31, 2023, was an unrealized gain of EUR 10 million. The estimated impact of a 10% increase of value of the EUR is estimated to be EUR 116 million. The following table contains an overview of the instantaneous 10% increase in the value of EUR against major currencies.
Philips Group
Estimated impact of 10% increase of value of the EUR on the fair value of hedges
in millions of EUR
| 2022 | 2023 | |
|---|---|---|
| USD | 68 | 64 |
| JPY | 15 | 15 |
| GBP | 16 | 16 |
| CHF | 4 | 5 |
| PLN | 2 | 1 |
| RUB | - |
The EUR 116 million increase includes a gain of EUR 40 million that would impact the income statement, which would largely offset the opposite revaluation effect on the underlying accounts receivable and payable, and the remaining gain of EUR 77 million would be recognized in equity to the extent that the cash flow hedges were effective.
Foreign exchange exposure also arises as a result of inter-company loans and deposits. Where the company enters into such arrangements, the financing is generally provided in the functional currency of the subsidiary entity. The currency of the company’s external funding and liquid assets is matched with the required financing of subsidiaries, either directly through external foreign currency loans and deposits, or synthetically by using foreign exchange derivatives, including cross currency interest rate swaps and foreign exchange forward contracts. In certain cases where group companies may also have external foreign currency debt or liquid assets, these exposures are also hedged through the use of foreign exchange derivatives. Changes in the fair value of hedges related to this exposure are recognized within financial income and expenses in the statements of income. When such loans would be considered part of the net investment in the subsidiary, net investment hedging would be applied.
Translation exposure of foreign-currency equity invested in consolidated entities is generally not hedged. If a hedge is entered into, it is accounted for as a net investment hedge. Net current-period change, before tax, of the currency translation reserve of negative EUR 579 million mainly relates to the development of the USD versus the EUR. As of December 31, 2023, a weakening of USD by 10% versus the EUR would result in a decrease in the currency translation reserve in equity of approximately EUR 1,146 million, while a strengthening of USD by 10% versus the EUR would result in an increase in the currency translation reserve in equity of approximately EUR 1,400 million. Refer to the country risk paragraph for countries with significant foreign currency denominated equity invested.
As of December 31, 2023, external bond funding for a nominal value of USD 1,474 million (liability at book value: EUR 1,325 million) was designated as a net investment hedge of financing investments in foreign operations for an equal amount. During 2023 a total loss of EUR 2 million was recognized in the income statement as ineffectiveness on net investment hedges, arising from counterparty and own credit risk.
An instantaneous 10% increase in the value of the EUR against all currencies would lead to an decrease of EUR 52 million in the value of the derivatives, including a EUR 11 million increase related to the USD.
As of December 31, 2022, cross-currency interest rate swaps for a nominal value of USD 500 million (liability at fair value: EUR 147 million) and external bond funding for a nominal value of USD 1,490 million (liability at book value: EUR 1,378 million) were designated as a net investment hedge of financing investments in foreign operations for an equal amount. During 2022 a total gain of EUR 1.1 million was recognized in the income statement as ineffectiveness on net investment hedges, arising from counterparty and own credit risk.
The total net fair value of financing derivatives as of December 31, 2022, was a liability of EUR 147 million. An instantaneous 10% increase in the value of the EUR against all currencies would lead to an increase of EUR 192 million in the value of the derivatives, including a EUR 191 million increase related to the USD.
Philips does not currently hedge the foreign exchange exposure arising from equity interests in non-functional-currency investments in associates and other non-current financial assets.
Interest rate risk is the risk that the fair value or future cash flows of a financial instrument will fluctuate because of changes in market interest rates. As of December 31, 2023, Philips had outstanding debt of EUR 7,689 million (2022: EUR 8,201 million), which constitutes an inherent interest rate risk with potential negative impact on financial results. As of December 31, 2023, Philips held EUR 1,869 million in cash and cash equivalents (2022: EUR 1,172 million), and had total long-term debt of EUR 7,035 million (2022: EUR 7,270 million) and total short-term debt of EUR 654 million (2022: EUR 931 million). As of December 31, 2023, Philips had a ratio of fixed-rate long-term debt to total outstanding debt of approximately 89% compared to 80% one year earlier. Philips debt has a long maturity profile with an average tenor of long-term debt of 6.0 years with maturities up to 2042.
The following table provides the impact of a 1% increase/decrease of interest rates on the fair value of the debt and the annualized net interest expenses.
Philips Group
Net debt1) and interest rate sensitivity
in millions of EUR
| 2022 | 2023 | |
|---|---|---|
| Impact 1% interest increase on the fair value of the fixed-rate long-term debt2)3) | (274) | (283) |
| Impact 1% interest decrease on the fair value of the fixed-rate long-term debt2)3) | 274 | 284 |
| Impact 1% interest increase on the annualized net interest expense4) | 4 | 15 |
Equity price risk is the risk that the fair value or future cash flows of a financial instrument will fluctuate because of changes in equity prices.
Philips is a shareholder in some publicly listed companies and as a result is exposed to potential financial loss through movements in their share prices. The aggregate equity price exposure in such financial assets amounted to approximately EUR 14 million as of December 31, 2023 (2022: EUR 32 million). Philips does not hold derivatives in the above-mentioned listed companies. Philips also has shareholdings in several privately-owned companies amounting to EUR 219 million, mainly consisting of minority stakes in companies in various industries. As a result, Philips is exposed to potential value adjustments.
Commodity price risk is the risk that the fair value or future cash flows of a financial instrument will fluctuate because of changes in commodity prices.
Philips is a purchaser of certain base metals, precious metals and energy. Philips may hedge certain commodity price risks using derivative instruments to minimize significant, unanticipated earnings fluctuations caused by commodity price volatility. As of December 31, 2023 and 2022, respectively, Philips did not have any significant outstanding financial commodity derivatives.
Credit risk represents the loss that would be recognized at the reporting date, if counterparties failed completely to perform their payment obligations as contracted. Credit risk is present within Philips trade receivables and contract assets. To have better insights into the credit exposures, Philips performs ongoing evaluations of the financial and non-financial condition of its customers and adjusts credit limits when appropriate. In instances where the creditworthiness of a customer is determined not to be sufficient to grant the credit limit required, there are a number of mitigation tools that can be utilized to close the gap, including reducing payment terms, cash on delivery, pre-payments and pledges on assets.
Philips invests available cash and cash equivalents with various financial institutions and is exposed to credit risk with these counterparties. Philips is also exposed to credit risks in the event of non-performance by financial institutions with respect to financial derivative instruments. Philips actively manages concentration risk and on a daily basis measures the potential loss under certain stress scenarios, should a financial institution default. These worst-case scenario losses are monitored and limited by the company.
The company does not enter into any financial derivative instruments to protect against default by financial institutions. However, where possible the company requires all financial institutions with which it deals in derivative transactions to complete legally enforceable netting agreements under an International Swap Dealers Association master agreement or otherwise prior to trading, and whenever possible, to have a strong credit rating. Philips also regularly monitors the development of the credit risk of its financial counterparties. Wherever possible, cash is invested and financial transactions are concluded with financial institutions with strong credit ratings or with governments or government-backed institutions.
The following table shows the number of financial institutions with credit rating A- and above with which Philips has cash at hand and short-term deposits above EUR 10 million as of December 31, 2023.
Philips Group
Credit risk with number of counterparties
for deposits above EUR 10 million
| 10-100 million | 100-500 million | 500 million and above | |
|---|---|---|---|
| AAA rated bank counterparties | 4 | ||
| AA- rated bank counterparties | 1 | ||
| A+ rated bank counterparties | 2 | 3 | |
| A rated bank counterparties | 2 | 1 | |
| A- rated bank counterparties | 1 | ||
| 6 | 8 |
For an overview of the overall maximum credit exposure related to debt instruments, derivatives and loans and receivables, refer to Fair value of financial assets and liabilities.
Country risk is the risk that political, legal, or economic developments in a single country could adversely impact performance. The country risk per country is defined as the sum of the equity of all subsidiaries and associated companies in country cross-border transactions, such as intercompany loans, accounts receivable from third parties and intercompany accounts receivable. The country risk is monitored on a regular basis.
As of December 31, 2023, the company had country risk exposure of EUR 13.3 billion in the United States, EUR 1.4 billion in the Netherlands, EUR 1.3 billion in China (including Hong Kong). Other countries higher than EUR 500 million are Germany EUR 786 million, United Kingdom EUR 731 million, and Japan EUR 614 million. Other countries with significant exposure are Singapore EUR 202 million and Israel EUR 214 million. The degree of risk of a country is taken into account when new investments are considered. The company does not, however, use financial derivative instruments to hedge country risk.
The impact of hyperinflation is also routinely assessed and was not material for the periods presented.
Philips is insured for a broad range of losses by global insurance policies in the areas of property damage/business interruption, general and product liability, transport, directors’ and officers’ liability, employment practice liability, crime and cybersecurity. The counterparty risk related to the insurance companies participating in the above-mentioned global insurance policies is actively managed. As a rule, Philips only selects insurance companies with a financial strength of at least A-. Throughout the year the counterparty risk is monitored on a regular basis.
To lower exposures and to avoid potential losses, Philips has a global Risk Engineering program in place. The main focus of this program is on property damage and business interruption risks including company interdependencies. Regular on-site assessments take place at Philips locations and business-critical suppliers by risk engineers of the insurer in order to provide an accurate assessment of the potential loss and its impact. The results of these assessments are shared across the company’s stakeholders. On-site assessments are carried out against the predefined Risk Engineering standards, which are agreed between Philips and the insurers. Recommendations are made in a Risk Improvement report and are monitored centrally. This is the basis for decision-making by the local management of the business as to which recommendations will be implemented.
For all policies, deductibles are in place, which vary from EUR 0 million to EUR 10 million per occurrence and this variance is designed to differentiate between the existing risk categories within Philips. Above a first layer of working deductibles, Philips operates its own re-insurance captive, which during 2023 retained EUR 25 million per claim and EUR 50 million in the annual aggregate for general, product, professional liability, and marine cargo claims and EUR 15 million aggregate for cyber.
New contracts were signed effective December 31, 2023, for the coming year, whereby the re-insurance captive retentions remained the same.
On January 29, 2024, Philips announced that it has agreed on the terms of a consent decree with the US Department of Justice (DOJ), representing the US Food and Drug Administration (FDA). The proposed consent decree primarily focuses on Philips Respironics’ business operations in the US. The proposed consent decree is being finalized and will be submitted to the relevant US court for approval. The decree will provide Philips Respironics with a roadmap of defined actions, milestones, and deliverables to demonstrate compliance with regulatory requirements and to restore the business.
As a consequence of addressing this proposed consent decree, which is a multi-year plan, Philips recorded charges of EUR 363 million in December 2023 that relate to remediation activities, inventory write-downs and onerous contract provisions. Refer to Provisions.
Company financial statements contents
Koninklijke Philips N.V.
Statements of income
in millions of EUR
For the year ended December 31
| 2022 | 2023 | |
|---|---|---|
| SalesB | 414 | 432 |
| Cost of sales | (23) | (19) |
| Gross margin | 391 | 413 |
| Selling expenses | (9) | (11) |
| General and administrative expenses | (47) | (25) |
| Other business incomeC | 68 | 116 |
| Income from operationsD | 403 | 493 |
| Financial incomeE | 130 | 166 |
| Financial expensesE | (284) | (368) |
| Income before taxes | 249 | 290 |
| Income tax (expense) benefitF | (62) | (66) |
| Income after tax | 187 | 224 |
| Results relating to investments in associatesI | (2) | (87) |
| Net income from group companies | (1,793) | (603) |
| Net income | (1,608) | (466) |
Amounts may not add up due to rounding.
Koninklijke Philips N.V.
Balance sheets
in millions of EUR
As of December 31
| 2022 | 2023 | |
|---|---|---|
| Non-current assets | ||
| Property, plant and equipment | 1 | 1 |
| Intangible assetsH | 84 | 101 |
| Financial fixed assetsI | 19,768 | 20,759 |
| Non-current receivables | 44 | 25 |
| Deferred tax assets | 531 | 502 |
| Other non-current financial assetsJ | 242 | 213 |
| Other non-current assets | 3 | 14 |
| Total non-current assets | 20,673 | 21,615 |
| Current assets | ||
| Current financial assetsJ | 9 | 3 |
| ReceivablesK | 8,297 | 2,239 |
| Cash and cash equivalentsL | 849 | 1,605 |
| Total current assets | 9,155 | 3,847 |
| Total assets | 29,829 | 25,462 |
| Shareholders' equityM | ||
| Common shares | 178 | 183 |
| Capital in excess of par value | 5,025 | 5,827 |
| Revaluation reserves | (379) | (384) |
| Other legal reserves | 2,876 | 2,252 |
| Other reserves | 7,156 | 4,615 |
| Net income | (1,608) | (466) |
| Total shareholders' equity | 13,249 | 12,028 |
| Non-current liabilities | ||
| Long-term debtN | 6,391 | 6,170 |
| Long-term provisions | - | 7 |
| Deferred tax liabilities | 16 | 13 |
| Non-current tax liabilities | 245 | 243 |
| Other non-current liabilities | 86 | 70 |
| Total non-current liabilities | 6,738 | 6,504 |
| Current liabilities | ||
| Short-term debtN | 9,463 | 6,738 |
| Other current liabilitiesO | 379 | 191 |
| Total current liabilities | 9,842 | 6,929 |
| Total liabilities and shareholders' equity | 29,829 | 25,462 |
Amounts may not add up due to rounding.
Koninklijke Philips N.V.
Statements of changes in equity
in millions of EUR
For the year ended December 31
Common shares | Capital in excess of par value | Fair value through OCI | Cash flow hedges | Currency translation differences | Affiliated companies | Retained earnings | Treasury shares | Net income | Shareholders' equity | |
|---|---|---|---|---|---|---|---|---|---|---|
| Revaluation reserves | Other legal reserves | Other reserves | ||||||||
| Balance as of December 31, 2021 | 177 | 4,646 | (344) | (25) | 1,117 | 654 | 5,371 | (476) | 3,319 | 14,438 |
| Appropriation of prior year result | 3,319 | (3,319) | ||||||||
| Net income | (1,608) | (1,608) | ||||||||
| Net current period change | (32) | (29) | 747 | 356 | (275) | 766 | ||||
| Income tax on net current period change | 1 | (10) | 2 | (7) | ||||||
| Reclassification into income | 63 | - | 63 | |||||||
| Dividend distributed | 3 | 326 | (741) | (412) | ||||||
| Transfer of result on disposal of equity investments at FVTOCI to retained earnings | (1) | 1 | - | |||||||
| Purchase of treasury shares | - | (24) | (24) | |||||||
| Re-issuance of treasury shares | (43) | (28) | 77 | 7 | ||||||
| Forward contracts | 76 | (140) | (64) | |||||||
| Share call options | 5 | (12) | (6) | |||||||
| Cancellation of treasury shares | (2) | (298) | 299 | |||||||
| Share-based compensation plans | 95 | 95 | ||||||||
| Income tax share-based compensation plans | 1 | 1 | ||||||||
| Balance as of December 31, 2022 | 178 | 5,025 | (376) | (2) | 1,866 | 1,010 | 7,431 | (275) | (1,608) | 13,249 |
| Appropriation of prior year result | (1,608) | 1,608 | ||||||||
| Net income | (466) | (466) | ||||||||
| Net current period change | (20) | 29 | (578) | (20) | (6) | (595) | ||||
| Income tax on net current period change | 3 | (2) | - | 3 | 5 | |||||
| Reclassification into income | (19) | (26) | (45) | |||||||
| Dividend distributed | 8 | 741 | (816) | (68) | ||||||
| Transfer of result on disposal of equity investments at FVTOCI to retained earnings | 4 | (4) | - | |||||||
| Purchase of treasury shares | - | - | ||||||||
| Re-issuance of treasury shares | (29) | (24) | 54 | - | ||||||
| Forward contracts | 465 | (608) | (143) | |||||||
| Share call options | - | - | ||||||||
| Cancellation of treasury shares | (3) | (563) | 566 | |||||||
| Share-based compensation plans | 88 | 88 | ||||||||
| Income tax on share-based compensation plans | 2 | 2 | ||||||||
| Balance as of December 31, 2023 | 183 | 5,827 | (390) | 6 | 1,263 | 990 | 4,878 | (262) | (466) | 12,028 |
Amounts may not add up due to rounding.
The financial statements including the notes thereon have been prepared in accordance with Part 9 of Book 2 of the Dutch Civil Code. In accordance with Section 2:362 (8) of the Dutch Civil Code, the recognition and measurement principles applied in these company financial statements are the same as those applied in the consolidated financial statements (refer to General information to the Consolidated financial statements and the accounting policies relating to specific financial statement items included in the respective notes to the consolidated financial statements).
The structure of the Company balance sheets and Company statements of income are aligned as much as possible with the Consolidated statements in order to achieve optimal transparency between the Group financial statements and the Company financial statements.
The Company balance sheet is presented prior to the appropriation of results.
Sales relate to external sales and mainly comprise of license income from intellectual property rights owned by the company.
Koninklijke Philips N.V.
Other Business Income
in millions of EUR
| 2022 | 2023 | |
|---|---|---|
| Other business income (expense) from sold and deconsolidated businesses | (19) | 4 |
| Other | 87 | 112 |
| Other business income | 68 | 116 |
Other business income (expense) includes the results from various sold and deconsolidated businesses.
The line Other mainly includes income and expense from transactions with group companies regarding overhead services and from brand license agreements.
Koninklijke Philips N.V.
Sales and costs by nature
in millions of EUR
| 2022 | 2023 | |
|---|---|---|
| Sales | 414 | 432 |
| Costs of materials used | (5) | (3) |
| Employee benefit expenses | (28) | (15) |
| Depreciation and amortization | (13) | (10) |
| Advertising and promotion | (3) | (3) |
| Other operational costs | (29) | (25) |
| Other business income | 68 | 116 |
| Income from operations | 403 | 493 |
For more information about Other business income, refer to Other business income (expense) and Discontinued operations and assets classified as held for sale.
For a summary of the audit fees related to the Philips Group, refer to the Group financial statements which is deemed incorporated and repeated herein by reference.
Financial income mainly relates to intercompany financing transactions of EUR 32 million (2022: EUR 66 million) and interest income from third parties of EUR 26 million (2022: EUR 1 million). Financial income related to intercompany financing transactions decreased mainly due to settlement of intercompany positions arising from restructuring of US entities, as well as the conversion of loans in the US to equity. Interest income from third parties increased mainly due to increase in free cash available and interest rate.
Financial expense mainly relates to interest paid on external debt of EUR 207 million (2022: EUR 188 million) and the value adjustments related to Other financial assets of EUR 40 million (2022: EUR 44 million). The value adjustment through P&L mainly comes from the investment in limited life funds. For further information, refer to Other financial assets.
Koninklijke Philips N.V. is the lead legal entity of the fiscal unity that exists for Dutch corporate income tax purposes and reports the income tax expense and deferred tax assets and liabilities of the fiscal unity.
The effective tax rate in 2023 is slightly lower than the Dutch statutory tax rate of 25.8% mainly due to the one-off recognition of tax credits and recurring favorable tax incentives, partly offset by non-deductible expenses and the increase in Others which mainly represents the effect of the inclusion of income of other legal entities that are part of the fiscal unity contributing to the fiscal unity income tax expense.
Koninklijke Philips N.V.
Effective income tax rate
in %
| 2023 | |
|---|---|
| Weighted average statutory income tax rate | 25.8 |
| Unrecognized tax loss and credit carryforwards | (24.1) |
| Changes to recognition of temporary differences | 0.0 |
| Non-taxable income and tax incentives | (14.1) |
| Non-deductible expenses | 10.5 |
| Withholding and other taxes | (1.1) |
| Tax rate changes | 3.3 |
| Prior year tax | 0.9 |
| Tax expenses (benefit) due to other tax liabilities | (0.2) |
| Others, net | 21.9 |
| Effective income tax rate | 22.8 |
As of December 31, 2023, tax credit carry forwards for which no deferred tax assets have been recognized in the balance sheet amount to nil (2022: EUR 20 million).
Consistent with the IAS 12 amendment regarding Pillar Two taxation as issued by the IASB and adopted by the EU, Philips does not recognize and disclose deferred taxes arising from tax laws that implement Pillar Two model rules published by the Organisation for Economic Co-operation and Development. Furthermore, Philips will recognize and disclose the impact (if any) from Pillar Two income taxes on current tax effective from 2024. Refer to section Global minimum tax (Pillar Two) in Income taxes.
The number of persons having a contract with the company as of December 31, 2023 was 9 (2022: 13):
They were all posted in the Netherlands.
For the remuneration of past and present members of both the Board of Management and the Supervisory Board, refer to Information on remuneration, which is deemed incorporated and repeated herein by reference.
Intangible assets include mainly licenses and patents. The changes during 2023 were as follows;
Koninklijke Philips N.V.
Intangible assets
in millions of EUR
| 2023 | |
|---|---|
| Balance as of January 1 | |
| Cost | 213 |
| Amortization / impairments | (129) |
| Book value | 84 |
| Additions | 27 |
| Disposal | |
| Amortization | (9) |
| Impairment | - |
| Total change | 17 |
| Balance as of December 31 | |
| Cost | 239 |
| Amortization / impairments | (138) |
| Book Value | 101 |
Investments in group companies and associates are measured on the basis of the equity method. Loans provided to group companies are stated at amortized cost, less impairment. The company makes use of the option to eliminate intercompany expected credit losses against the book value of loans and receivables to group companies, instead of elimination against the investments in group companies.
The changes during 2023 were as follows:
Koninklijke Philips N.V.
Financial fixed assets
in millions of EUR
| Investments in group companies | Investments in associates | Loans to group companies | Total | |
|---|---|---|---|---|
| Balance as of January 1, 2023 | 18,872 | 264 | 632 | 19,768 |
| Changes: | ||||
| Acquisitions/additions | 2,843 | 19 | 100 | 2,962 |
| Sales/redemptions | (17) | (7) | (32) | (56) |
| Net income from group companies and associates | (603) | (47) | (651) | |
| Dividends received | (594) | (2) | (597) | |
| Translation differences | (633) | (2) | (19) | (654) |
| Impairment | (86) | (86) | ||
| Other | 77 | (6) | 71 | |
| Balance as of December 31, 2023 | 19,945 | 133 | 681 | 20,759 |
Investment in group companies increased by EUR 1 billion. The increase is driven by the capital injection of EUR 2.5 billion into US group company. The capital injection took place to settle intercompany debt and in connection with Respironics' claim. The transaction was cash neutral at a consolidated group level. The increase is offset by negative result from group companies and dividends paid by group companies to Koninklijke Philips N.V.
Acquisitions and divestments were not material from the point of view of the company financial statements. For further information about acquisitions and divestments, refer to Acquisitions and divestments.
Translation differences of EUR 633 million reflect the depreciation, expressed in EUR, of the net capital invested in foreign group companies denominated in currencies other than EUR.
Position Other of EUR 77 million mainly relates to the cost of the share-based compensation plans and actuarial loss due to decrease of interest rate and increase of salary rate.
Investments in associates represent minority investments in various companies with significant influence.
Due to loss of significant influence in Candid Care during 2023, the company reclassified the investment to Other non-current financial assets at FVTOCI (Level 3). On reclassification the company recorded a loss of EUR 23 million in Other business expense. For more information about Other non-current financial assets, refer to Other financial assets.
In 2023, the company recorded its share in negative results of associates of EUR 47 million and impairment of EUR 86 million. The impairment losses mainly related to HALO Dx (EUR 33 million) and were recorded within the Investments in associates, net of income taxes line item. For further information about associates, refer to Interests in entities.
The EUR 49 million increase in loans is mainly due to the new loans to group companies.
A list of investments in group companies, prepared in accordance with the relevant legal requirements (Dutch Civil Code, Book 2, Sections 379 and 414), is deposited at the Chamber of Commerce in Eindhoven, the Netherlands.
Other current financial assets of EUR 3 million (2022: EUR 9 million) is related to earn-out arising from equity investment.
The changes during 2023 were as follows:
Koninklijke Philips N.V.
Other non-current financial assets
in millions of EUR
| Non-current financial assets at FVTP&L | Non-current financial assets at FVTOCI | Non-current financial assets at Amortized cost | Total | |
|---|---|---|---|---|
| Balance as of January 1, 2023 | 166 | 69 | 7 | 242 |
| Changes: | ||||
| Acquisitions/additions | 31 | 4 | 35 | |
| Sales/redemptions/reductions | (8) | (2) | - | (10) |
| Value adjustments through OCI | (2) | (2) | ||
| Value adjustments through P&L | (42) | - | (42) | |
| Translation differences and other | (1) | (5) | - | (7) |
| Reclassifications | (8) | 5 | - | (3) |
| Balance as of December 31, 2023 | 138 | 68 | 7 | 213 |
The company’s investments in Other non-current financial assets mainly consist of investments in common shares of companies in various industries and investments in limited life funds. Acquisitions/additions mainly relate to new investments and capital calls for certain limited life funds. Sales/redemptions/reductions mainly relate to distribution notes from those limited life funds.
The main movement in Other non-current financial assets at FVTP&L of EUR 42 million relates to loss in value of funds and equity instruments. The increase of EUR 31 million is mainly related to fulfill commitments to funds and bridge financing of equity investments.
Koninklijke Philips N.V.
Receivables
in millions of EUR
| 2022 | 2023 | |
|---|---|---|
| Trade accounts receivable | 97 | 107 |
| Receivables from group companies | 7,891 | 1,916 |
| Advances and prepaid expenses | 34 | 60 |
| Derivative instruments - assets | 154 | 68 |
| Other receivables | 121 | 88 |
| Receivables | 8,297 | 2,239 |
Receivable from group companies mainly relate to in-house bank contracts. The position decreased mainly due to settlement of intercompany positions arising from restructuring of US entities, as well as the conversion of loans in the US to equity. For further details, refer to note Debt and Financial fixed assets.
For further details on derivative instruments, refer to note Fair value of financial assets and liabilities and Details of treasury and other financial risks.
Cash and cash equivalents are all freely available. For further details on Cash and cash equivalents, refer to note Fair value of financial assets and liabilities and Details of treasury and other financial risks.
The revaluation reserves and other legal reserves are recognized based on the Dutch Civil Code.
For details, please refer to Group financial statements note 17 Equity.
As of December 31, 2023, revaluation reserves relate to unrealized loss on financial assets fair value through OCI of EUR 390 million (2022: EUR 376 million unrealized losses) and unrealized currency translation gain of EUR 1,263 million (2022: EUR 1,866 million unrealized gain). Legal reserves relate to ‘affiliated companies’ of EUR 990 million (2022: EUR 1,010 million) and unrealized gain on cash flow hedges of EUR 6 million (2022: EUR 2 million unrealized losses).
The item ‘affiliated companies’ relates to the ‘wettelijke reserve deelnemingen’, which is required by Dutch law. This reserve relates to any legal or economic restrictions on the ability of affiliated companies to transfer funds to the parent company in the form of dividends.
The following tables present information about the long-term debt outstanding, its maturity and average interest rates in 2023 and 2022.
Koninklijke Philips N.V.
Long-term debt
in millions of EUR
| USD bonds | EUR bonds | Loans from group companies | Forward contracts | Bank borrowings | Total debt | |
|---|---|---|---|---|---|---|
| Balance as of January 1, 2023 | 1,378 | 4,061 | 408 | 858 | 700 | 7,405 |
| New financing | 497 | 720 | 143 | 1,360 | ||
| Repayment | (491) | (608) | (500) | (1,599) | ||
| Acquisitions | ||||||
| Exchange differences | (52) | (28) | (80) | |||
| Other changes in value | - | 11 | - | 3 | 14 | |
| Balance as of December 31, 2023 | 1,325 | 4,569 | 609 | 396 | 200 | 7,100 |
Koninklijke Philips N.V.
Long-term debt
in millions of EUR, unless otherwise stated
| 2023 | |||||||
|---|---|---|---|---|---|---|---|
| Amount outstanding | Current portion | Non-current portion | Between 1 and 5 years | Amount due after 5 years | Average remaining term (in years) | Average rate of interest | |
| USD bonds | 1,325 | 1,325 | 240 | 1,085 | 13.3 | 6.3% | |
| EUR bonds | 4,569 | 4,569 | 2,335 | 2,234 | 5.1 | 2.0% | |
| Loans from group companies | 609 | 609 | 0.9 | 3.1% | |||
| Forward contracts | 396 | 321 | 76 | 76 | 0.8 | 1.4% | |
| Bank borrowings | 200 | 200 | 200 | 1.2 | 4.2% | ||
| Long-term debt | 7,100 | 930 | 6,170 | 2,851 | 3,319 | ||
Koninklijke Philips N.V.
Long-term debt
in millions of EUR, unless otherwise stated
| 2022 | |||||||
|---|---|---|---|---|---|---|---|
| Amount outstanding | Current portion | Non-current portion | Between 1 and 5 years | Amount due after 5 years | Average remaining term (in years) | Average rate of interest | |
| USD bonds | 1,378 | 1,378 | 250 | 1,128 | 14.3 | 6.3% | |
| EUR bonds | 4,061 | 4,061 | 1,836 | 2,225 | 5.7 | 1.7% | |
| Loans from group companies | 408 | 408 | 0.9 | 3.2% | |||
| Forward contracts | 858 | 606 | 252 | 252 | 1.0 | ||
| Bank borrowings | 700 | 700 | 700 | 1.9 | 1.7% | ||
| Long-term debt | 7,405 | 1,013 | 6,391 | 3,039 | 3,352 | ||
The decrease of EUR 305 million in Long-term debt mainly comes from maturing forward contracts related to share buyback program and company's long-term incentive and employee stock purchase plans. Long-term debt of EUR 7,100 million mainly relates to bonds. New EUR bonds were issued for an amount of EUR 497 million, offset by repayment EUR 500 million for term loans drawn from EUR 1 billion credit facility.
The following table presents information about the short-term debt outstanding in 2023 and 2022.
Koninklijke Philips N.V.
Short-term debt
in millions of EUR
| 2022 | 2023 | |
|---|---|---|
| Short-term bank borrowings | 1 | |
| Current portion of external long-term debt | 606 | 321 |
| Current portion of intercompany loans | 408 | 609 |
| Other debt to group companies | 8,448 | 5,808 |
| Short-term debt | 9,463 | 6,738 |
Short-term debt mainly relates to the other debt to group companies of EUR 5,808 million, consisting of in-house bank contracts. These positions decreased mainly due to the settlement of intercompany positions arising from restructuring of US entities, refer to Receivables. The current portion of outstanding external long-term debt of EUR 321 million relates to share buyback program.
For further details on debt and treasury risk, refer to Debt and Details of treasury and other financial risks.
Koninklijke Philips N.V.
Other current liabilities
in millions of EUR
| 2022 | 2023 | |
|---|---|---|
| Accrued expenses | 89 | 102 |
| Derivative instruments - liabilities | 246 | 72 |
| Other short-term liabilities | 44 | 18 |
| Other current liabilities | 379 | 191 |
Decrease in Other current liabilities mainly came from derivatives settled in 2023. For further details on derivative instruments, refer to note Fair value of financial assets and liabilities and Details of treasury and other financial risks.
The company has contracts with investment funds where it committed itself to make, under certain conditions, capital contributions to their funds up to an aggregated remaining amount of EUR 122 million (2022: EUR 90 million). As of December 31, 2023, capital contributions already made to these investment funds are recorded as Other non-current financial assets.
General guarantees as referred to in Section 403, Book 2, of the Dutch Civil Code, have been given by the company on behalf of several group companies in the Netherlands. The liabilities of these companies to third parties and investments in associates totaled EUR 1,304 million as of December 31, 2023 (2022: EUR 1,247 million). Guarantees totaling EUR 369 million (2022: EUR 421 million) have also been given on behalf of other group companies. As of December 31, 2023 there have been no guarantees given on behalf of unconsolidated companies and third parties (2022: nil).
The company is the head of a fiscal unity that contains the most significant Dutch wholly-owned group companies. The company is therefore jointly and severally liable for the tax liabilities of the tax entity as a whole.
For additional information, refer to Contingencies, which is deemed incorporated and repeated herein by reference.
For more information refer to Group financial statements Subsequent events
Philips has a long tradition of Environmental, Social and Governance (ESG) reporting, beginning with our first Environmental Annual Report published in 1999. Next, in 2003, we expanded the Environmental Annual Report with the launch of our first Sustainability Annual Report. This report provided details of our social and economic performance in addition to our environmental results. In 2008, we published our first integrated financial, social and environmental report. Our 2023 Annual Report is our 16th annual integrated financial, social and environmental report. For more information, please refer to the company’s website.
Royal Philips publishes its integrated Annual Report with reasonable assurance on its financial, social and environmental performance (except for EU Taxonomy disclosures with limited assurance). With that reasonable assurance level, Philips is a front-runner in our industry.
We follow external trends continuously to determine the issues most relevant for our company and where we can make a positive contribution to society at large. In addition to our own research, we make use of a variety of sources, including the United Nations Environmental Programme (UNEP), World Bank, World Economic Forum, IFRS, EFRAG, World Health Organization, the World Business Council for Sustainable Development (WBCSD), and various rating agencies and analyst reports. Our work also involves tracking topics of concern to governments, non-governmental organizations (NGOs), regulatory bodies, academia, and following the resulting media coverage.
Building on our extensive experience of environmental and social impact measurement and of providing transparency on governance, Philips has taken an active role – in collaboration with, in particular, the International Financial Reporting Standards (IFRS) Foundation, the World Economic Forum (WEF) and the European Union – to help drive the evolution towards a standard ESG reporting framework.
At the World Economic Forum in January 2017, Philips signed the Compact for Responsive and Responsible Leadership – an initiative (initiated by WEF and Philips) to promote and align the long-term sustainability of corporations and the long-term goals of society, with an inclusive approach for all stakeholders. The WEF secured a commitment from over 200 CEOs to align their corporate values and strategies with the United Nations’ Sustainable Development Goals (SDGs). In this Annual Report we also included the new ESG framework from WEF's International Business Council.
In 2020, the WEF’s International Business Council (IBC) published its core set of Stakeholder Capitalism Metrics and disclosures. These can be used by companies to align their mainstream reporting on performance against environmental, social and governance (ESG) indicators and track their contributions towards the SDGs on a consistent basis. Thus far, 166 companies reported in line with this framework. Based where possible on existing standards, the full set is comprised as follows:
The recommended metrics are organized under four pillars that are aligned with the SDGs and principal ESG domains: Principles of Governance, Planet, People and Prosperity. There is no intention to replace industry- or company-specific metrics (like our Lives Improved metric). Companies are encouraged to report against as many of the core and expanded metrics as they find material and appropriate, on the basis of ‘disclose or explain’.
In Philips' ESG performance at a glance, we show how Philips performed in 2023 on the above-mentioned 21 Core metrics, mapped to the three dimensions of our ESG commitments, as well as a number of additional Philips-specific metrics that we consider fundamental to the strategy and operation of our business.
Philips is also contributing to the IFRS Foundation’s endeavors to drive standardization of non-financial reporting as well as the development of sustainability standards by the European Union by EFRAG. We are preparing for the enhanced disclosure requirements under the EU Corporate Sustainability Reporting Directive (CSRD) that will start to apply as from our annual report over the financial year 2024. In preparation for the CSRD requirements, Philips has included in this annual report several metrics and textual disclosures in accordance with reporting criteria developed by Philips, in anticipation of the upcoming ESRS requirements.
This integrated annual report has been prepared with reference to the GRI Universal Standards 2021. A detailed overview of the GRI indicators can be found in the GRI content index on our sustainability website. We also developed additional company-specific indicators and started to measure the impact we are having on society, for example through our Environmental Profit & Loss account. The information on definitions, scope and measurement can be found in this chapter.
We have prepared this integrated annual report in line with the International Integrated Reporting Council (IIRC) Integrated Reporting framework, and complying with the EU Non Financial Reporting decree (2014/95/EU) and the 'EU Taxonomy'. The European Commission has published the Corporate Sustainability Reporting Directive and European Sustainability Reporting Standards. In this report we aim to prepare for this new regulation and already address a number of the relevant disclosure requirements that will be applicable to us in the future. We have also created an overview of our value creation process ( please refer to How we create value with sustainable impact.)
We signed up to the United Nations Global Compact in March 2007 to advance 10 universal principles in the areas of human rights, labor, the environment and anti-corruption. Our General Business Principles, Human Rights, Sustainability and Environmental Policies, and our Supplier Sustainability Declaration are the cornerstones that enable us to live up to the standards set by the Global Compact. This is closely monitored and reported, as illustrated throughout this report, which is also our annual Communication on Progress (COP) submitted to the UN Global Compact Office.
We use this report to communicate on our progress towards the relevant Sustainable Development Goals (SDGs), in particular SDG 3 (Ensure healthy lives and promote well-being for all at all ages), SDG 12 (Ensure sustainable consumption and production patterns) and SDG 13 (Take urgent action to combat climate change and its impacts). Please refer to Advocacy activities and expenses for more details.
Every year, we identify the environmental, social, and governance topics which have the greatest impact on our business and the greatest level of concern to stakeholders along our value chain. Please refer to our Double Materiality Assessment for more details on this process and the results for 2023. Below you will find an overview of the key material topics, further references, KPIs and the boundaries of these topics.
| Reference | ||||
| Environmental | Impacts, Risks and Opportunities | KPI | Boundaries | Time horizon |
| - Climate change | Strategic risks - ESG Operational risks - GBP and regulations | Operational Carbon Footprint, Green/EcoDesigned Revenues | Supply chain, operations, use-phase | Short-, Medium-, and Long-term |
| - Circular Economy | Strategic risks - ESG Operational risks - GBP and regulations | Circular Revenues, Waste to Landfill, Closing the Loop | Supply chain, operations, use-phase | Short-, Medium-, and Long-term |
| - Energy efficiency | Strategic risks - ESG Operational risks - GBP and regulations | Operational Carbon Footprint, Green/EcoDesigned Revenues | Supply chain, operations, use-phase | Short-, Medium-, and Long-term |
| - Waste management | Green/EcoDesigned Innovation Environmental performance Circular Economy Supplier sustainability Strategic risks - ESG Operational risks - innovation excellence | Circular Revenues, Waste to Landfill, Closing the Loop | Supply chain, operations, use-phase | Short-, Medium-, and Long-term |
| Reference | ||||
| Societal | KPI | Boundaries | Time horizon | |
| - Access to (quality & affordable) care | Strategic risks - Geopolitics and Macroeconomics, Health informatics, ESG | Lives Improved, Lives improved in underserved health communities | Use-phase | Short-, Medium-, and Long-term |
| - Public health risk | Health and Safety Strategic risks - Geopolitics and Macroeconomics, Health technology environment Operational risks - Innovation excellence | Lives Improved, Lives improved in underserved communities | Supply chain, operations, use-phase | Short-, Medium-, and Long-term |
- Employee rights | Equal opportunities and equal pay Operational risks - People | Philips pays its employees at least a living wage | Supply chain, operations, use-phase | Short-, Medium-, and Long-term |
| - Employee well-being, Health & Safety | Message from the CEO Operational risks - People | Total Recordable Case rate, Suppliers participating in Supplier Development program | Supply chain, operations | Short-, Medium-, and Long-term |
| - Human Rights | Supply chain and procurement Social performance ESG statements Strategic risks - ESG Operational risks - Supply chain, People | Human Rights impact assessments at our at-risk sites, Suppliers participating in Supplier Development program | Supply chain, operations | Short-, Medium-, and Long-term |
| - Fair & Inclusive workplace | Diversity, Inclusion and Well-Being Equal opportunities and equal pay Operational risks - People | Females in leadership positions | Supply chain, operations | Short-, Medium-, and Long-term |
| - Talent & development | Social performance People development Talent attraction Operational risks - People | Training hours | Supply chain, operations | Short-, Medium-, and Long-term |
| - Responsible & resilient supply chains | Supply chain and procurement Human rights Health and Safety performance Supplier sustainability Strategic risks - ESG Operational risks - Supply chain and procurement chain | Suppliers participating in Supplier Development program | Supply chain, operations | Short-, Medium-, and Long-term |
| - Social inclusion & engagement | Social performance Diversity, Inclusion and Well-Being Employee engagement Supplier sustainability Strategic risks - ESG Operational risks - Supply chain, People | Females in leadership positions Employee Engagement Score Suppliers participating in Supplier Development program | Supply chain, operations | Short-, Medium-, and Long-term |
| Reference | ||||
| Governance | KPI | Boundaries | Time horizon | |
| - Business ethics & General Business Principles | Philips General Business Principles (GBP) Compliance risks - GBP and regulations | Employees trained in GBP | Supply chain, operations, use-phase | Short-, Medium-, and Long-term |
| - Product responsibility & safety | Message from the CEO Quality & Regulatory and patient safety Operational risks - Patient Safety and Quality, Cybersecurity Compliance risks - Product regulations | Employees trained in Patient Safety and Quality | Supply chain, operations, use-phase | Short-, Medium-, and Long-term |
| - Competition & market access | Our geographic structure Quality & Regulatory and patient safety Strategic risks - Geopolitics and Macroeconomics, Health technology environment Operational risks - Supply chain Financial risks - Global inflation | Research and development expenses | Supply chain, operations, use-phase | Short-, Medium-, and Long-term |
| - Governance | Governance Operational risks - Business operating model simplification Financial risks - Accounting and reporting Compliance risks - GBP and regulations | Tax transparency | Supply chain, operations | Short-, Medium-, and Long-term |
| - Big data, AI & Cybersecurity | Strategy and Businesses Cybersecurity Quality & Regulatory and patient safety Human rights Strategic risks - Health technology environment, Health informatics Operational risks - Cybersecurity | Employees trained in Patient Safety and Quality, and Security | Supply chain, operations, use-phase | Short-, Medium-, and Long-term |
| - Innovation & research | Human rights Strategic risks - Health technology environment, Health informatics Operational risks - Innovation excellence | Green/EcoDesigned innovation | Supply chain, operations, use-phase, disposal | Short-, Medium-, and Long-term |
| - Sustainable value creation | Strategic risks - Acquisitions, ESG, Intellectual property Operational risks - Innovation excellence | Research and development expenses, Green/EcoDesigned innovation | Supply chain, operations, use-phase | Short-, Medium-, and Long-term |
| - Geopolitical events | Message from the CEO Strategy and Businesses Strategic risks - Geopolitics and Macroeconomics Operational risks- Supply chain Financial risks - Global inflation | N/A | Supply chain, operations, use-phase | Short-, Medium-, and Long-term |
| - Investor relations and public affairs | Message from the CEO Strategy and Businesses Working with stakeholders and advocacy Strategic risks Financial risks | N/A | Supply chain, operations, use-phase | Short-, Medium-, and Long-term |
In 2020, as we ended the 5-year ‘Healthy people, Sustainable planet’ program, Philips' ESG commitments were introduced. An overview of these commitments has been provided in Philips' ESG commitments and more detailed targets can be found in the respective sections.
All of our programs are guided by the Philips General Business Principles, which provide the framework for all of our business decisions and actions.
Philips Group
ESG commitments
| baseline year 2020 | target 2025 | 2023 actual | |
|---|---|---|---|
| Environmental | |||
| Green/EcoDesigned revenues | 73.2% | 70.5% | |
| Circular revenues | 14.6% | 25% | 20.0% |
| Circular Materials Management | 90% | 95% | 91% |
| Zero waste to landfill as a percentage of total regular waste | 2.6% | less than 0.5% | 0.0% |
| Net operational carbon footprint | 0 KTonnes | 0 KTonnes | 0 KTonnes |
| % of suppliers committed to Science Based Targets | 50% | 46% | |
| Social | |||
| Lives Improved | 1.53 billion | 2 billion | 1.88 billion |
| Lives improved in underserved communities | 127 million | 300 million | 221 million |
| Females in leadership positions | 27% | 35% | 31% |
| Total Recordable Case (TRC) rate | 0.24 | 0.24 | |
| Human Rights impact assessments at our at-risk sites | 60% | 100% | 100% |
| Supplier Development Program | 302,000 employees impacted | 1,000,000 employees impacted | 723,000 employees impacted |
| Governance | |||
| General Business Principles training completion | 65,000 staff trained | 60,000 staff trained |
Our ESG performance reporting encompasses the consolidated Philips Group activities in the Environmental, Social and Governance sections, following the consolidation criteria detailed in this section. Thus, the scope of the financial statements is the same as the scope of our ESG statements, with the exception of value chain information in the ESG statements. As a result of impact assessments of our value chain, we have identified the material topics, determined their relative impact in the value chain (supply chain, our own operations, and use-phase of our products) and reported for each topic on the relevant parts of the value chain. More details are provided in the relevant sections in the ESG statements.
Philips has not used the option to omit a specific piece of information corresponding to intellectual property, know-how or the results of innovation. Philips also did not use the exemption from disclosure of subsidiaries provided for in articles 19a (3) and 29a (3) of Directive 2013/34/EU.
The consolidated selected financial information in this ESG statements section has been derived from the Group financial statements, which are based on IFRS.
Lives improved by the Philips Foundation have been consolidated.
We used expert opinions, estimates, and proxies for some parts of the Key Performance Indicator calculations. There is therefore an inherent uncertainty in our calculations, e.g. Lives Improved, Environmental Profit & Loss account, Scope 3 carbon emissions, and Social Impact calculations. The figures reported are Philips’ best estimate. As our insight increases, or higher-quality sources become available, we may enhance the methodology in the future.
We have excluded data from the former Domestic Appliances business from the ESG information wherever possible. In a limited number of cases, for example for road logistics emissions, we have used proxies for previous years. If Domestic Appliances information was not available for past years, and could therefore not be excluded, we have indicated this in the respective section. The EEI and GBP results have not been restated.
In 2020, Philips made changes to the EP&L use-case scenario, the energy mix of the use-phase of its products, and added the full Sleep & Respiratory Care portfolio to the EP&L scope. For more information, refer to Environmental performance and our methodology document.
In 2019, Philips re-aligned its Lives Improved target with the UN 2030 Sustainable Development Agenda following the completion of its portfolio transformation. Philips targets an ambitious, average annual Lives Improved growth rate of around 6% for the 2019–2030 period.
In order to report on our corporate Scope 2 emissions, Philips follows the Scope 2 Greenhouse Gas Reporting Guidance. This guidance requires that companies operating in liberalized electricity markets, where renewable energy certificates (also referred to as “contractual instruments” and “energy attribute certificates) such as Guarantees of Origin (GO), RECs, etc. are available, shall report two Scope 2 totals based on the following methods: the location-based method and the market-based method. In short, the location-based method total can only be reduced by decreasing the activity data (or electricity consumption) since the grid average emission factor is largely outside of corporate control and more controlled by governments and utilities. By contrast, the market-based method is designed to highlight supply choices, including low- or zero-carbon supply from renewable sources like wind or solar. In 2021, the emission factor set for our Scope 2 market-based and location-based have been updated. For our market-based Scope 2 calculations in Europe and the US, we apply the Reliable Disclosure (RE-DISS) and AIB European Residual Mixes 2019 Version 1.1 (GWP Applied) and 2020 Green-e® Residual Mix Emissions Rates (2018 Data) where residual mix factors are available; for all other countries, we apply the International Energy Agency (IEA) 2020 v1.1 (AR4 Applied) emission factors. For our location-based Scope 2 calculations, we apply the US Environmental Protection Agency eGRID (Sub Region & US Average) - 2018 (Released Jan 2020) v1.1 and the International Energy Agency (IEA) 2020 v1.1 (AR4 Applied) emission factors.
In order to report on our Scope 3 emissions, Philips follows the Scope 3 Greenhouse Gas Reporting Guidance, in line with our Science Based Targets initiative (SBTi) submission. More details can be found in Philips' Corporate Emission Accounting methodology documents.
Data on emissions of substances are based on measurements and estimates at manufacturing site level. The figures reported are Philips’ best estimate. The basis of preparation is data submitted by our environmental coordinators at our manufacturing sites, which is validated and consolidated by Group Sustainability.
The integration of newly acquired activities is scheduled according to a defined integration timetable (in principle, the first full reporting year after the year of acquisition) and subject to the integration agenda. Data for activities that are divested during the reporting year are not included in full-year reporting. Environmental data are reported for manufacturing sites with more than 50 industrial employees.
Philips did not identify material misstatements in prior reporting periods.
The Key Performance Indicator on ‘lives improved’ and the scope are defined in the methodology document that can be found in Methodology for calculating Lives Improved. We used opinions from Philips experts and estimates for some parts of the Lives Improved calculations. Philips has made strong commitments to improve people's health and well-being. To track our impact, Philips identifies countries where the need for access to healthcare is highest. This is determined by four selected health indicators, as provided by United Nations Sustainable Development Goal 3, which focuses on health and well-being. The specific methodology for how we determine an underserved health community can be found in the same document.
Health and safety data is reported by sites with over 50 FTEs (full-time equivalents); reporting is voluntary for smaller locations. With this approach, the total FTE coverage of H&S reporting is above 90%. The remainder is not extrapolated. The data are reported and validated each month via an online centralized IT tool. The Total Recordable Cases (TRC) rate is defined as a KPI for work-related cases where an employee is injured or becomes ill and is unable to work in the same capacity for one or more days following a workplace incident or has medical treatment above first-aid treatment. We also provide the Lost Workday Cases (LWC) rate, which measures work-related injuries and illnesses (predominantly occurring in manufacturing operations and field service organizations) where the incident leads to at least one lost workday. Fatalities are reported for staff, contractors and visitors. The TRC and LWC KPIs apply to all reported cases.
Alleged GBP violations are registered in our web-based reporting and validation tool.
All environmental data from manufacturing operations, except process chemicals, are reported on a monthly basis in our sustainability reporting and validation tool, according to company guidelines that include definitions, procedures and calculation methods. Process chemicals are reported on a half-yearly basis.
Internal validation processes have been implemented and peer audits performed to ensure consistent data quality and to assess the robustness of data reporting systems.
These environmental data from manufacturing are tracked and reported to measure progress against our Sustainable Operations targets.
A manufacturing site is classified as 'Zero Waste to Landfill' if less than or equal to 0.5% of the total regular waste reported by the site is sent directly to landfill via an external contractor. This excludes waste that is landfilled due to a regulatory requirement and one-time waste. A site needs to meet these requirements for at least two consecutive reporting periods.
Reporting on ISO 14001 certification is based on manufacturing units reporting in the sustainability reporting system.
The Philips Environmental Profit & Loss (EP&L) account measures our environmental impact on society at large. The EP&L account is based on Life Cycle Analysis methodology in which the environmental impacts are expressed in monetary terms using specific conversion factors. For more information, we refer to our methodology report.
Philips reports in line with the Greenhouse Gas Protocol (GHGP). The GHGP distinguishes three scopes, as described below. The GHGP requires businesses to report on the first two scopes to comply with the GHGP reporting standards. As per the updated GHGP Scope 2 reporting guidance, from 2015 onward our Scope 2 emissions reporting includes both the market-based method and the location-based method. The market-based method of reporting will serve as our reference for calculating our total carbon footprint. As part of our carbon footprint, Philips also reports on four Scope 3 categories, namely emissions from purchased goods and services, business travel, transportation and distribution and use of sold products.
For more information on our calculation methodologies please refer to the ESG download page.
The Employee Engagement Index (EEI) is the single measure of the overall level of employee engagement at Philips. It is a combination of perceptions and attitudes related to employee satisfaction, commitment and advocacy.
The reported figures are based on the Employee Survey. The total score for employee engagement is an average of the quarterly results of the survey. The results are calculated by taking the average of the answered questions of the surveys.
Our definitions of short-, medium-, and long-term are defined in preparation for ESRS 1 section 6.4.
ESG is strongly embedded in our core business processes, like innovation (EcoDesign), sourcing (Supplier Sustainability Program), manufacturing (Sustainable Operations), logistics (Green Logistics) and programs like our Circular Economy program.
In Royal Philips, the Board of Management is the highest governing ESG body. Subject to the topics discussed, other Executive Committee members attend these meetings, together with functional executives. The Board of Management normally convenes four times per year on ESG. The Board of Management also defines Philips’ ESG strategy, commitments, programs, action plans and policies, monitors progress and takes corrective action where needed. On a quarterly basis, ESG reporting is also discussed in the Audit Committee of the Supervisory Board.
Progress on ESG is communicated internally and externally (www.results.philips.com) on a quarterly basis and at least annually in the Executive Committee and Supervisory Board.
Philips publishes its integrated Annual Report with the highest (reasonable) assurance level from its independent auditor on its financial, environmental, social, and governance performance. With that overall reasonable assurance level, Philips is a frontrunner in its industry.
EY has provided reasonable assurance on whether the information in Double Materiality Assessment, ESG statements and Environmental, Social and Governance, except for the sections EU taxonomy framework in EU Taxonomy disclosures, Remuneration policy and Risk management approach, presents fairly, in all material respects, the sustainability performance in accordance with the reporting criteria. Please refer to Independent auditor's assurance report on the ESG information and the EU Taxonomy information
This section provides summarized information on contributions made on an accruals basis to the most important economic stakeholders as a basis for driving economic growth. For a full understanding of each of these indicators, see the specific financial statements and notes in this report.
Philips Group
Distribution of direct economic benefits
in millions of EUR
| 2021 | 2022 | 2023 | |
|---|---|---|---|
| Suppliers: goods and services | (9,988) | (10,633) | (10,721) |
| Employees: salaries and wages | (5,129) | (5,698) | (5,769) |
| Shareholders: distribution from retained earnings | 773 | 741 | 749 |
| Government: corporate income tax1) | (249) | (333) | (152) |
| Capital providers: net interest | (141) | (210) | (230) |
Total purchased goods and services as included in cost of sales amounted to EUR 10.7 billion, representing 59.0% of total revenues of the Philips Group. Of this amount, approximately 53% was spent with global suppliers, the remainder with local suppliers.
In 2022, salaries and wages totaled EUR 5.8 billion, an increase of 1% compared to 2022. See Income from operations for more information.
Philips’ shareholders were given EUR 816 million including costs in the form of a dividend.
The income tax paid in 2023 of EUR 152 million is mainly driven by prepayments based on projected income. For more information, see Income taxes.
Philips supports global initiatives of the OECD (Organization for Economic Cooperation and Development) and UN (United Nations) to promote tax transparency and responsible tax management, taking into account the interests of various stakeholders, such as governments, shareholders, customers and the communities in which Philips operates. For more information, please refer to Our approach to taxes.
In 2020, Philips further reinforced its commitments as a purpose-driven company with the announcement of an enhanced and fully integrated approach to doing business responsibly and sustainably. This section provides additional information on (some of) the environmental performance parameters reported in Environmental performance.
Climate change has been a material topic for Philips for many years, and the Double Materiality Assessment performed in 2023 confirmed this. At Philips, we have addressed Climate Action for years, and in this section, we will explain our targets, plans, metrics, and results to deliver on our commitments. Climate risks have also been addressed; for more detailed information, refer to our TCFD report 2023.
After delivering on our carbon neutrality commitments in 2020, we raised the bar and set ambitious science-based emission reduction targets to ensure we help limit the impact of global warming, not only in our operations, but throughout our value chain – collaborating with suppliers and customers to amplify our impact. The visual below shows the full value chain (Scope 1, 2 and 3) emissions of Philips in 2023.
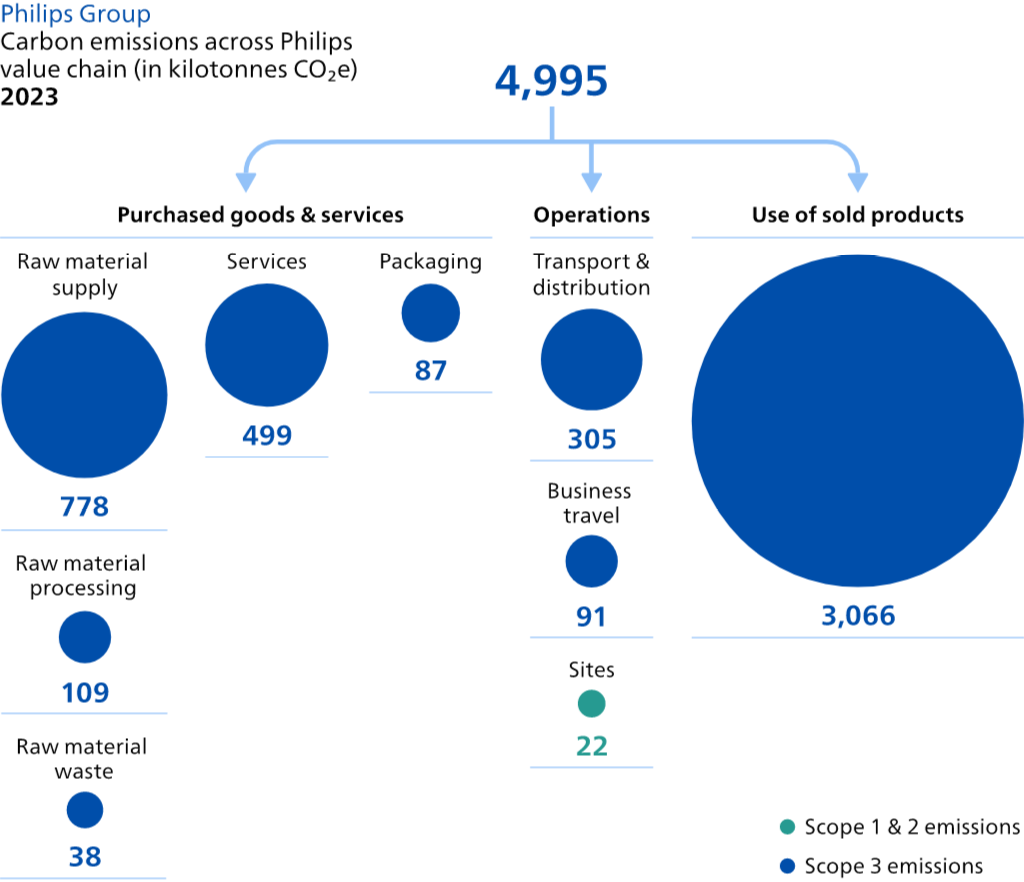
In our sites, we reduced our Scope 1 (direct) CO2-e emissions by 12% and our Scope 2 (market-based approach) CO2-e emissions by 10% compared to 2022. Scope 1 emissions cover the emissions from our direct fuel consumption and the use of refrigerants. In contrast, Scope 2 (market-based) emissions cover the emissions of non-renewable electricity and purchased (city/district) heating, cooling, and steam. For more information on the Global Warming Potentials (GWP) applied, refer to the Greenhouse Gas emissions per gas type section. For more information on how we calculate our Scope 1 and 2 emissions, refer to the ESG downloads page.
As emphasized in our environmental policy, we are implementing energy efficiency measures, eliminating fossil fuels, and procuring renewable electricity to meet our Science Based Targets for Scope 1 and 2 emissions (market-based). Our commitment is further underscored by the ongoing pursuit of ISO 50001 certification for our manufacturing sites, allowing us to adopt a systematic approach for continuous energy management improvements. A significant milestone for our energy strategy in 2023 was achieved when all Dutch sites, accounting for 29% of our energy consumption, were successfully re-certified.
Our continued efforts to preserve energy have contributed to a reduction in our energy demand of 8%. This was achieved by introducing a global energy policy and temporarily closing certain buildings and floors to improve the utilization of available office space. As a strategic move in 2023 under our energy efficiency strategy, we also transitioned from existing buildings to locations with better energy efficiency. Therefore, our average energy intensity has improved.
Regarding the transition to renewable energy, we are making good progress, increasing the share to 78% in 2023. We are therefore already overachieving our 2025 ambition of sourcing 75% of our energy from renewable sources. This is largely driven by multiple Power Purchase Agreements (PPAs) securing the supply of renewable electricity. Prior to 2023, these included the Los Mirasoles wind farm in the US and the Krammer and Bouwdokken wind farms in the Dutch province of Zeeland. To further secure the long-term delivery and quality of renewable electricity for all our operations in Europe, we increased our portfolio in 2023 with a wind farm in Mutkalampi, Finland and a solar farm in Pontinia, Italy. In December 2023, we also closed our first direct renewable energy deal in China. For all remaining electricity demand, we acquire unbundled Energy Attribute Certificates (EACs). Details regarding the attributes per country are available through RE100 in our CDP disclosure.
EACs play a pivotal role in significantly reducing the reported Scope 2 market-based emissions, aligning with the recommendations of the Greenhouse Gas Protocol (GHGP). These instruments serve as strategic tools in our commitment to sustainability and environmental responsibility. By investing in renewable energy projects through the purchase of EACs, we not only contribute to the growth of the clean energy sector, but also directly limit our carbon footprint associated with electricity consumption.
Our operational energy efficiency improved by 10%, from 27.9 MWh/million EUR sales in 2022 to 25.2 MWh/million EUR sales in 2023.
Even though we have already achieved our 2025 SBTi targets, we will continue to accelerate our Scope 1 and 2 decarbonization efforts by driving down overall energy consumption and finding alternative renewable energy sources, making sure we remain well on track to deliver on our long-term (2040) Science Based Targets.
Scope 3 emissions are linked to indirect emissions that reside either upstream or downstream and are included in our approved Science Based Target of 42% reduction by 2030. At Philips, four Scope 3 categories are deemed material and together cover roughly 96% of our total Scope 3 emissions. These include Business Travel, Transportation & Distribution, Purchased Goods & Services, and Use of Sold Products. Therefore, in line with the SBTi, the remaining 4% of estimated value chain emissions are deemed immaterial and are not disclosed. For more information on the calculation methodologies, GWPs, proportion of emissions calculated using data from value chain partners and the underlying assumptions, refer to the ESG download page. Please note that, for our business travel emissions and logistics emissions, we used the reporting period December 2022 until November 2023.
Our Business Travel emissions, covering emissions from air travel, lease cars and rental cars, increased by 5% compared to 2022. This is mainly due to the restructuring at Philips that required increased travel to allow an optimal transition. The post-pandemic surge in travel was also driven by a need to align with customers which further contributed to the increased emissions. Moving forward, we continue to electrify our lease fleet and promote online collaboration, as well as increase our efforts to move travelers to rail transport for shorter distances. With tightened travel budgets in 2024, we aim to curb the growth of travel emissions.
In 2023, we recorded a 7% decrease in emissions from our Transportation and Distribution compared to 2022. The scope of these emissions covers the CO2-e emitted by air freight, ocean freight, road freight and parcel shipments. As air freight accounts for most of our operational carbon footprint, we have taken several measures to minimize our environmental impact. These include the Corridor Project, where we are shifting several lanes from air to ocean freight, and the Consolidation Project, where we group multiple shipments in one to reduce the total number of shipments. Overall, these efforts have contributed to the elimination of 6,228 air freight shipments, compared to 2022. It is also important to note that Philips was the first healthcare company to sign the coZEV ambition statement for Sustainable Maritime Freight Shipping. This will support our efforts in accelerating maritime decarbonization.
Philips Group
Logistic Freight emissions per mode of transportation
in tonnes CO2-equivalent1)
| 2019 | 2020 | 2021 | 2022 | 2023 | |
|---|---|---|---|---|---|
| Air freight | 278,794 | 261,504 | 252,104 | 213,562 | 168,153 |
| Road freight | 70,728 | 64,124 | 54,897 | 27,276 | 26,393 |
| Sea freight | 75,170 | 42,913 | 38,997 | 22,150 | 23,552 |
| Parcel freight | 45,259 | 46,090 | 70,963 | 63,811 | 86,988 |
| Philips Group | 469,950 | 414,631 | 416,961 | 326,798 | 305,086 |
Our emissions from purchased goods and services were 1,511 kilotonnes CO2-e in 2023. This is a reduction of 12% compared to the 2020 baseline. This includes any emissions generated by the consumption of raw materials, components, packaging, and services that are acquired to create and distribute Philips products. This only includes production-related goods (e.g., components and parts) and all services that are in category 1 in line with the GHG protocol, i.e. energy-related spend is not included in this as it is covered in other categories (Scope 1 and 2). Emissions associated with purchased goods are determined in line with the Environmental Profit & Loss (EP&L) statement, reflecting a comprehensive Life Cycle Analysis (LCA) perspective. To further reduce these emissions, we are driving action through our Circular Economy and EcoDesign programs, applying the principles ’use less, use longer and use again’. For more information on this and our Circular Economy program, please refer to the Circular Economy. For more information on any exclusions, refer to the EP&L methodology document. Emissions associated with purchased services are, in contrast, calculated using a spend-based approach.
Furthermore, to reduce emissions related to the sourcing of our materials, components and parts, we announced at COP26 our plan to step up our acclaimed Supplier Sustainability program with the goal of having at least 50% of our suppliers (based on spend) committing to Science Based Targets for CO₂-e emissions reduction by 2025.
In 2023, our emissions related to the use of sold products were 3,066 kilotonnes CO2-e, a reduction of 41% compared to our baseline in 2020. These emissions are determined by three key variables: the lifetime energy use per product, the number of products sold per country, and the country-specific emission factor. It should be noted that the energy consumption during the full lifetime of the products sold is included in the emission calculation of the year of sale. Yearly emission levels therefore account for the forward-looking locked-in energy demand of the products sold. This is done in accordance with the Greenhouse Gas Protocol (GHGP). The reduction in use-phase emissions can mainly be explained through the reduced sales of Sleep & Respiratory Care devices that are relatively energy-intensive and by updated energy use cases for hair dryers in 2022.
To reduce the impact of our sold products we are implementing energy efficiency measures for our existing and future installed base. This is closely tied to our EcoDesign commitment of having all new product introductions EcoDesigned by 2025. EcoDesigned products must optimize their energy consumption to the lowest possible state while meeting market and technological requirements. Together with our businesses we are therefore exploring solutions, for example introducing low energy-consuming eco-modes.
In 2023, we also started investigating novel partnerships with our customers to ensure reduced energy consumption and increased renewable energy usage of our devices. As proof of concept, we signed a strategic partnership agreement with Champalimaud Foundation in March 2023, to help them reduce their carbon emissions from Philips products in scope by 50%. For more information, refer to the press release.
Philips Group
Carbon footprint by scope and category
in tonnes CO2-equivalent1)
| Retrospective | Milestones and target years2) | ||||||
|---|---|---|---|---|---|---|---|
| Base year | 2022 | 2023 | 2025 | 2030 | 2040 | ||
| Scope 1 GHG emissions (base year = 2015) | Scope 1&2 GHG emissions | ||||||
| Gross scope 1 GHG emissions | 34,896 | 22,518 | 19,856 | 33,543 | 13,417 | ||
| % scope 1 emissions covered by ETS3) | 3% | 3% | |||||
| Scope 2 GHG emissions (base year = 2015) | |||||||
| Gross Location-based emissions | 167,486 | 145,908 | |||||
| Gross Market-based emissions | 99,275 | 2,383 | 2,137 | ||||
| Significant scope 3 emissions (base year = 2020) | Scope 3 GHG emissions | ||||||
| Category 1- Purchased goods and services4) | 1,715,819 | 1,511,035 | 4,268,906 | ||||
| Category 6 - Business travel | 70,158 | 86,399 | 90,776 | ||||
| Category 9 - Downstream transportation & distribution | 414,631 | 326,798 | 305,086 | ||||
| Category 11 - Use of sold products4) | 5,159,574 | 3,898,000 | 3,066,284 | ||||
| Total GHG emissions | |||||||
| Total GHG emissions (Location-based) | 5,138,945 | ||||||
| Total GHG emissions (Market-based) | 4,995,174 | ||||||
| Total GHG emissions including biofuels (Market-based)5) | 4,994,496 | ||||||
| Sales to thirds in millions of EUR | 18,169 | ||||||
| GHG intensity | |||||||
| GHG intensity (Location-based approach) (kgCO2-e/EUR) | 0.28 | ||||||
| GHG intensity (Market-based approach) (kgCO2-e/EUR) | 0.27 | ||||||
In 2023, we updated our emission factors to the latest available version to reflect the most accurate results. For more information, refer to the methodologies on the ESG Downloads page. Philips reports all its emissions in line with the GHGP.
As part of our reporting obligations, we are also committed to disclosing emissions per Greenhouse Gas type, where available. As most Scope 3 categories are out of our direct control, we do this for all of our Scope 1 and Scope 2 market-based emissions. We do not disclose this information for our location-based Scope 2 emissions, as this would ignore our conscious decision to procure renewable electricity for all our global operations.
In accordance with international reporting requirements, emissions from each of the gases are weighted by their Global Warming Potential (GWP), so that total Greenhouse Gas emissions can be reported on a consistent basis. For all of our fuel-related scope 1 emissions, the GWPs are used from the IPCC Fifth Assessment Report. For emissions related to the use of refrigerants (fugitive emissions) the GWPs from the IPCC Sixth Assessment Report are leveraged. For our scope 2 market-based emissions the GWPs of the IPCC Fourth Assessment Report are used.
Philips Group
Greenhouse Gas emissions per gas type
in tonnes CO2-equivalent
| 2023 | ||
|---|---|---|
| Scope 1 | Carbon dioxide (CO2) | 18,267 |
| Methane (CH4) | 25 | |
| Nitrous oxide (N20) | 13 | |
| Hydrofluorocarbons (HFC) | 1,297 | |
| Perfluorinated carbons (PFC) | 0 | |
| Chlorofluorocarbons (CFC) | 5 | |
| Hydrochlorofluorocarbons (HCFC) | 249 | |
| Scope 2 (Market based) | Carbon dioxide (CO2) | 2,118 |
| Methane (CH4) | 12 | |
| Nitrous oxide (N20) | 7 | |
| Total amount of emissions | 21,993 |
Although reduction is key to achieving carbon neutrality, unavoidable carbon emissions require compensation. This is achieved by the cancellation of acquired carbon credits. In 2023, we offset a total of 417,900 tonnes CO2-e, equivalent to the annual uptake of approximately 12.6 million medium-sized oak trees. This covers our operational carbon footprint, which includes all CO2-e emissions from our sites, business travel, and transportation and distribution. We thereby address climate change outside our own value chain and contribute to the reduction of global CO2-e emissions that we cannot eliminate along our own value chain. These activities complement our existing climate strategy and are excluded from our Science Based Targets for emission reductions. Thus, ensuring that these investments do not impede the achievement of our carbon reduction targets.
Philips not only offsets its operational carbon footprint by funding impactful social and environmental projects but is also proactively exploring innovative approaches to directly reduce carbon emissions in the value chain, particularly for unavoidable transport-related emissions. For instance, we employ biofuels in global transportation, enhancing sustainability in modes such as ocean and air transport – a practice commonly known as ’insetting’. Despite the absence of widely accepted guidance from the GHGP, current auditing practices overlook insetting as an emission reduction solution. Philips remains dedicated to fostering sustainability in its supply chain and seeks support from institutions, companies, and organizations like the GHGP for guidelines on emerging carbon levers. This commitment aims to drive sector-wide decarbonization, anticipating future technological innovations, and encouraging private-sector investments to enhance the overall sustainability of the operational value chain. In 2023, we successfully inset 678 tonnes of carbon dioxide equivalent (CO2-e) in the well-to-wheels (WTW) life cycle of air freight by adopting biofuels from approved feedstock. We only accept biofuels from wastes, residues and by-products as feedstocks with preference for REDII Annex IX feedstocks for advanced biofuels. This strategic move not only resulted in a modest reduction of emissions, but also aligns with our commitment to nature-based solutions.
Philips Group
Carbon credits cancelled
in tonnes CO2-equivalent
| 2023 | |
|---|---|
| Total credits cancelled | 417,900 |
| Share from removal projects (%) | 2% |
| Share from reduction projects (%) | 98% |
| Gold Standard GS (%) | 17% |
| Verra VCS (%) | 83% |
| Share from projects within the EU (%) | - |
| Share of carbon credits that qualify as corresponding adjustments (%) | - |
Carbon credits planned to be cancelled in the future is 420,000 tonnes CO2 in 2024 and the same amount in 2025. This future cancellation is a high level estimate and subject to change.
We finance projects in emerging regions that have a strong link with UN Sustainable Development Goals 3 (Ensure healthy lives and promote well-being for all at all ages) and 12 (Ensure sustainable consumption and production patterns). To ensure these offsets meet our high-quality standard of additionality, permanence and avoidance of double counting, Philips only procures carbon credits from carbon standards that are endorsed by ICROA, such as VCS Standard and Gold Standard. Each program is also verified by an independent third party. We ensure, through our providers, that the quality criteria of additionality, permanence and avoidance of double counting are met. In addition, Philips has conducted site visits to some of the projects in our portfolio. None of our credits as of now are subject to corresponding adjustment under Article 6 of the Paris Agreement. Philips will follow the developments of Article 6 closely to understand if, and when, any of the projects might become subject to corresponding adjustments. Please note that Philips is currently not involved in any GHG removal and storage activities.
All our carbon offsets drive social, economic and environmental progress in emerging markets. Our projects include:
This carbon-emission reduction project is expected to provide millions of liters of safe drinking water in Uganda and reduce the mortality risk from water-borne diseases. Additionally, less wood will be required for boiling water, leading to less indoor air pollution and slowing down the deforestation rate. As such, this contributes to the protection of a biogenic sink. To ensure quality, all offsets are verified under the Gold Standard.
Planting trees is expected to improve livelihoods and address issues such as deforestation, biodiversity loss, and adaptation to climate change, as well as providing support and education on, among others, HIV and malaria. This project therefore enhances a biogenic sink. To ensure quality, all offsets are verified under the VCS standard.
Deforestation is expected to be reduced through promotion of sustainable businesses to protect the forest. Unsustainable harvest of fuelwood is reduced, thereby contributing to the protection of a biogenic sink. The forest supports the supply of water to other parts of Ethiopia and neighboring countries. It is also the habitat of diverse and, in some cases, rare species. To ensure quality, all offsets are verified under the VCS standard.
In India, the energy supply gap is reduced by providing access to clean energy and related employment through wind generation. This is therefore considered a technological solution that also enables an improvement in livelihoods. To ensure quality, all offsets are verified under the VCS standard.
By supporting a range of cookstove technologies across Ghana and Kenya, the projects improve respiratory health, reduce fuel costs and reduce deforestation. As such, this project contributes to the protection of a biogenic sink. This also gives people more time for paid work, thus improving prospects. To ensure quality, all offsets are verified under the Gold Standard.
Philips Group
Energy consumption
in megawatt hours (MWh) unless otherwise stated
| 2019 | 2020 | 2021 | 2022 | 2023 | |
|---|---|---|---|---|---|
| Fuel consumed from coal and coal products | |||||
| Fuel consumed from crude oil and petroleum products | 7,400 | 7,400 | 4,300 | 5,000 | 5,120 |
| Fuel consumed from natural gas | 127,300 | 126,400 | 116,300 | 97,700 | 84,853 |
| Fuel consumed from other non-renewable sources | |||||
| Consumption from nuclear products | |||||
| Consumption of purchased electricity, heat, steam, and cooling from non-renewable sources | 39,300 | 12,600 | 14,400 | 11,900 | 11,682 |
| Total non-renewable energy consumption | 174,000 | 146,400 | 135,000 | 114,600 | 101,656 |
| Fuel consumption from renewable sources (including biomass, biogas, non-fossil fuel waste, etc.) | |||||
| In-contract renewable electricity | 95,500 | 63,100 | 56,700 | 39,600 | 34,416 |
| Power Purchase Agreement (PPA) | 160,900 | 186,200 | 168,700 | 187,400 | 198,454 |
| Consumption of purchased electricity, heat, steam, and cooling from renewable sources | 124,500 | 130,000 | 161,300 | 152,300 | 119,778 |
| Total consumption of self-generated non-fuel renewable energy | 1,100 | 2,100 | 2,400 | 2,700 | 3,272 |
| Total renewable energy consumption | 382,000 | 381,400 | 389,100 | 382,000 | 355,921 |
| Share of non-renewable energy consumption (%) | 31% | 28% | 26% | 23% | 22% |
| Share of renewable energy consumption (%) | 69% | 72% | 74% | 77% | 78% |
| Share of renewable electricity consumption (%) | 95% | 100% | 100% | 100% | 100% |
| Total energy consumption | 556,000 | 527,800 | 524,100 | 496,600 | 457,576 |
| Net revenue in millions of EUR | EUR 17,827 | EUR 18,169 | |||
| Operational energy efficiency in MWh/million EUR sales1) | 27.86 | 25.18 |
No capital expenditures have been made related to coal, oil or gas-related economic activities. There have also not been any site-related investments in 2023 with locked-in GHG emissions that might impede our renewable energy and/or emission-related targets. On the contrary, by signing new long-term Power Purchase Agreements, we have been able to secure the delivery of renewable energy for the future.
At Philips, we apply an internal carbon shadow discount price for our IT, Real Estate, businesses and R&D investments. If an investment may support our climate targets by reducing CO2-e emissions, the relevant function and/or business is encouraged to apply EUR 150 discount per saved tonne CO2-e. This enables all functions and businesses to incorporate climate impacts in their business case development. Furthermore, by using a discount we proactively incentivize the pursuit of sustainable projects, rather than imposing penalties on unsustainable investments. The scope spans all Philips operations and includes Scope 1 and 2 emissions, as well as all the four material Scope 3 categories. There are no geographic or business-specific boundaries.
The price of EUR 150 per metric ton CO2-e is derived from the internationally recognized ReCiPe methodology, in combination with the environmental pricing provided by CE Delft. This is also in alignment with our EP&L account. The key assumption is that the price of carbon will increase in the future. Therefore, to ensure price stability over the coming years, an uplift was applied to the price of carbon, identified by CE Delft.
Philips Group
Carbon pricing
in tonnes CO2-equivalent unless otherwise stated
| Type of carbon price | Volume at stake (tCO2-e) | Price applied (EUR/tCO2-e) | Perimeter description |
|---|---|---|---|
| Shadow discount price (CAPEX, R&D, etc.) | 4,995,174 | 150 | All Philips employees are encouraged to leverage the internal carbon price of 150 EUR to include environmental factors in the decision making process |
Philips recognizes the importance of identifying, assessing and mitigating climate-related risks to ensure business continuity and resilience. We publish the annual Task Force on Climate-related Financial Disclosures (TCFD) recommendations to provide the information needed by investors, lenders, insurance underwriters and other stakeholders to appropriately assess and price climate-related risks and opportunities. Please see the visual below for an indication of Philips' climate-related risks.
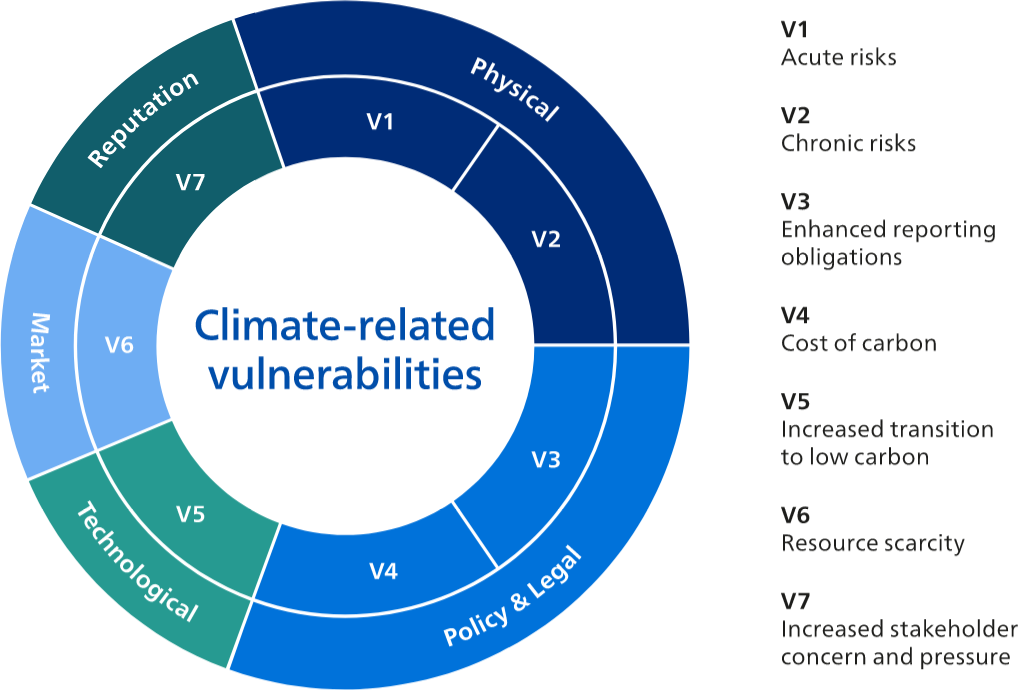
In 2023, our primary goal was to further enhance our understanding of both physical and transition climate risks in order to enable comprehensive quantification and disclosure of climate risks in Philips’ Annual Report 2024. The management of climate-related risks is integrated into Philips’ regular risk management process. This ensures alignment with the risk management team, increasing cross-business comparability and integration with already existing risk-screening procedures. The scope of the Physical hotspot analysis spans all Philips sites, as well as the most critical suppliers. The transition risk exploration involves Philips’ entire value chain, including our own operations as well as upstream and downstream activities.
In order to thoroughly evaluate the impact and resilience of climate-related risks, we provide a comprehensive overview of the climate-related risks and opportunities landscape and how these can be assessed in the context of various Representative Concentration Pathways (RCPs), Shared Socioeconomic Pathways (SSPs), and specific topic scenarios, such as the IEA Net Zero Emissions by 2050 Scenario (NZE Scenario). Physical risk factors were evaluated on a site-specific level by exploring our 23 manufacturing sites in depth. Other non-manufacturing sites and critical suppliers were also screened for their risk exposure. Transition risks, on the other hand, were assessed on a company level and by subject matter experts. The reason for this differentiation is because physical risks vary on a regional level, while transition forces generally apply on a global scale.
In our efforts to gain insight into physical risks, we have conducted hotspot analyses for each manufacturing site, leveraging the external Munich RE NATHAN tool to identify physical material risks. The tool assessed which of the following hazards are most threatening in the short, medium, and long term, accounting for a 4 ºC global warming scenario (SSP5/RCP8.5): drought, heat stress, wildfire, precipitation, river flood, storm, and cold stress. Furthermore, we have conducted annual in-depth assessments at each site to broaden our internal knowledge, obtaining insights from Environmental, Health and Safety Managers, Business Continuity Managers, and Plant Site Managers. By doing so, we have gained a profound understanding of Philips’ resilience towards climate change and the effectiveness of existing adaptation measures. For more information on this please refer to our TCFD disclosures.
Transition risks have been assessed in line with low global warming scenarios limiting global warming to 1.5 ºC, with limited overshoot (SSP1/RCP1.9 and SSP1/RCP2.6). The risks have been evaluated across five key domains: technological, market, reputational, policy, and legal. Collaboration with internal subject matter experts has ensured a holistic evaluation of the risks and opportunities associated with the movement towards a low-carbon future. Particularly, the inclusion of a quantitative assessment for carbon pricing transition risk in a Net Zero Emissions by 2050 Scenario (NZE Scenario) marks a milestone in our assessment. This provides stakeholders with a clearer understanding of potential financial implications and necessary climate mitigation measures associated with our commitment to a low-carbon future.
The transition from a linear to a circular economy is essential to create a sustainable world that functions within the constraints of our one planet. Globally, today more than 90% of used materials go to waste each year, with electronic waste being one of the fastest growing waste streams in the world. The healthcare industry is also a resource-intense industry which, according to the Circularity Gap Report 2020, consumes 10% of materials used globally, every year.
The Circular Economy program at Philips ran for the 11th year in 2023. We apply Philips’ circularity principles ‘use less, use longer and use again’ across five strategic areas:
Our journey towards a circular economy is first and foremost focused on how we help our customers to do more with less materials. Across Philips’ portfolio, our businesses provide consumers and customers with products, services, and solutions based on circular practices that also can reduce carbon emissions. We do this by reducing the use of virgin materials, for example by using recycled content, innovative service-based models, digital solutions, optimizing the use of products, and recirculating materials through responsible end-of-use management. Philips also leverages partnerships to help scale the circular economy globally. For example, we have worked closely with the Platform for Accelerating the Circular Economy (PACE) and the World Business Council for Sustainable Development (WBSCD) to harmonize metrics; see Advocacy activities and expenses. Building and nurturing communities within Philips is also an essential part of the transformation. In 2023, we continued to provide our employees with access to Ellen MacArthur Foundation’s Basic Course for a Circular Economy and the Circular Economy Masterclass from University of Exeter Business School, training over 100 employees. In 2023, we also continued to upskill dedicated target groups, including our R&D teams, on circular design, sales professionals on circular propositions, and employees at our sites on circular materials management.
Philips' circular journey is also closely connected with the developments around regulations, metrics and reporting. Together with other companies, Philips is actively supporting global and national governments in creating impactful and practical laws, regulations, and guidelines. For instance, we have a leading role in the Dutch Circular Economy Agenda (NPCE).
We have committed to achieving ambitious and voluntary circularity targets by 2025, and our key actions are linked to delivering on these targets. These are also in line with our Environmental Policy, aiming to minimize the use of virgin materials. Our targets relate to increasing the circularity of our resource inflows and outflows as depicted in the following table. The progress towards accomplishing these targets is internally monitored on at least a quarterly basis, with quarterly progress externally reported via the Philips results hub. For an overview of the 2023 results, see Circular Economy.
Philips Group
Philips 2025 targets linked to its circularity ambitions
| Increase circular design | Increase circular material use rate | Minimize primary raw materials | Increase renewable resources | Ensure waste management | |
|---|---|---|---|---|---|
| Circular revenues | √ | √ | √ | √ | |
| Zero waste to landfill | √ | √ | |||
| Circular materials management | √ | √ | |||
| Close the loop on medical equipment | √ | √ |
Philips looks at circularity in its broadest sense, namely how we can deliver maximum value with the minimum amount of materials. This means addressing not only the type and weight of the materials we use, but also, for example, the efficiency (e.g. though digitalization), value-add (upgrades) and take-back of our innovations. We use Circular revenues as an overarching metric that collates practices at Philips related to products, services and solutions that contribute to circularity. It measures the revenue contributions across 4 of our 5 strategic areas for circularity – from design to responsible end-of-use management. For the 5th area, manufacturing and supply, we have separate targets on Zero waste to landfill and Circular materials management that address waste management at our sites (see Sustainable Operations for more information). Propositions that qualify for circular revenues must comply with the requirements for at least one of the circular revenue categories. These include, among others, products with low weight or containing a minimum threshold of recycled or bio-based plastics, as-a-service models, software running on cloud, telehealth, upgrades, lifetime extensions, and refurbished equipment. Each contribution is underpinned and connected to sales via Philips management accounting data for sales or connected via inputs linked to other IT systems. Circular revenues provide us with an integral overall view of how we progress, and the scientific impact is measured through our material flow metrics.
One important way to look at the impact of our circularity metrics is to look at material flows. Therefore, in addition to tracking progress towards our circularity ambitions, we are also improving transparency on Philips' material flows. In 2023, Philips put a total weight of 102 kilotonnes of products, parts and packaging on the market, plus 19 kilotonnes of waste and less than 0.1 kilotonnes of chemicals via emissions. The reference products in the EP&L are used as the basis for the products and parts (refer to Environmental performance for more information). It should be noted that the Philips material flow is outflow-based, with the assumption that the total material inflow into Philips equals the total material outflow. The main materials that Philips used in 2023 for its products, parts and packaging include paper and cardboard, plastics and metals.
As part of our continuous drive to further improve transparency, Philips has also started to disclose information about recycled content, renewable materials, and critical and strategic raw materials. See the section Circular design of software and hardware. Furthermore, we also disclose data on secondary re-used materials and what is recycled after use, building on weight data that has already been disclosed in previous Annual Reports. See the section Circular end-of-use management. The data sources and processes we have in place for reporting ensure there is no double-counting. The re-used weights from our refurbished equipment are calculated based on a 3-year average re-use % per equipment multiplied by its original weight. For X-ray tubes, only the re-used material weight is considered. For the re-used and refurbished products from Personal Health, as well as re-used spare parts for our medical equipment, we have assumed that all product and part weight has been re-used. For recycled products, however, Philips reports on materials that are recycled into raw materials through our certified recycling network or via national recycling schemes. The latter is also distinct from recycled content in the materials of products and packaging that we bring to market.
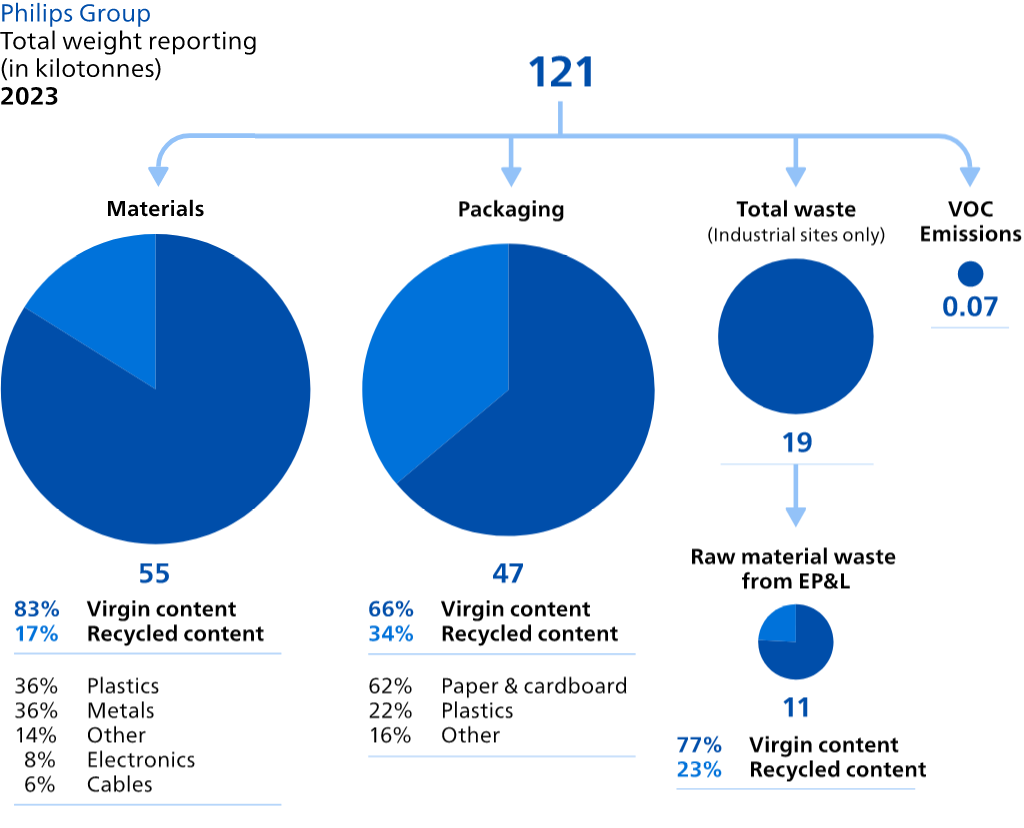
Our EcoDesign program is a key enabler to lower our overall environmental footprint and is thus a key driver for our Circular Economy program. By 2025, we will design all our new products introductions in line with our EcoDesign requirements. This also includes circular design, which encompasses, for example, the application of recycled and bio-based materials and designing for low weight, long life, disassembly, and recycling. A subset of EcoDesigned products, which outperform on circular design, will be counted as contributing to circular revenues. These include, for example, products that meet defined thresholds on reduced weight compared to competitor products or their predecessors. These EcoDesigned contributions were equivalent to 1.9% circular revenues in 2023. Examples include our CT Incisive platform, which weighs up to 24% less compared to Ingenuity, avoiding 720 kg of virgin materials.
We are working towards increasing the percentage of recycled content in the materials we use to reduce the use of virgin materials. In 2023, Philips used 23% of recycled content in our material flows, mainly from packaging. Our Personal Health business units also have multiple products with recycled materials – for example, our OneBlade has durable stainless-steel blades made with an average of 88% recycled steel. Across our Diagnosis & Treatment and Connected Care segments, recycled materials are mainly from metals used in our products (40% building on global recycling data from UNEP). Where possible, we also use renewable materials, which today mostly stem from our paper and cardboard packaging (65% of total renewable materials), towards which our Personal Health business units are increasingly shifting. We are increasingly applying renewable materials in our products. For example, this year we launched our first brush-head with bio-based plastics in our Oral Healthcare business unit. We understand that our value chain also has an impact on nature, specifically related to virgin renewable raw materials. Therefore, Philips is taking steps to confirm that the virgin renewable resources used are sustainably sourced, such as FSC-certified cardboard. We are also working to improve transparency on our use of critical and strategic raw materials as defined by the European Commission. Our current data shows we put almost 0.24 kilotonnes of critical raw materials and 3 kilotonnes of strategic raw materials to the market. We have low visibility on critical raw materials in, for example, PCBAs and are working to improve this. Helium is an example of a strategic raw material: innovations like Philips BlueSeal magnet technology help to reduce the use of this scarce resource. With over 860 units installed globally, MRI scanners equipped with Philips BlueSeal magnet technology have already saved more than 1.5 million liters of helium since 2018*).
Building on the further sharpening of circular design requirements in 2022, we continued with deployment and trained our R&D staff to apply circular design through assessments, guidelines, tools and training. To monitor the continued progress on, for example, repairability and recyclability, we will continue to develop internal tools while also aligning with emerging global standards. Examples of what we already do today to improve recyclability include phasing-out chemicals like PVC and BFR to make our products easier to recycle.
Philips Group
Circular design metrics
in kilotonnes and %
| Material flow metrics | 2023 |
|---|---|
| Recycled content in materials | 28 kilotonnes / 23% |
| Renewable materials | 35 kilotonnes / 29% |
| Critical raw materials | 0.24 kilotonnes / 0.2% |
| Strategic raw materials | 3 kilotonnes / 2% |
In line with our ambition for fully circular operations, Philips applies Lean methodologies to improve processes and continuously reduce the environmental footprint across our sites. Circular materials management is our leading KPI and is not expressed in circular revenues. We retain as much as possible material value of our waste stream through responsible waste management and increasing circular practices at our sites. We team up with our supply chain partners to find circular solutions for discarded materials, for example in the 'waste to value' initiative. For inbound supplier packaging, we aim to replace single-use packaging with more sustainable solutions like reusable boxes in order to contribute to our packaging waste ambitions from recycling to re-use and reduce. For more information, please refer to Sustainable Operations.
Circular delivery and financing models enable ecosystem partners, including customers and suppliers, to work closely together on products that incentivize material efficiency across the value chain. This includes leasing, rentals, and service-based models. Amounting to 5.5% of circular revenues in 2023 and including for example Enterprise Monitoring as a Service (EMaaS) and mobile cardiac telemetry monitoring, where monitors and wearable sensors are returned and processed to be used again. Within Diagnosis & Treatment, Agito Medical has a rental solutions fleet that in 2023 amounted to almost 50 imaging solutions, including MR, CT and Cath Lab systems from Philips, but also from other original equipment manufacturers. For our consumer products, we offer, for example, rental programs for Lumea IPL and the Avent breastpump. When the rental period is over, we take the product back and wherever possible, refurbish it so it can be used by another consumer. Circular delivery models also include digital solutions that drive dematerialization, helping to further reduce use of virgin materials. Our businesses continue to shift their solutions towards the cloud, which uses significantly less resources compared to running these solutions on IT hardware on premises. With regard to our virtual care offerings, the eICU program at Emory Healthcare led to a 4.9% increase in discharge to home healthcare and 2.1% decrease in 60-day inpatient readmissions.
During the use-phase of our products, we help our customers to optimize the use of our products to maximize their value. In 2023, this amounted to 9.2% circular revenues. In 2023, we upgraded almost 3,000 medical systems around the globe combined for MR, CT, Image Guided Therapy and Ultrasound**). For example, our MR SmartPath portfolio helps customers to re-use their existing magnets and convert these to the next-generation MR, while our software upgrades like SmartSpeed can scan up to three times faster***) while reducing power consumption on average by 32% per patient scan while still using the same equipment****) . In Personal Health, more than 1,300 consumer replaceable parts and spare parts are available, allowing consumers to keep products longer by exchanging parts or repairing their products via their local repair shop.
Keeping materials in circulation is a vital element of the circular economy, and Philips strives to recirculate products and parts that come back to our operations. This amounted to 3.3% in 2023. In 2023, we brought 1,700 tonnes, or approximately 1.5% of secondary re-used materials, back to the market. The main pathways for material re-use were:
Philips’ commitment to close the loop, announced at Davos 2018, has helped us scale our circular ambitions by building a strong case for the end-to-end value of our large medical equipment. By the end of 2020, Philips ‘closed the loop’ on its large medical equipment by structurally embedding a responsible take-back policy into its customer trade-in offers. This means that for all equipment that a customer is willing to trade-in at end of use, Philips will, where feasible, take it back for refurbishment and/or parts recovery, or locally recycle it in a certified way to ensure it does not end up in landfill. The products and parts are then broken down into the main material fractions and provided to the market via our recycling partners. Following our policy implementation for our large medical equipment, Philips is now extending its ’closing the loop’ program to small medical equipment by adapting this policy to fit with the different value drivers, distribution channels and modalities of small equipment. By 2025, we aim to have a policy in place to responsibly take-back all professional medical equipment sold directly to customers as part of a trade-in offer or as a service at customer request. Like large medical equipment, small medical equipment will, where feasible, be taken back for refurbishment and parts recovery, or for local recycling.
We have more than 25 years of experience providing hospitals with refurbished systems. Our refurbished portfolios (Circular Edition), offer ‘as good as new’ refurbished imaging systems across MR, CT, Ultrasound and Image Guided Therapy, with the same high-quality standards, warranty and services as you expect from new Philips systems. Our Circular Edition refurbishment factories are fully compliant with ISO standard 13485. The re-use of materials in our Circular Edition portfolios reduces Scope 3 emissions for our customers by avoiding the use of virgin materials. For example, the carbon footprint of a refurbished MR system is 45% lower than of a new system, when used in France*****).
Operationalizing our ’closing the loop’ commitment has reduced our environmental footprint by improving the visibility of our installed base, enabling us to reclaim more and triage for re-use at highest value. In 2023, Philips:
In 2023, we offered refurbished products in 12 countries, with the ambition to add more. Our refurbished products include Lumea IPL, shavers, hair care products and baby monitors – these products also come with a warranty. In Germany, we launched a ‘Better than New’ campaign focused on increasing consumer awareness and meeting rising demand for refurbished products.
While we proactively engage with our Business-to-Business customers, including retailers, to responsibly take care of products at end-of-use, products do not always return to us, especially our consumer products. These are discarded by consumers at the end of their useful life, and they are eventually processed by national collection and recycling schemes. Europe has advanced schemes, and in accordance with the recycling rates published for packaging and the EU Waste Electrical and Electronic Equipment (WEEE) regulations, we estimate that approximately 11,800 tonnes of products (in WEEE category 5) and packaging from our Personal Health business units were recycled in the European Union in 2023. This is an increase compared to the previous year (5,200 tonnes), which is mainly attributable to updating our methodology to include packaging in our calculations, but also shifting to the new WEEE categories. This applies to consumer products only and does not include our medical equipment. Since medical equipment is now spread across multiple WEEE categories, we were unable to provide reasonable recycling estimates for our Diagnosis & Treatment and Connected Care segments. We will continue improving our reporting on recycled products, which will require global standards and harmonized data collection across the globe.
Philips Group
Circular end-of-use metrics
in tonnes and %
| 2023 | |
|---|---|
| Secondary re-used materials | 1,700 tonnes / 1.5% |
More information can be found on the Philips circular economy website.
Our Sustainable Operations programs relate to improving the environmental performance of our manufacturing facilities and focus on most of the contributors to climate change, but also address water, recycling of waste and chemical substances.
Philips Group
Sustainable Sites
| baseline year 2020 | target 2025 | 2023 actual | |
|---|---|---|---|
| Total CO2 from manufacturing | 0 Ktonnes | 0 Ktonnes | 0 Ktonnes |
| Water withdrawal* | 710,108 m3 | 5% reduction | 661,076 m3 |
| Zero waste to landfill | 2.6% | less than 0.5% | 0.0% |
| Circular Materials Management | 90% | 95% | 91% |
| Hazardous substances emissions | 2,465 kilos | 25% reduction | 1,300 kilos |
| VOC emissions | 79 tonnes | 10% reduction | 74 tonnes |
Total energy consumption in manufacturing amounted to 322,532 megawatt hours (MWh) in 2023, which is a 5% reduction compared to the 338,140 MWh in 2022. Diagnosis & Treatment accounted for about 52% and Personal Health 36% of the consumption. Diagnosis & Treatment energy consumption decreased by 2%, mainly due to energy savings plans in our large sites and better weather conditions. Connected Care reported a 5% reduction due to changes in the operations. Energy consumption at Personal Health decreased by 8%, mainly driven by the reduced production volumes and improved energy efficiency.
Philips Group
Total energy consumption in manufacturing1)
in megawatt hours (MWh)
| 2019 | 2020 | 2021 | 2022 | 2023 | |
|---|---|---|---|---|---|
| Diagnosis & Treatment | 151,945 | 161,111 | 175,278 | 169,893 | 166,461 |
| Connected Care | 78,056 | 63,611 | 44,722 | 41,509 | 39,523 |
| Personal Health | 134,722 | 114,445 | 130,834 | 126,738 | 116,548 |
| Philips Group | 364,723 | 339,167 | 350,834 | 338,140 | 322,532 |
Greenhouse gas emissions from our manufacturing operations totaled 14,078 tonnes CO2-equivalent in 2023, 2% lower than in 2022. Mainly driven by the energy saving projects, fossil fuel reduction and operational changes in different locations. CO2 emissions from electricity remained zero due to the use of 100% electricity from renewable sources. Emissions from other greenhouse gases increased due to higher usage of refrigerants.
Philips Group
Total carbon emissions in manufacturing per segment
in tonnes CO2-equivalent
| 2019 | 2020 | 2021 | 2022 | 2023 | |
|---|---|---|---|---|---|
| Diagnosis & Treatment | 9,601 | 9,085 | 8,625 | 6,868 | 7,437 |
| Connected Care | 4,897 | 4,031 | 2,441 | 2,689 | 2,554 |
| Personal Health | 6,147 | 5,294 | 5,413 | 4,771 | 4,087 |
| Philips Group | 20,645 | 18,410 | 16,479 | 14,328 | 14,078 |
Diagnosis & Treatment CO2 emissions increased by 569 tonnes CO2-equivalent, 8% due to increased emissions from refrigerants in India. Connected Care reported a slight decreased. At Personal Health, CO2 emissions increased due to higher refrigerants refills .
In 2023, all manufacturing sites received 100% of their electricity from renewable sources. Our operations in the US have been powered by wind energy since 2017 from the Los Mirasoles windfarm. Additionally, our operations in the Netherlands have received electricity from the Bouwdokken and Krammer wind farms since 2019, all helping to deliver on the ambition to remain carbon-neutral in our operations.
Compared to heavy industry, our sites have relatively few chemical emissions and we have voluntary targets to reduce them. However, most of our manufacturing operations have processes that result in some emissions to air and water. Therefore, we carefully monitor all emissions and are working to limit hazardous chemical and VOC emissions. Many of these decisions happen at the product and process design stage.
Philips Group
Hazardous substances emissions
| 2019 | 2020 | 2021 | 2022 | 2023 | |
|---|---|---|---|---|---|
| Diagnosis & Treatment | 104 | 92 | 181 | 175 | 158 |
| Connected Care | 46 | 20 | 1,239 | 863 | 781 |
| Personal Health | 336 | 455 | 1,242 | 510 | 362 |
| Philips Group | 486 | 567 | 2,662 | 1,548 | 1,300 |
At Philips, we want to track the impact of chemical substances on a life-cycle basis and, based on a risk-level classification and precautionary principle, to ensure implementation in an active and practical way. The Classified Substances List (CSL) has been set up to manage, restrict, control and/or monitor chemical substances according to regulation requirements and/or known risks. In its CSL, Philips captures all substances with no current legislative restriction, but a foreseen, future indication as ‘Risk Level II’, requiring action to evaluate the measures to reduce exposure and emissions and, if possible, to evaluate and implement less harmful alternatives. For its chemicals reduction program ending in 2020, Philips used the CSL from 2015. In 2021, with the start of the new 5-year program, we applied the latest CSL, which includes many more chemicals. Therefore, the 2021 results are significantly higher than the 2020 results. In 2023, we continued to phase out and replace hazardous substances at our industrial sites. The hazardous substances emissions amounted to 1,300 kg in 2023, which is a 16% reduction compared to the 1,548 kg in 2022. In the Diagnosis & Treatment segment the emissions decreased by10%. The emissions in the Connected Care segment amounted to 781 kg, which is a 10% reduction compared to the prior year caused by replacing harmful chemicals and lower production volumes in a factory in Asia. In the Personal Health segment the hazardous substances emissions were 362 kg in 2023, a significant 29% reduction due to more efficient processes.
Philips Group
VOC emissions
in tonnes
| 2019 | 2020 | 2021 | 2022 | 2023 | |
|---|---|---|---|---|---|
| Diagnosis & Treatment | 46 | 44 | 42 | 38 | 34 |
| Connected Care | 6 | 3 | 3 | 2 | 2 |
| Personal Health | 54 | 32 | 33 | 37 | 38 |
| Philips Group | 106 | 79 | 78 | 77 | 74 |
Volatile Organic Compounds (VOC) can react with nitrogen oxides (NOx) and other harmful compounds to create highly toxic particulates (PM 2.5), often referred to as ground-level harmful smog, which stimulate disease in plants, inhibit seed production, and hinder fertilization. Philips is focused on reducing direct exposure impact and atmospheric photochemical reactions for the benefit of exposed employees, the general public and local and global ecosystems.
VOC emissions decreased by 4% in 2023, 74 tonnes compared to 77 tonnes in 2022. The Diagnosis & Treatment businesses, which represent 46% of total VOC emissions, decreased by 11% due to process optimizations and changes in production. VOC emissions in the Connected Care businesses decreased due to lower production levels, and VOC emissions in the Personal Health business units (representing 51% of total VOC emissions) increased slightly, mainly driven by the increased production volume in a factory in Asia.
The Philips manufacturing sites are certified individually. In 2023, 96% of reporting manufacturing sites were certified. The one site which is not certified yet, is planning to have the certificate in 2024. The integration of newly acquired companies is in progress; smaller sites are required to maintain robust environmental management systems while external certification is not mandatory.
Philips Group
ISO 14001 certifications
as a % of all reporting organizations
| 2019 | 2020 | 2021 | 2022 | 2023 | |
|---|---|---|---|---|---|
| Philips Group | 79% | 81% | 92% | 96% | 96% |
In 2023, three environmental incidents were reported by three Diagnosis & Treatment sites. One incident was related to emissions to air due to leakage, one was related to water discharge and one to a diesel spill. These incidents were followed by investigations and remedial actions. Furthermore, one site reported a non-compliance which was related to wastewater discharge. No fines were issued.
No environmental incidents nor non-compliances were reported by Connected Care sites.
In Personal Health, one site reported two environmental incidents. One was related to handling chemical waste and hazardous materials. The other incident was due to a wastewater leakage, where immediate actions were taken. There was no groundwater pollution, although minor contamination was detected on the upper soil. Furthermore, two non-compliances were reported which were related to noise and water discharge requirements. No fines were issued.
To find out about our sustainability results at global and regional and market level, go to the Philips results hub.
Philips Group
| Market | Manufacturing sites | Total recordable case rate1) | CO2 emitted (Tonnes CO2) | Waste (Tonnes) | CMM (%) | Water (m3) | Hazardous substances (kg) | VOC (Tonnes) |
|---|---|---|---|---|---|---|---|---|
| APAC | 1 | 0.00 | 1,998 | 3,139 | 98% | 110,461 | 60 | 27,824 |
| Benelux | 2 | 0.18 | 3,478 | 6,100 | 87% | 72,173 | 153 | 12,102 |
| Central Eastern Europe | 0 | 0.00 | ||||||
| DACH | 3 | 0.49 | 2,583 | 2,296 | 93% | 38,752 | 23 | 4,553 |
| France | 0 | 0.11 | ||||||
| Greater China | 5 | 0.21 | 962 | 2,020 | 95% | 153,110 | 928 | 4,580 |
| Iberia | 0 | 0.34 | ||||||
| IIG | 1 | 0.26 | 449 | 560 | 81% | 11,958 | - | 198 |
| Indian Subcontinent | 1 | 0.03 | 746 | 194 | 100% | 18,018 | 17 | 104 |
| Japan | 0 | 0.29 | ||||||
| Latam | 2 | 0.08 | 339 | 809 | 87% | 72,634 | 1 | 14,251 |
| META | 0 | 0.11 | ||||||
| Nordics | 0 | 1.35 | ||||||
| North America | 8 | 0.47 | 3,523 | 4,257 | 91% | 183,970 | 118 | 10,320 |
| Russia, Central Asia | 0 | 0.00 | ||||||
| UK & Ireland | 0 | 0.11 |
The aim of the European Taxonomy Regulation (EU 2020/852), including the delegated acts adopted thereunder, is to provide companies, investors and policymakers with appropriate criteria for determining which economic activities can be considered environmentally sustainable, and it requires companies to report on how and to what extent their activities are associated with such ‘taxonomy-eligible activities’. The Taxonomy Regulation is relatively new and still under development (e.g. changes to the first Delegated Act, changes in presentation format), leaving still significant uncertainties around its phased implementation. It is expected, however, that the EU Taxonomy will develop into a comprehensive and detailed framework over the coming years.
The Taxonomy Regulation provides certain conditions for taxonomy alignment. Among others, the relevant activity must substantially contribute to one or more of the following six environmental objectives (while not significantly harming any of the others):
The delegated acts adopted under the Taxonomy Regulation provide technical screening criteria which must also be met to constitute taxonomy alignment. In 2023, the second Delegated Act was published concerning activities significantly contributing to environmental objectives 3-6 above.
The taxonomy framework provisions effective on the date of this Annual Report require Philips to disclose the proportion of its taxonomy-eligible activities (described in any delegated act adopted to date) and non-eligible economic activities in its total turnover, capital and operational expenditure, as well as certain qualitative information for environmental objectives 1-6. We used the Regulation (EU) 2020/852 as supplemented with Commission Delegated Regulation (EU) 2021/2139, Commission Delegated Regulation (EU) 2021/2178, Commission Delegated Regulation (EU) 2023/2485 and Commission Delegated Regulation (EU) 2023/2486) to identify activities that are eligible. Consequently, 98.7% of Philips’ revenues were eligible under these delegated acts during 2023. All remaining revenues were non-eligible (1.3%). We used delegated act (EU) 2021/2178, 2023/2485 and 2023/2486 for the definition and calculation of the taxonomy-eligible percentages. Revenue is calculated based on ’Sales’ as per Consolidated statements of income.
Reportable taxonomy-eligible capital expenditures in 2023 amounted to EUR 636 million, or 64.6% of total capital expenditure (non-eligible capital expenditures 35.4%). Some other (enabling) Philips activities are included in the delegated act ((EU) 2021/2139) and are eligible for capital expenditures for the objective of climate change mitigation and climate change adaptation to be reported over 2023. We therefore screened (EU) 2021/2139, assessed our capital expenditure, and identified relevant activities mainly related to our real estate portfolio. For these activities, capital expenditures are determined based on the 2023 additions to property, plant and equipment, intangible assets, and additions to right-of-use assets, excluding any re-assessments (refer to Property, plant and equipment and Intangible assets excluding goodwill).
Reportable taxonomy-aligned capital expenditures in 2023 amounted to EUR 4 million, or 0.4% of total capital expenditure (non-aligned capital expenditures 99.6%), and mainly related to energy efficiency improvement measures in our buildings (installation, maintenance, and repair of energy efficiency equipment), such as energy-efficient heating, ventilation, and air conditioning (HVAC) in various locations around the world. Next, we invested in onsite renewable electricity generation (installation, maintenance and repair of renewable energy technologies) by installing PV (solar) panels in one of our factories in Asia.
We assessed compliance with the criteria set out in Article 3 of Regulation (EU) 2020/852 and the associated technical screening criteria on a project basis.
Similar to capital expenditures, we screened (EU) 2021/2139 for relevant operational expenditure activities. Total operational expenditures are determined based on the 2023 non-capitalized costs that relate to research and development, building renovation, short-term lease, maintenance and repair, and any other direct expenditures relating to day-to-day servicing of property, plant and equipment. Reportable taxonomy-eligible operational expenditures in 2023 amounted to EUR 2,008 million, or 84.8% of total operational expenditures expenditure (non-eligible operational expenditures 15.2%), In 2023, we did not record reportable taxonomy-aligned operational expenditures (0%), as for example, the sourcing of renewable energy is not included in the Taxonomy. Non-aligned operational expenditures were 100%.
We followed the same accounting principles as in our financial statements.
We will continue to monitor legislative developments and adapt our disclosures where needed.
Philips Group
Proportion of turnover from products or services associated with Taxonomy-aligned economic activities – 2023
in millions of EUR unless otherwise stated
| Financial year | Year | Substantial Contribution Criteria | DNSH criteria ('Does Not Significantly Harm')(h) | ||||||||||||||||
|---|---|---|---|---|---|---|---|---|---|---|---|---|---|---|---|---|---|---|---|
Economic Activities (1) | Code (a) (2) | Turnover (3) | Proportion of Turnover, 2023 | Climate Change Mitigation (5) | Climate Change Adaptation (6) | Water (7) | Pollution (8) | Circular Economy (9) | Biodiversity (10) | Climate Change Mitigation (11) | Climate Change Adaptation (12) | Water (13) | Pollution (14) | Circular Economy (15) | Biodiversity (16) | Minimum Safeguards (17) | Proportion of Taxonomy aligned (A.1.) or eligible (A.2.) turnover, 2022 (18) | Category enabling activity (19) | Category transitional activity (20) |
| EUR | % | Y; N; N/EL (b) (c) | Y; N; N/EL (b) (c) | Y; N; N/EL (b) (c) | Y; N; N/EL (b) (c) | Y; N; N/EL (b) (c) | Y; N; N/EL (b) (c) | Y/N | Y/N | Y/N | Y/N | Y/N | Y/N | Y/N | % | E | T | ||
| A. TAXONOMY-ELIGIBLE ACTIVITIES | |||||||||||||||||||
| A.1. Environmentally sustainable activities (Taxonomy-aligned) | |||||||||||||||||||
| Turnover of environmentally sustainable activities (Taxonomy-aligned) (A.1) | 0 | 0% | 0% | ||||||||||||||||
| Of which Enabling | 0 | 0% | 0% | E | |||||||||||||||
| Of which Transitional | 0 | 0% | 0% | T | |||||||||||||||
| A.2 Taxonomy-Eligible but not environmentally sustainable activities (not Taxonomy-aligned activities) (g) | |||||||||||||||||||
| EL; N/EL (f) | EL; N/EL (f) | EL; N/EL (f) | EL; N/EL (f) | EL; N/EL (f) | EL; N/EL (f) | ||||||||||||||
| Manufacture of electrical and electronic equipment | CE1.2 | 13,366.54 | 73.6% | N/EL | N/EL | N/EL | N/EL | EL | N/EL | N/A | |||||||||
| Provision of IT/OT data-driven solutions | CE4.1 | 929.18 | 5.1% | N/EL | N/EL | N/EL | N/EL | EL | N/EL | N/A | |||||||||
| Repair, refurbishment and remanufacturing | CE5.1 | 40.15 | 0.2% | N/EL | N/EL | N/EL | N/EL | EL | N/EL | N/A | |||||||||
| Sale of spare parts | CE5.2 | 42.88 | 0.2% | N/EL | N/EL | N/EL | N/EL | EL | N/EL | N/A | |||||||||
| Product-as-a-service and other circular use- and result-oriented service models | CE5.5 | 3,552.18 | 19.6% | N/EL | N/EL | N/EL | N/EL | EL | N/EL | N/A | |||||||||
| Turnover of Taxonomy-eligible but not environmentally sustainable activities (not Taxonomy-aligned activities) (A.2) | 17,930.94 | 98.7% | |||||||||||||||||
| A. Turnover of Taxonomy eligible activities (A.1+A.2) | 17,930.94 | 98.7% | |||||||||||||||||
| B. TAXONOMY-NON-ELIGIBLE ACTIVITIES | |||||||||||||||||||
| Turnover of Taxonomy-non-eligible activities | 238.17 | 1.3% | N/A | ||||||||||||||||
| TOTAL | 18,169.11 | 100% | N/A | ||||||||||||||||
Philips Group
Proportion of CapEx from products or services associated with Taxonomy-aligned economic activities – 2023
in millions of EUR unless otherwise stated
| Financial year | Year | Substantial Contribution Criteria | DNSH criteria ('Does Not Significantly Harm')(h) | ||||||||||||||||
|---|---|---|---|---|---|---|---|---|---|---|---|---|---|---|---|---|---|---|---|
Economic Activities (1) | Code (a) (2) | CapEx (3) | Proportion of CapEx, 2023 (4) | Climate Change Mitigation (5) | Climate Change Adaptation (6) | Water (7) | Pollution (8) | Circular Economy (9) | Biodiversity (10) | Climate Change Mitigation (11) | Climate Change Adaptation (12) | Water (13) | Pollution (14) | Circular Economy (15) | Biodiversity (16) | Minimum Safeguards (17) | Proportion of Taxonomy aligned (A.1.) or eligible (A.2.) CapEx, 2022 (18) | Category enabling activity (19) | Category transitional activity (20) |
| EUR | % | Y; N; N/EL (b) (c) | Y; N; N/EL (b) (c) | Y; N; N/EL (b) (c) | Y; N; N/EL (b) (c) | Y; N; N/EL (b) (c) | Y; N; N/EL (b) (c) | Y/N | Y/N | Y/N | Y/N | Y/N | Y/N | Y/N | % | E | T | ||
| A. TAXONOMY-ELIGIBLE ACTIVITIES | |||||||||||||||||||
| A.1. Environmentally sustainable activities (Taxonomy-aligned) | |||||||||||||||||||
| Electricity generation using solar photovoltaic technology | CCM4.1 | 0.39 | 0% | Y | N | N/EL | N/EL | N/EL | N/EL | Y | Y | Y | Y | Y | Y | 0% | E | ||
| Renovation of existing buildings | CCM7.2 | 0.04 | 0% | Y | N | N/EL | N/EL | N/EL | N/EL | Y | Y | Y | Y | Y | Y | 0% | T | ||
| Installation, maintenance and repair of energy efficient equipment | CCM7.3 | 3.55 | 0.4% | Y | N | N/EL | N/EL | N/EL | N/EL | Y | Y | Y | Y | Y | Y | 1% | E | ||
| Installation, maintenance and repair of charging stations for electric vehicles | CCM7.4 | 0.03 | 0% | Y | N | N/EL | N/EL | N/EL | N/EL | Y | Y | Y | Y | Y | Y | 0% | E | ||
| CapEx of environmentally sustainable activities (Taxonomy-aligned) (A.1) | 4.01 | 0.4% | 100% | 0% | 0% | 0% | 0% | 0% | Y | Y | Y | Y | Y | Y | 1% | ||||
| Of which Enabling | 3.97 | 0.4% | 100% | 0% | 0% | 0% | 0% | 0% | Y | Y | Y | Y | Y | Y | % | E | |||
| Of which Transitional | 0.04 | 0% | 0% | Y | Y | Y | Y | Y | Y | % | T | ||||||||
| A.2 Taxonomy-Eligible but not environmentally sustainable activities (not Taxonomy-aligned activities) (g) | |||||||||||||||||||
| EL; N/EL (f) | EL; N/EL (f) | EL; N/EL (f) | EL; N/EL (f) | EL; N/EL (f) | EL; N/EL (f) | ||||||||||||||
| Electricity generation using solar photovoltaic technology | CCM4.1 | 0.01 | 0% | Y | N | N/EL | N/EL | N/EL | N/EL | 0% | |||||||||
| Construction of new buildings | CCM7.1 | 0.46 | 0% | Y | N | N/EL | N/EL | N/EL | N/EL | 0% | |||||||||
| Renovation of existing buildings | CCM7.2 | 30.62 | 3.1% | Y | N | N/EL | N/EL | N/EL | N/EL | 0% | |||||||||
| Installation, maintenance and repair of energy efficient equipment | CCM7.3 | 3.69 | 0.4% | Y | N | N/EL | N/EL | N/EL | N/EL | 0% | |||||||||
| Installation, maintenance and repair of charging stations for electric vehicles | CCM7.4 | 0.03 | 0% | Y | N | N/EL | N/EL | N/EL | N/EL | 0% | |||||||||
| Manufacture of electrical and electronic equipment | CE1.2 | 526.65 | 53.5% | N/EL | N/EL | N/EL | N/EL | EL | N/EL | N/A | |||||||||
| Provision of IT/OT data-driven solutions | CE4.1 | 42.15 | 4.3% | N/EL | N/EL | N/EL | N/EL | EL | N/EL | N/A | |||||||||
| Repair, refurbishment and remanufacturing | CE5.1 | 9.00 | 0.9% | N/EL | N/EL | N/EL | N/EL | EL | N/EL | N/A | |||||||||
| Sale of spare parts | CE5.2 | 0 | 0% | N/EL | N/EL | N/EL | N/EL | EL | N/EL | N/A | |||||||||
| Product-as-a-service and other circular use- and result-oriented service models | CE5.5 | 19.66 | 2.0% | N/EL | N/EL | N/EL | N/EL | EL | N/EL | N/A | |||||||||
| CapEx of Taxonomy-eligible but not environmentally sustainable activities (not Taxonomy-aligned activities) (A.2) | 632.32 | 64.2% | |||||||||||||||||
| A. CapEx of Taxonomy eligible activities (A.1+A.2) | 636.33 | 64.6% | 1 | ||||||||||||||||
| B. TAXONOMY-NON-ELIGIBLE ACTIVITIES | |||||||||||||||||||
| CapEx of Taxonomy-non-eligible activities | 349.09 | 35.4% | |||||||||||||||||
| TOTAL | 985.42 | 100% | |||||||||||||||||
Philips Group
Proportion of OpEx from products or services associated with Taxonomy-aligned economic activities – 2023
in millions of EUR unless otherwise stated
| Financial year | Year | Substantial Contribution Criteria | DNSH criteria ('Does Not Significantly Harm')(h) | ||||||||||||||||
|---|---|---|---|---|---|---|---|---|---|---|---|---|---|---|---|---|---|---|---|
Economic Activities (1) | Code (a) (2) | OpEx (3) | Proportion of OpEx, 2023 (4) | Climate Change Mitigation (5) | Climate Change Adaptation (6) | Water (7) | Pollution (8) | Circular Economy (9) | Biodiversity (10) | Climate Change Mitigation (11) | Climate Change Adaptation (12) | Water (13) | Pollution (14) | Circular Economy (15) | Biodiversity (16) | Minimum Safeguards (17) | Proportion of Taxonomy aligned (A.1.) or eligible (A.2.) OpEx, 2022 (18) | Category enabling activity (19) | Category transitional activity (20) |
| EUR | % | Y; N; N/EL (b) (c) | Y; N; N/EL (b) (c) | Y; N; N/EL (b) (c) | Y; N; N/EL (b) (c) | Y; N; N/EL (b) (c) | Y; N; N/EL (b) (c) | Y/N | Y/N | Y/N | Y/N | Y/N | Y/N | Y/N | % | E | T | ||
| A. TAXONOMY-ELIGIBLE ACTIVITIES | |||||||||||||||||||
| A.1. Environmentally sustainable activities (Taxonomy-aligned) | |||||||||||||||||||
| OpEx of environmentally sustainable activities (Taxonomy-aligned) (A.1) | 0 | 0% | 0% | ||||||||||||||||
| Of which Enabling | 0 | 0% | 0% | E | |||||||||||||||
| Of which Transitional | 0 | 0% | 0% | T | |||||||||||||||
| A.2 Taxonomy-Eligible but not environmentally sustainable activities (not Taxonomy-aligned activities) (g) | |||||||||||||||||||
| EL; N/EL (f) | EL; N/EL (f) | EL; N/EL (f) | EL; N/EL (f) | EL; N/EL (f) | EL; N/EL (f) | ||||||||||||||
| Manufacture of electrical and electronic equipment | CE1.2 | 1,606.98 | 67.9% | N/EL | N/EL | N/EL | N/EL | EL | N/EL | N/A | |||||||||
| Provision of IT/OT data-driven solutions | CE4.1 | 295.89 | 12.5% | N/EL | N/EL | N/EL | N/EL | EL | N/EL | N/A | |||||||||
| Repair, refurbishment and remanufacturing | CE5.1 | 0.34 | 0% | N/EL | N/EL | N/EL | N/EL | EL | N/EL | N/A | |||||||||
| Sale of spare parts | CE5.2 | 1.50 | 0% | N/EL | N/EL | N/EL | N/EL | EL | N/EL | N/A | |||||||||
| Product-as-a-service and other circular use- and result-oriented service models | CE5.5 | 102.97 | 4.4% | N/EL | N/EL | N/EL | N/EL | EL | N/EL | N/A | |||||||||
| OpEx of Taxonomy-eligible but not environmentally sustainable activities (not Taxonomy-aligned activities) (A.2) | 2,007.68 | 84.8% | |||||||||||||||||
| A. OpEx of Taxonomy eligible activities (A.1+A.2) | 2,007.68 | 84.8% | |||||||||||||||||
| B. TAXONOMY-NON-ELIGIBLE ACTIVITIES | |||||||||||||||||||
| OpEx of Taxonomy-non-eligible activities | 358.98 | 15.2% | |||||||||||||||||
| TOTAL | 2,366.66 | 100% | |||||||||||||||||
In 2020, Philips further reinforced its commitments as a purpose-driven company with the announcement of an enhanced and fully integrated approach to doing business responsibly and sustainably. This section provides additional information on (some of) the Social performance parameters reported in Social performance
In 2023, we continued the research to measure our social impact to assess the positive contributions to health effects offered by publicly traded companies related to medical devices. We further piloted the methodology and evaluated another use case of the potential measurable impact of IGT devices.
This study estimated the potential benefits of using IGT medical devices to detect and support treating health problems for patients in several countries and regions of the world. This study is expected to help us assess the broader use of the methodology to diverse devices with an aim to support and illustrate how to guide investments toward publicly traded companies that bring products and services into the market with quantifiable impacts linked to a common framework that fulfils the UN Sustainable Development Goals.
An analysis of 204 countries estimated the impact of IGT medical devices on reducing cancer (tracheal, bronchus, lung, and kidney) and cardiovascular mortality in different world areas, aligning with UN SDG targets 3.2 and 3.4:
At Philips, we welcome thousands of new employees every year. We understand the significance of ensuring that our colleagues feel a profound sense of belonging and clarity about their roles right from the start. To achieve this, we have crafted a digitally enhanced onboarding approach, tailored for both new hires and internal movers.
Our people leaders and their teams play an invaluable role in the onboarding experience. Our new employees consistently highlight this as the most valuable aspect of their onboarding journey. To bolster this approach, we offer support to our people leaders through comprehensive capability-building programs and toolkits. We firmly believe that onboarding is not just a process, but a key leadership accountability.
In 2023, we reinforced the mandatory quality and clinical education that every new hire receives, underscoring our unwavering commitment to patient safety and quality. Of those who joined Philips in 2023, 91% reported a positive onboarding experience, and 95% felt genuinely welcomed here.
Our onboarding practices reflect our dedication to nurturing a dynamic and inclusive workplace, ensuring that our new team members hit the ground running and can thrive in their roles.
We see our talent as our most differentiating enterprise asset. Our goal is to enable everyone to thrive at Philips, and we recognize that it is important to invest in strategic capabilities, and for both leaders and employees to share accountability for career development. We expect our leaders to scout for talent, develop people and upgrade capabilities, so that we can continue to build a diverse, future-oriented workforce where inclusion is key, and transparent, ongoing feedback enables all our people to grow.
We support our people in navigating their own career and stimulate our managers to have meaningful career dialogues with their people. To this end, we continued our Continuous Feedback and Continuous Talent Dialog approach in 2023. We also implemented a digital talent marketplace within Philips, giving employees the opportunity to build their skills in new areas outside of their core jobs.
Enablers such as Mentoring, Development Centers and Onboarding have also been leveraged by the organization based on the needs of particular talent segments. We recently launched LinkedIn Learning to provide access to technology-enabled self-paced learning and best-in-class learning content.
We invested in development of our leaders, especially to lead during the current changes. We launched development offerings in areas of leading with care, engagement & motivation, and managing change.
Our People Performance Management focuses on both ‘what’ we achieve (goals and key areas of responsibilities) and ‘how’ we achieve these goals. This more balanced view of performance drives holistic conversations between employee and manager throughout the year, with regular check-ins for feedback and development built in along the way. In 2023, 89% of our employees were involved in regular performance and career development reviews.
We continue to stimulate cross-moves (across Businesses, between Zones or Functions) to promote collaboration and give people challenging learning experiences. During the recent reorganization, we largely staffed senior leadership positions with internal talent, with a specific focus on cross-functional talent pipelining.
Philips also gave meaningful work experience to 1,802 interns, offering 321 of them permanent employment after their internship.
To continuously improve our leadership capability, we provide company-wide development solutions such as Leadership Programs, Coaching & Mentoring, Development Centers and Assessments. Senior Leadership Programs (Corporate Grade 90 and above) are facilitated multi-day immersive experiences, in which a selected senior management group focuses on core business challenges as well as the behavioral shifts needed to accelerate results.
In 2023, all leadership interventions continued to focus on accelerating patient safety and quality, and also supported the development of capabilities to deliver on our strategy to create value with sustainable impact.
In 2023, we launched a change leadership capability program for senior leaders (Corporate Grade 90 and above), and for people leaders we developed and launched short modules to build deeper capability in change, care, and engagement.
Philips advocates experience-based career development, providing our people with the opportunity to identify and gain the experiences necessary to help deliver our strategy and strengthen their employability. In 2023, we continued to innovate the way learning and development experiences are created and offered, embarking on a program to transform Philips University into a Capability Development Platform. Continuing our strategy to provide a ‘digital first’ employee experience, we expanded our investments in digital solutions that support personal, team and organizational growth.
Through improved data analytics and simplified ways of working, we continuously align our learning product portfolio to support organizational capability development. Philips University is committed to deliver learning and development experiences that impact our people and Philips as a whole.
By the end of 2023, 670,712 courses had been taken through Philips University, with 631,364 training completions (internal platform only) and a total of 660,145 training hours. Courses completed by the largest number of employees include Living integrity/General Business Principles and Legal Compliance 2023, and Security Fundamentals 2023.
By the end of 2023, 3,000,251 courses had been taken through Quality Management Learning (internal platform only), with 2,946,835 training completions and a total 2,327,115 training hours. These training completions relate to our emphasis, via training deployments, on Patient Safety and Quality-related topics, and represent training for all our employees who work on our Philips products or related services. Courses completed by the largest number of employees in the Quality Management Learning domain include Customer Feedback Awareness, Quality Policy Awareness, Management system and Quality Management system portal navigation and Manage Customer Feedback.
For Philips in total, therefore, 3,670,963 courses have been taken, with 3,578,199 training completions and 2,987,260 training hours, resulting in an average number of training hours of 43 per employee.
Through 2023, we filled over 11,000 positions across the organization, of which 43% were internal appointments, up from 33% in 2022. Our two strategic external hiring channels are Direct-Sourcing and Referrals, which together delivered 42% of our external hires in 2023.
Through collaboration with the Tent Partnership for Refugees, we continue to offer opportunities to refugees across our operations. In 2023, we hired 51 refugees across the globe, and we kicked off this refugee program roll-out in the US. In May we joined Tent’s Mentorship Program for Refugee Women in the US and announced a new commitment to mentor 50 refugee women over the course of the next three years. In August, we also committed to mentor 50 Hispanic refugees over the next three years.
In 2023, we strengthened our focus on strategic Employer Branding and Recruitment Marketing initiatives. We optimized our approach to media activity with targeted attraction campaigns focused on the most critical talent segments and strategic capabilities. This led to a 55% increase in leads in our talent pool, a 57% increase in unique visitors to our Careers website per job posted, and a 9% increase in applications per job requisition compared to 2022.
We continued our always-on employer branding content program across a variety of channels, strengthening our positioning as a people-centric, purpose-driven health technology company focused on patient safety, quality and sustainability, and as an employer of choice for inclusion, diversity and well-being. Our marketing metrics indicating interest and favorability to our employer brand increased double-digit compared to 2022.
New reporting requirements require listed European companies like Philips to disclose more details on their workforce, if 'Own workers' are considered 'material' as per the Double Materiality Assessment, which is the case at Philips. In preparation for these reporting requirements in 2024, we decided to already publish a number of these in the Annual Report 2023.
Philips Group
Key data
on number of employees (including contingent workers) per country
| Country | Total | EEA Country? | Have Collective Bargaining Agreement? | % Employees covered under Collective Labor Agreements |
|---|---|---|---|---|
| United States | 17,598 | No | Yes | 0.3% |
| Netherlands | 9,242 | Yes | Yes | 89% |
| India | 8,667 | No | Yes | 0.6% |
| China | 7,151 | No | No | |
| Germany | 3,632 | Yes | Yes | 46% |
| Indonesia | 3,573 | No | No | |
| Costa Rica | 2,901 | No | No | |
| Poland | 2,094 | Yes | No | |
| Japan | 2,013 | No | No | |
| Brazil | 1,841 | No | Yes | 100% |
| Israel | 1,189 | No | No | |
| United Kingdom | 969 | No | Yes | 8% |
| France | 916 | Yes | Yes | 100% |
| Panama | 771 | No | No | |
| Italy | 679 | Yes | Yes | 100% |
| Canada | 553 | No | No | |
| Australia | 543 | No | No | |
| Spain | 516 | Yes | Yes | 94% |
| Singapore | 406 | No | Yes | 12% |
| Russian Federation | 363 | No | No | |
| Korea, Republic of | 336 | No | Yes | 80% |
| Austria | 328 | Yes | Yes | 100% |
| Mexico | 316 | No | No | |
| Belgium | 287 | Yes | Yes | 50% |
| Sweden | 241 | Yes | Yes | 100% |
| Turkey | 229 | No | No | |
| Hong Kong | 214 | No | No | |
| Switzerland | 189 | No | No | |
| Saudi Arabia | 167 | No | No | |
| Taiwan | 163 | No | No | |
| United Arab Emirates | 156 | No | No | |
| Denmark | 144 | Yes | Yes | 31% |
| South Africa | 144 | No | No | |
| Thailand | 137 | No | No | |
| Argentina | 133 | No | No | |
| Egypt | 113 | No | No | |
| Romania | 107 | Yes | No | |
| Colombia | 107 | No | No | |
| Czechia | 105 | Yes | No | |
| Chile | 101 | No | Yes | 100% |
| Malaysia | 97 | No | No | |
| Philippines | 87 | No | No | |
| Portugal | 81 | Yes | Yes | 100% |
| Finland | 79 | Yes | Yes | 97% |
| Vietnam | 70 | No | No | |
| Hungary | 61 | Yes | No | |
| Other countries (with less than 50 employees) | 436 | |||
| Total | 70,245 | |||
| Employees covered under Collective Labor Agreements | 22% |
The table above displays all countries where Philips has more than 50 employees. As shown above, the percentage of total employees covered by collective bargaining agreements is 22%. The number of employees in the European Economic Area (EEA) at year-end 2023 was 18,512, and the percentage of employees in the EEA covered by Collective Labor Agreements is 70%.
Philips Group
Employees (excluding contingent workers) by working type
in head count at year -end
| Female | I choose not to self-identify | Male | Total | |
|---|---|---|---|---|
| Permanent employees | 23,905 | 47 | 40,196 | 64,148 |
| Temporary employees | 2,903 | 1 | 969 | 3,873 |
| Other employees | 7 | 0 | 11 | 18 |
| Philips Group | 26,815 | 48 | 41,176 | 68,039 |
Philips is committed to broadening our outreach of talent and leveraging the diversity of our employees and is dedicated to fostering an environment that encourages self-identification in order to:
US federal regulations under Section 503 of the Rehabilitation Act require covered federal contractors with 50 or more employees (US companies that conduct business with the federal government, such as Philips) to obtain voluntary self-identification information through an agency-prescribed Voluntary Self-Identification of Disability Form (Form CC-305) which is embedded within Philips' system of record, at three stages: pre-offer (application process), post-offer (after job offer, but before the new hire or rehire starts job duties), and during employment (invite employees to voluntarily inform Philips whether the employee is an individual with a disability) by way of a resurvey that must occur at five-year intervals. US employees can update their disability status within the disability self-ID module within Philips' system of record at any time during their employment with Philips. These regulations came into effect in 2014, making 2024 the second five-year window since rule inception for federal contractors to conduct a resurvey.
Choosing to identify a disability status is strictly voluntary. The records would remain confidential, i.e. will not be shared with supervisors/managers or included in employee personnel files (information is stored in a separate file within Philips' system of record) or have any effect on their employment (which is emphasized in all Philips communications).
At year-end 2023, 4% of our US employees have voluntarily disclosed that they have, or have had, a disability. Philips did not deploy a disability self-identification in other parts of the world.
Employees at Philips are entitled to 8 hours or one full day of paid time off to volunteer, once a year. This can be with a local community project or an established non-governmental organization whose work can impact access to healthcare. Some Regions also encourage employees to support corporate social responsibility projects which are typically outlined in local volunteering policies. Examples in 2023 include:
At Philips, our goal to offer the best place to work for people who share our passion is not limited to employees on our payroll. In the Netherlands, for example, we run a special employment program, WGP (Werkgelegenheidsplan, or Philips Employment Scheme), to offer vulnerable groups of external jobseekers a work experience placement, usually combined with training. Since the scheme’s launch in 1983, 13,415 people have participated, and around 80% found a regular job after taking part. In 2023, we had an inflow of 50 candidates, bringing the total number of participants in 2023 to 114. The WGP program is also accessible to refugees, and in 2023 we had 11 refugees participating.
Policy, Procedures and Management Systems: Philips continued to build a comprehensive global Health & Safety Management System with the deployment of 12 updated Philips Corporate Safety Standards (PCSS) in 2023. A simplification exercise on the Health & Safety (H&S) framework took place, leading to a new total of 66 PCSS deployed by the end of 2023. The PCSSs are supported with training materials in Philips University and Guidance Notes. An updated Occupational Health & Safety Policy was published in March 2023. Management System Certifications ISO 45001 are in place for 24 manufacturing locations. A total of 16 ISO 45001 certificates for non-manufacturing organizations have been obtained, with further certifications planned for 2024. 51% of the total Philips workforce, including 3rd party workers, is covered by ISO 45001 certification.
Compliance and audit: In 2023, Philips continued the deployment of the ENHESA Compliance tracking tool at all locations where Philips has a significant presence. A review of applicable regulations and compliance status was in scope. 13 H&S audits were performed in manufacturing and research & development, office and field service organizations.
Risk assessments: The high-level risk assessment process continued to be developed for all entities of health & safety scope, to provide a strategic overview of the risk profile, using the Philips Corporate Risk Assessment protocol. This approach has identified exceptional risks at specific locations as well as systemic risks across Philips. Systemic risks were addressed through company-wide H&S campaigns to drive performance improvements. Risk assessments were also reviewed during the Assurance letter process, and Philips entities have a clearer understanding of the risks they face, and the controls needed to address them.
Management reviews: The Philips Health and Safety Assurance letter was completed. This process requires a full Health and Safety review at every level of the organization that verifies that the Philips H&S policy is understood, a verified H&S Management System is in place, compliance requirements are met, risk assessments have been completed with plans in place to control/reduce significant risks, and sufficient resources (including adequate staff) are in place. The process is initiated at the lowest organizational level and raised progressively to more senior leadership and finally to Executive level, with review and sign-off at each stage.
Training and Communication: A library of Underwriters Ltd. (UL) safety e-learning courses (517 H&S courses in 11 languages) was made available in Philips University. Four new H&S campaigns were launched – Health (Awareness) Fair, Chemical Safety, Working at Heights, Warehouse Safety – and six health awareness topics were circulated throughout our community (physical activity, safe and healthy travel, skin health, heart health, respiratory virus, lung health (smoking/vaping).
Occupational Health: Focus on COVID-19 management continued to reduce. During Q2 2022, it was communicated that outbreak management would shift from the central crisis management organization to local Market/Country management teams. Health and Safety remained primarily responsible for maintaining all infection prevention guidance, periodic reporting, and organizational support. Periodic reporting to the Executive Committee was discontinued in June 2023, due to the reduced risk. This decision was based on the conclusion of the World Health Organization that COVID-19 is an established and ongoing health issue which no longer constitutes a public health emergency of international concern (PHEIC). The global intranet page provides information about COVID-19 to all employees, and it was fully reviewed and updated in 2023.
Continued focus was placed on two critical programs: Ergonomics and Mental Health & Well-being. Due to socio-economic and political issues and the personnel reductions announced in 2022, Mental Health & Well-being remained a topic of high attention. Mental Health Champions were trained across the globe, and the program was further matured with structural support and training (close to 250 Champions by the end of 2023). Within the Ergonomics program there were some 171 trained Champions by the end of 2023. These Champions can support job analysis and incident investigations and help drive ergonomic improvements.
The Occupational Health team also collaborated with Personnel Security to enhance communications around safe and healthy travel and support for employees requiring medical support during travel.
Together with Group Sustainability and the HazCom team at Philips Engineering Solutions (part of Health and Safety as of September 1, 2023), considerable effort was put into improving cross-functional alignment and management of chemicals. This resulted in a significantly improved Philips Excellence Process Framework process towards Q4 of 2023.
Proactive metrics: Increased emphasis was placed on proactive metrics while retaining the existing reportable accident rate. The metrics are aggregated into a scorecard, to provide one consolidated proactive performance metric, which is presented at business level. Specific proactive safety metrics include:
Reactive metrics
This data includes 165 of work-related accidents, 1.14 cases per one million hours worked in our own workforce (155 cases with 1.11 accident rate for employees; 10 cases with 1.57 accident rate for non-employees). A rate based on 1 000 000 hours worked, indicates the number of work-related injuries per 500 full time people in the workforce over a 1-year timeframe. We recorded 7 recordable work-related ill health in our own workforce, (6 for employees, 1 for non-employees). The TRC rate increased from 0.23 per hundred FTEs in 2022 to 0.24 in 2023, (0.23 for employees, 0.35 for non-employees).
No fatalities occurred with our own workforce or other workers, working on our sites in 2023.Philips Group
Total recordable cases
per 100 FTE
| 2019 | 2020 | 2021 | 2022 | 2023 | |
|---|---|---|---|---|---|
| Diagnosis & Treatment | 0.61 | 0.45 | 0.53 | 0.41 | 0.43 |
| Connected Care | 0.34 | 0.31 | 0.31 | 0.19 | 0.27 |
| Personal Health | 0.18 | 0.3 | 0.24 | 0.27 | 0.21 |
| Other | 0.24 | 0.16 | 0.21 | 0.17 | 0.18 |
| Philips Group | 0.32 | 0.24 | 0.29 | 0.23 | 0.24 |
Philips Group
Lost workday injuries per 100 FTEs
| 2019 | 2020 | 2021 | 2022 | 2023 | |
|---|---|---|---|---|---|
| Diagnosis & Treatment | 0.33 | 0.27 | 0.28 | 0.21 | 0.28 |
| Connected Care | 0.09 | 0.11 | 0.09 | 0.09 | 0.13 |
| Personal Health | 0.14 | 0.22 | 0.16 | 0.09 | 0.09 |
| Other | 0.09 | 0.06 | 0.12 | 0.08 | 0.09 |
| Philips Group | 0.14 | 0.12 | 0.16 | 0.11 | 0.12 |
In the Diagnosis & Treatment segment, the number of Health and Safety incidents increased in 2023 to 36 LWICs compared to 31 in 2022. The LWIC rate increased to 0.28 compared to 0.21 in 2022. The total number of recordable cases for the Diagnosis & Treatment segment decreased to 56 (59 in 2022), mainly due to less recorded incidents in our factory in Costa Rica.
In the Connected Care segment, the number of Health and Safety incidents increased in 2023 to 8 LWICs (6 in 2022). Correspondingly, the LWIC rate increased to 0.13 compared to 0.09 in 2022. The total number of recordable cases for the Connected Care segment increased to 16 in 2023 (13 in 2022), mainly driven by our factories in North America and Germany.
In the Personal Health segment, the number of Health and Safety incidents comparable to 2022, with 7 registered LWICs. The LWIC rate remained at the same level as 0.09 in 2022. There were 17 recordable cases in the Personal Health segment in 2023 (21 in 2022). This decrease was mainly driven by less recorded incidents in North America.
Philips Foundation is a registered non-profit organization established in 2014 – then founded to be the centralized corporate social responsibility platform of Philips. Meanwhile, its mission and focus are to provide access to quality healthcare for underserved communities worldwide, reducing healthcare inequality. In 2023, Royal Philips supported Philips Foundation with a contribution of EUR 6.7 million and provided the Foundation’s operational staff. Expert volunteers from Royal Philips assisted in the execution of Philips Foundation’s programs. In addition, Royal Philips matched funds raised by employees for victims supported by Philips Foundation during the crises in Ukraine, the Middle East and Northern Africa.
Philips Foundation fulfills its mission by deploying Philips’ expertise in innovative healthcare technology and solutions, exploring viable and sustainable healthcare delivery models to serve the people who lack access to affordable healthcare, and collaborating with key societal organizations and partners worldwide. Philips Foundation, through its Impact Investments entity, is also investing in enterprises with innovations in the healthcare space, enabling underserved communities to get medical examinations for early detection of conditions and timely referral to the right medical services. Philips Foundation fosters innovations that are fit for purpose, address local needs, are accessible and affordable, are set up for scaling, and are financially sustainable to help ensure lasting healthcare provision.
Since the launch of Philips Foundation, hundreds of grant-based initiatives have been completed or are in progress throughout the world – engaging employees, providing healthcare technologies and solutions, and overcoming healthcare challenges in close connection with organizations operating locally. Philips Foundation Impact Investments B.V., a subsidiary set up in 2021, expanded its portfolio to 10 ventures in 2023. Philips Foundation aims to accelerate the development of potentially high-impact opportunities to enhance access to care and reduce healthcare inequality by nurturing early-stage social enterprises through investments and non-financial support. In 2023, Philips Foundation’s initiatives improved the lives of almost 1.4 million people and provided access to healthcare to well over 28 million people in some of the most underserved regions across the globe. Philips Foundation retains the ambition to provide access to quality healthcare for around 100 million underserved people annually by 2030.
In 2023, Philips Foundation continued its program of new and ongoing projects, mainly oriented towards the deployment of technology-based solutions, exploring and supporting scalable ways to strengthen community and primary care. With projects covering many phases of people’s health journeys, Philips Foundation focused on early detection of cardiovascular and respiratory diseases and cancers, improving maternal and child health, and strengthening acute and emergency care. Philips Foundation aims to relieve healthcare facilities and local health workers in underserved areas by leveraging Philips’ expertise in telehealth technologies for qualitative and informed triage, timely treatment or rapid (virtual) referral to the right doctor or specialist.
In 2023, Philips Foundation further built upon the expertise of Philips employees, social entrepreneurs, academics, medical experts, and others to explore innovative paths to strengthen healthcare access. With Rology providing radiology services at distance, over 250,000 patients analyses were made, based on images taken in hospitals without a radiologist, for proper reporting on the patients’ condition. The multi-year partnership with RAD-AID began to take effect in 2023, to ultimately promote access to diagnostic ultrasound services in 10 countries across continents, that support remote healthcare delivery for communities thousands of kilometers away.
For more information about Philips Foundation, its purpose and scope, as well as its latest annual report, visit the website.
Philips’ purpose to improve people’s health and well-being extends throughout our value chain. At Philips, we have a direct business relationship with approximately 4,900 product and component suppliers and 16,100 service providers. Our supply chain sustainability strategy is evaluated annually through a structured process, combined with multi-stakeholder dialogues. From this, we have developed multiple ESG programs aimed at driving sustainable improvement. These programs cover compliance with our policies, improvement of our suppliers’ sustainability performance, our approach towards responsible sourcing of minerals, and reducing the environmental impact of our supply base. Supplier engagement in these programs is driven by screening ESG opportunities and risks, evaluating materiality and impact along the lines of material, industry, and geographical characteristics.
Procurement and supplier information sessions are scheduled on an ongoing basis. During these sessions, our supplier ESG expectations are shared and clarified. Training courses are organized to support suppliers in meeting those expectations. In addition, suppliers are supported in improving their ESG performance via individual training. Where data is available, suppliers are informed on their performance compared to industry peers, and best practices are shared, and their adoption encouraged. During the sourcing process, supplier ESG indicators are evaluated. In addition to minimum requirements set out in our Code of Conduct, suppliers with a better ESG performance are considered favorably.
Two core policy documents form the basis of our supplier sustainability compliance approach: the Supplier Sustainability Declaration and the Regulated Substances List.
The SSD sets out the standards and behaviors Philips requires from its suppliers. The SSD is based on the Responsible Business Alliance (RBA) Code of Conduct, in combination with several additional Philips-specific expected behaviors. The Code is in alignment with the UN Guiding Principles on Business and Human Rights and key international human rights standards, including the ILO Declaration on Fundamental Principles and Rights at Work and the UN Universal Declaration of Human Rights. It covers topics such as Labor, Health & Safety, Environment, Ethics, and Management Systems. The RBA is the world’s largest industry coalition dedicated to responsible business conduct in global supply chains. As a Regular member of the RBA, Philips is required to commit publicly to the RBA Code of Conduct and actively pursue conformance to the Code and its standards, which must be regarded as a total supply chain initiative.
The RSL specifies the chemical substances regulated by legislation. Suppliers are required to follow all the requirements stated in the RSL. Substances are marked as restricted or declarable.
All suppliers are required to commit to the SSD and RSL. Through integration of a Sustainability Agreement in our purchasing agreements, suppliers declare compliance to both the SSD and RSL. Upon request, they provide additional information and evidence.
In 2016, Philips first piloted its 'Beyond Auditing' approach to engage suppliers on ESG matters, with a focus on:
This systematic approach is shown in the figure below and is a high-level representation of the SSP program.
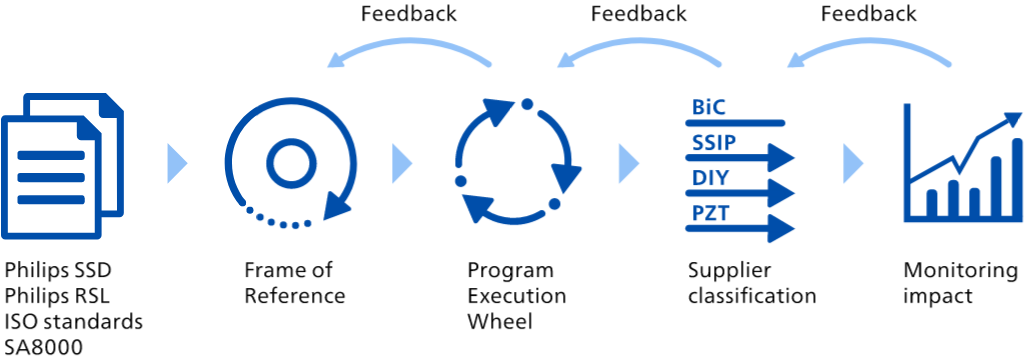
First, a set of references, international standards, and Philips requirements are used to develop the Frame of Reference, which covers management systems, environment, health & safety, business ethics, and human rights. For each, the maturity level of suppliers is identified in the Program Execution Wheel, which assesses suppliers against the Plan–Do–Check–Act (PDCA) cycle. Suppliers are then categorized through the Supplier Classification model, which differentiates on the basis of supplier maturity, resulting in supplier-specific proposals for improvement. The SSP process is monitored and adjusted through continuous feedback loops. The outcome of the SSP assessment is a supplier sustainability score ranging from 0 to 100. This score is based on supplier performance in environmental management, health & safety, business ethics, and human rights.
Supplier selection for the program is based on significance. Significance of suppliers is determined through an assessment of the supplier’s associated ESG risks and opportunities, including material, industry, and geographical characteristics, as well as annual spend. In 2023, 152 of our suppliers were considered significant. After this initial assessment, the engagement strategy is tailored based on the suppliers’ current performance in terms of sustainability.
Philips Group
Significant suppliers - tier 1
| 2023 | |
|---|---|
| Number of suppliers | 152 |
| Spend as percentage of total | 20% |
There are four different engagement approaches: BiC (Best in Class), SSIP (Supplier Sustainability Improvement Plan), DIY (Do It Yourself) and PZT (Potential Zero Tolerance). The PZT status is a temporary status and requires immediate attention and action. Depending on the categorization, suppliers are engaged in different ways to improve their sustainability performance through agreed improvement plans.
If a (Potential) Zero Tolerance is identified, immediate action is taken. If the requested additional information and evidence lead to the conclusion that there is no structural Zero Tolerance, the supplier’s status will be changed and the supplier will go back to the original track in the program. If the conclusion gives rise to a structural Zero Tolerance, the supplier is required to:
Philips defines six Zero Tolerances:
For more details on the SSP process, refer to the SSP brochure.
In 2023, five zero tolerances were found across the following categories: health and safety, labor, and environmental impact. All five cases were successfully closed in 2023 after confirmation of completion of the corrective action plan. One zero tolerance, found in the last quarter of 2022, has also been closed during 2023.
Philips measures the impact of SSP engagements through the number of lives improved in the supply chain. This is derived from the improvements that suppliers make in their performance. To determine improvements, we calculate the pro rata change in performance from one year to the next.
Philips Group
Lives improved in the supply chain
in thousands of Lives
| 2021 | 2022 | 2023 | |
|---|---|---|---|
| Lives improved in the supply chain | 430 | 459 | 723 |
In 2023, the overall year-on-year improvement in performance was 37% for suppliers that received their first re-assessment in 2023. The number of employees impacted (first and second tier) suppliers participating in the SSP program was approximately 723,000. This figure includes suppliers assessed in the last three years, for which the supplier has communicated their number of employees via the self-assessment questionnaire, which was validated during the on-site assessment. For those workers, labor conditions improved, the risk of serious injury reduced, and the negative environmental impact of suppliers was brought down. This includes the workers at suppliers of the Domestic Appliances business, for which Philips continued the sustainability engagement. For a detailed break-down of percentage improvements realized by active suppliers in the past year, by comparing the assessment in 2023 to their previous assessment, refer to the following table.
Philips Group
SSP 2023 performance: pro-rata improvements
in %
| Topics | Policy | Procedures | Implementation | Management responsibility | Communication | Risk control | Target-setting & tracking | Corrective action approach | Supplier management |
|---|---|---|---|---|---|---|---|---|---|
| Environment | 2% | 7% | -2% | 10% | 2% | 23% | 15% | 10% | -8% |
| Health and Safety | 11% | 11% | 16% | 0% | 6% | 10% | 11% | 21% | 4% |
| Business Ethics | 11% | 20% | 9% | -4% | 26% | 21% | 33% | 26% | 1% |
| Human Capital | 13% | 13% | 19% | 11% | 7% | 4% | 10% | 12% | -2% |
Categories which showed the biggest improvement are:
In 2023, 158 suppliers were added to the SSP program (compared to 47 added in 2022). Of the population of suppliers that entered the program in the years before 2023 and have been assessed at least once in the past three years, 392 suppliers were still active in 2023 (compared to 249 in 2022). The combined group represents 77% of our significant suppliers who are in the program.
As part of our commitment to improve the lives of 1 million workers in the supply chain by 2025, we increased our engagement with second-tier suppliers. By teaming up with Tier 1 suppliers in conducting the assessment, Philips has supported in building ESG supplier management skills. In 2023, 110 second-tier suppliers entered the program, resulting in a total number of 138 second-tier suppliers engaged with in the last three years.
Philips is actively applying the latest insights in data science and machine learning methods to make the SSP program more efficient. Through the use of reference data collected over 1,600 assessments in the past years, Philips is working towards integrating maturity and improvement predictions in the program. This is expected to support us in determining the sustainability maturity of suppliers, while also increasing the effectiveness of our supplier improvement approach.
On an annual basis, Philips experts organize quality trainings in the sustainability area for suppliers in the scope of the SSP program.
The supply chains for minerals are long and complex. Philips does not source minerals directly from mines as there are typically 7+ tiers between end-user companies like Philips and the mines where the minerals are extracted. The extraction of minerals can take place in conflict-affected and high-risk regions, where mining is often informal and unregulated, and carried out at artisanal small-scale mines (ASM). These ASMs are vulnerable to exploitation by armed groups and local traders. Within this context, there is an increased risk of severe human rights violations (forced labor, child labor or widespread sexual violence), unsafe working conditions or environmental concerns.
Philips addresses the complexities of minerals supply chains through a continuous due diligence process, combined with active participation in multi-stakeholder initiatives to promote the responsible sourcing of minerals.
Each year, Philips investigates its supply chain to identify smelters of tin, tantalum, tungsten and gold in its supply chain and we have committed to not purchasing raw materials, sub-assemblies, or supplies found to contain conflict minerals.
Philips applies collective cross-industry leverage through active engagement via the Responsible Minerals Initiative (RMI). RMI identifies smelters that can demonstrate, through an independent third-party audit, that the minerals they procure are conflict-free. In 2023, Philips continued to actively direct its supply chain towards these smelters.
The Philips Conflict Minerals Due Diligence framework, measures and outcomes are described in the Conflict Minerals Report that we file annually to the US Securities and Exchange Commission (SEC). The conflict minerals report is also publicly available on Philips’ website. Philips fully supports and complies with the OECD Due Diligence Guidance for Responsible Supply Chains of Minerals from Conflict-Affected and High-Risk Areas (OECD Guidance).
Each year, we work with our suppliers on the quality of their due diligence reporting by setting minimum criteria for the Conflict Minerals Reporting Templates (CMRT). For the 2023 Conflict Minerals Report, Philips significantly strengthened the acceptance criteria for CMRTs as it intensified the required due diligence performed by suppliers towards the use of smelters of high concern. In addition, we strive to reduce the number of non-identified smelters. As a result, the percentage of CMRTs that satisfied minimum acceptance criteria has decreased by 13 percentage points.
Philips Group
Conflict Minerals Due Diligence results
| Key performance indicator | 2021 | 2022 | 2023 |
|---|---|---|---|
| Response rate of suppliers (%) | 99% | 95% | 95% |
| CMRTs that reached minimum acceptance criteria (%) | 84% | 78% | 65% |
| Non-listed smelters in our supply chain (#) | 0 | 0 | 0 |
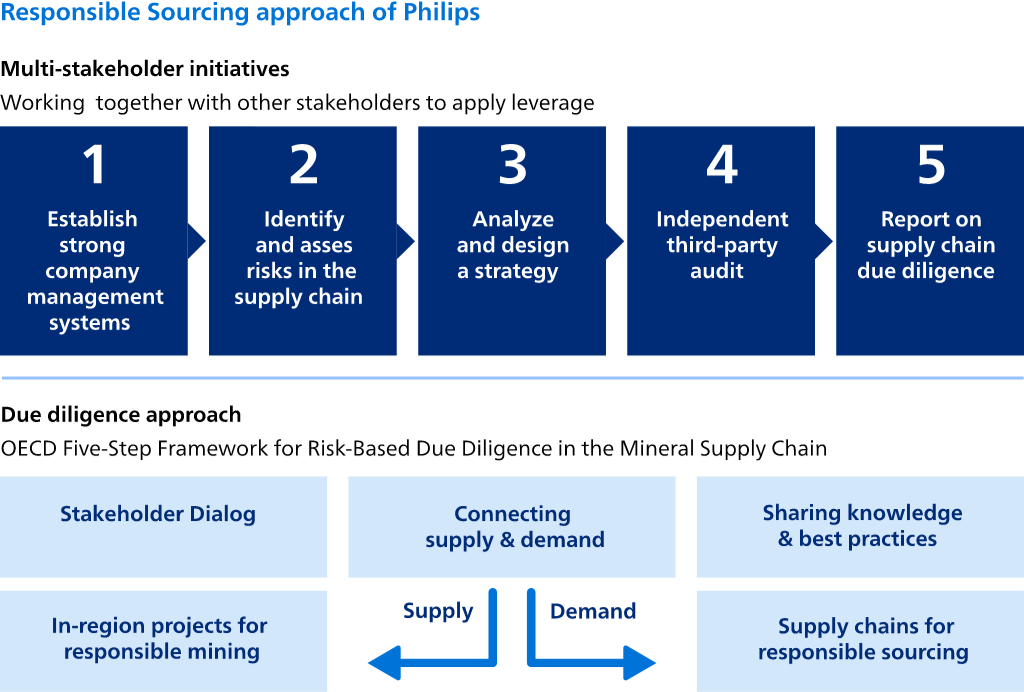
Philips has performed due diligence on cobalt since 2019. We use cobalt predominantly in lithium-ion batteries. As part of this initiative, we engaged suppliers that provide materials containing cobalt. In 2023, we again reached a 100% response rate (2022: 100%).
We believe that multi-stakeholder collaboration in the responsible sourcing of minerals is the most viable approach for addressing the complexities of minerals value chains.
Philips is a founding partner of EPRM and has been a strategic member since its inception in May 2016. EPRM is a multi-stakeholder partnership between governments, companies, and civil society actors working toward more sustainable minerals supply chains. The goal of EPRM is to create better social and economic conditions for mine workers and local mining communities by increasing the number of mines that adopt responsible mining practices in Conflict-Affected and High-Risk Areas (CAHRAs).
EPRM is an accompanying measure to the EU Conflict Minerals Regulation dedicated to making real change ‘on the ground’. Through EPRM, Philips supports activities to improve responsible mining practices in mining areas in CAHRAs and shares our knowledge and practice in conducting due diligence. Since 2018, Philips has actively participated in several working groups focused on strengthening the responsible production of minerals, as well as improving responsible sourcing practices.
Since 2003, Philips has looked at ways to improve the environmental performance of its suppliers. When it comes to climate change, we have adopted a multi-pronged approach: reducing the environmental impact of our products, committing to carbon neutrality in our own operations, and engaging with our supply chain to reduce their carbon footprint. Through initiatives such as the CDP supply chain program, Philips motivates its suppliers to disclose emissions, embed board responsibility on climate change, and actively work on reduction activities.
In October 2021, during COP26, Philips announced its target to have at least 50% of its suppliers (based on spend) committed to science-based targets for carbon reduction by 2025.
Philips Group
% of suppliers committed to science-based targets
| 2021 | 2022 | 2023 | |
|---|---|---|---|
| % of suppliers committed to Science Based Targets | 28% | 41% | 46% |
We consider suppliers to have committed to science-based targets when this is communicated via the Science Based Targets initiative (SBTi), the suppliers' CDP disclosures, or public websites and announcements (on a 'Science Based Target', 'Net Zero Target', or equivalent). Multiple activities have been deployed to help us achieve this climate target. We consider spend to be relevant if it relates to product and component suppliers and relevant service providers, like logistics and information technology suppliers.
CDP engagement: Since 2011 we have been partnering with CDP Supply Chain, through which we invite suppliers to disclose their environmental performance and carbon intensity. In 2023, there was a response rate of 93% (2022: 85%). With 500 of our biggest suppliers included in the CDP engagement program in 2023, CDP confirmed Philips is in the top tier in terms of its supplier engagement coverage.
Of the group that responded, 60% engaged in emission-reduction initiatives (2022: 59%). In addition, 48% committed to carbon emission targets (2022: 47%). In the 2023 survey, our suppliers reported 14 million metric tonnes CO2 savings from improvement projects undertaken in 2023.
Philips Group
Supplier response rate to CDP questionnaire
| 2021 | 2022 | 2023 | |
|---|---|---|---|
| Supplier response rate to CDP questionnaire | 87% | 85% | 93% |
Data-driven insights: Through accurate data insights, Philips’ buyers are enabled to consider climate action in their supplier selection. In 2023, 46% of our purchases (in spend) were made at suppliers that have committed to science-based CO2 reduction targets.
Capability building: We support suppliers in advancing their company approach to climate action, offering guidance that is tailored to their climate action maturity. In 2023, we further grew the offering of tailored feedback and guidance for 80% of our suppliers to support their growth in capabilities and help improve their approach.
Opportunities for decarbonization: Through on-site assessments we identify energy efficiency opportunities that enable our suppliers to make cost-effective carbon reductions. Our team calculates for the supplier what the cost impact would be, and also the return. In 2023, 19 on-site assessments took place, which resulted in tailored plans for improvement.
In 2020, Philips further reinforced its commitments as a purpose-driven company with the announcement of an enhanced and fully integrated approach to doing business responsibly and sustainably. This section provides additional information on (some of) the Governance parameters reported in Governance
In line with Philips SpeakUp Policy, potential violations of our General Business Principles or any other concern that may constitute a direct threat to Philips’ corporate integrity, are reported through the Philips SpeakUp program. The Philips SpeakUp Policy sets out safeguards for reporters and participants in an investigation, which includes the prohibition of (attempted) retaliation.
In 2023, a total of 764 concerns were reported via Philips SpeakUp (Ethics Line) and through our network of GBP Compliance Officers, an increase of 8% year-on-year (2022: 706 concerns). This is a continuation of the year-on-year upward trend. We believe the upward trend in reporting remains in line with our multi-year efforts to encourage our employees to express their concerns, whilst realizing that the extraordinary business conditions of the past few years make it imprudent to draw any specific conclusions from these numbers.
In percentage terms, North America remains the region with the highest case inflow (2023: 47%; 2022: 49%). The percentage increase in reports is visible in Latin America, which is now responsible for 15% of all reported concerns (2022: 9%). The APAC region showed a small decline (2023: 20%; 2022: 21%). EMEA, responsible for 18% of reported concerns in 2023 showed a decline (2022: 21%).
Philips Group
Breakdown of reported GBP concerns
in number of reports
| 2019 | 2020 | 2021 | 2022 | 2023 | |
|---|---|---|---|---|---|
| Health & Safety | 9 | 26 | 19 | 19 | 13 |
| Treatment of employees | 320 | 342 | 365 | 430 | 459 |
| - Equal and fair treatment | 55 | 52 | 31 | 53 | 53 |
| - Employee development | 9 | 5 | 20 | 29 | 41 |
| - Employee privacy | 10 | 8 | 11 | 6 | 6 |
| - Employee relations | 18 | 13 | 6 | 11 | 2 |
| - Respectful treatment | 163 | 160 | 226 | 255 | 240 |
| - Remuneration | 9 | 28 | 7 | 17 | 12 |
| - Forced labor | 1 | ||||
| - Conflict of interest | 1 | 6 | 7 | 9 | 3 |
| - Working hours | 14 | 27 | 10 | 15 | 14 |
| - HR other | 41 | 42 | 47 | 35 | 88 |
| Legal | 33 | 28 | 30 | 48 | 61 |
| Quality | 11 | 11 | 18 | 30 | 30 |
| Business Integrity | 138 | 127 | 112 | 114 | 137 |
| Procurement | 7 | 12 | 4 | 3 | |
| IT | 3 | 5 | 8 | 9 | 10 |
| Other | 24 | 20 | 54 | 53 | 54 |
| Total | 545 | 571 | 610 | 706 | 764 |
As in previous years, the type of concern most commonly reported related to the category ‘Treatment of employees’. In 2023, there were 459 reports in this category, compared to 430 in 2022. This represents 60% of the total number of concerns, slightly lower than in 2022 (61%).
The majority of the concerns reported in the ‘Treatment of employees’ category relate to ‘Respectful treatment’. The ‘Respectful treatment’ sub-category generally relates to concerns about verbal abuse, (sexual) harassment, and hostile work environments. In the ‘Treatment of employees’ category, 51% of cases originated from North America, a decrease compared to 2022 (54%). In 2023, no material fines, penalties or damages were paid for incidents of discrimination, harassment and severe human rights incidents (e.g., forced labor, human trafficking or child labor).
The second most-reported type of concern relates to ‘Business Integrity’, which accounted for 18% of total cases reported in 2023, up from 16% in 2022. These concerns originated primarily from the APAC region (33%), followed by North America (31%), Latin America (20%) and EMEA (16%).
The majority of concerns reported in the category ‘Business Integrity’ relate to potential fraudulent behavior. The category ‘Business Integrity’ also includes concerns related to alleged violations of anti-corruption and anti-bribery laws. In 2023, Philips was not convicted or fined for any violation of such laws but has entered into a number of settlement agreements to resolve matters relating to compliance with the internal controls and recordkeeping provisions of the U.S. Foreign Corrupt Practices Act (FCPA), the U.S. Anti-kickback statute and Federal False Claims Act.
Philips Group
Classification of concerns investigated
in numbers of reports
| 2021 | 2022 | 2023 | ||||
|---|---|---|---|---|---|---|
| Category | substantiated | unsubstantiated | substantiated | unsubstantiated | substantiated | unsubstantiated |
| Health & Safety | 3 | 18 | 6 | 16 | 2 | 14 |
| Treatment of employees | 87 | 271 | 121 | 312 | 89 | 370 |
| Legal | 8 | 17 | 11 | 24 | 9 | 40 |
| Quality | 4 | 14 | 6 | 14 | 7 | 29 |
| Business Integrity | 60 | 90 | 52 | 54 | 71 | 77 |
| Procurement | 1 | 6 | 1 | 2 | ||
| IT | 5 | 4 | 2 | 4 | 4 | 5 |
| Other | 8 | 41 | 14 | 33 | 14 | 43 |
| Total | 176 | 461 | 213 | 459 | 196 | 578 |
In 2023, a total of 774 reports were closed. Of these 774 reports, 196 were substantiated (i.e. were found to constitute a breach of our General Business Principles), which represents 25% of the cases closed in 2023 (32% in 2022). 19% of ‘Treatment of employees’ cases were substantiated, compared to 28% in 2022 (2021: 24%). In addition, 48% of the ‘Business integrity’ reports were closed as substantiated, compared to 49% in 2022 (2021: 40%).
Depending on the outcome of the investigation, appropriate follow-up action is taken. Follow-up action can be remedial and/or disciplinary in nature. Remedial action can vary from strengthening the business processes and procedures, enhanced monitoring, training and coaching, and increasing awareness of the expected standard of business conduct. Disciplinary measures may include written warnings and termination of employment. In 2023, disciplinary action was taken in 126 cases, and remedial action in 193.
Philips prioritizes its advocacy in three key regions where building strong relationships and collaborations is instrumental for us: the European Union, the United States and China:
For more information on Philips’ guiding principles regarding stakeholder advocacy & engagement, please refer to Philips’ Stakeholder Advocacy & Engagement Policy.
In the social dimension, Philips collaborates with numerous international partners to deliver sustainable value and drive global change. These efforts align with the UN’s Sustainable Development Goal 3 (Ensure healthy lives and promote well-being for all at all ages) and Goal 17 (Strengthen the means of implementation and revitalize the global partnership for sustainable development). Our aim is to reduce our shared environmental footprint and increase our social impact as part of the commitment to improve 2 billion lives by 2025.
Philips collaborates closely with a diverse international network of stakeholders to establish strategic partnerships and conduct industry research. In 2020, Philips joined forces with esteemed organizations including the World Economic Forum, AstraZeneca, KPMG, the London School of Economics, the WHO Foundation, and the Center for Asia Pacific Resilience and Innovation (CAPRI) to form the Partnership for Health System Sustainability and Resilience (PHSSR). This non-profit, multi-sector, global collaboration is united in its goal to build more sustainable and resilient health systems.
To support this goal, the PHSSR is active in over 30 countries, and has published 24 reports to date on its commissioned independent research, providing evidence-based recommendations on health system strengthening. This work, which includes country-specific findings as well as combined overarching global insights, is conducted by national experts with first-hand knowledge and experience of the domestic health systems studied. Post-pandemic, many health systems remain in a perilous state as accumulating pressures and increasing demands have reached crisis point. The PHSSR seeks to facilitate cross-border and cross-sectoral collaboration to accelerate the strengthening of health systems by enabling international knowledge exchange and collaboration with health system stakeholders.
The Future Health Index is a research-based platform designed to help determine the readiness of countries to address global health challenges and build sustainable, fit-for-purpose national health systems. By examining the role of technology in the health system, the aim of the Future Health Index is to provide actionable insights to healthcare professionals, governments and patients that will also improve their experience with healthcare.
The Future Health Index 2023 report analyzes the priorities and perspectives of healthcare leaders and younger healthcare professionals in 14 countries. Now in its eighth year, this year’s report focuses on their perception of new care delivery models, which integrate physical and virtual care within and beyond hospital walls. The report reveals that healthcare leaders and younger healthcare professionals share the same vision for the future of care delivery: one in which healthcare, enabled by digital technology, is delivered in more connected, convenient, and sustainable ways across care settings.
We can only achieve health for all, the commitment made by United Nations member states, if the public, private and non-profit sectors work together. Universal Health Coverage (UHC) means that all people have access to the full range of quality health services they need, when and where they need them, without financial hardship. The UHC2030 agenda is about ensuring that by 2030 all people can obtain the health services they need without suffering financial hardship. This will not only improve health and health equity but also help reduce poverty, create jobs, drive inclusive economic growth, promote gender equality, and protect populations from epidemics. As member of the UHC2030 Private-Sector Constituency, Philips actively supports this mission. We joined the advocacy work of the UHC2030 partnership in the run up and during the UN High Level Meeting on UHC in September 2023.
Over the past year, Philips has continued its journey to improve access to care in underserved communities. Through shared-value partnerships and dedicated teams across the company’s businesses and markets, Philips is developing innovative digital solutions and deploying new business and financing models that are both sustainable and scalable, to strengthen health systems while lowering costs and bringing care closer to those most in need.
Ultrasound, for example, is still not sufficiently available in many rural and remote areas. So, by leveraging its expertise in mobile ultrasound services, and in close collaboration with the Bill & Melinda Gates Foundation, Philips is researching and developing AI-based applications that can assist frontline health workers to effectively capture and interpret ultrasound images.
Philips is a Commissioner at the High-Level Commission (HLC) on the Nairobi Summit on ICPD25 Follow-up. The mission of the HLC is, among other things, to support acceleration of the implementation of the ICPD Program of Action by providing global guidance and advocacy to advance the 12 global Nairobi commitments, which highlight the ‘three zeros’ (zero unmet need for family planning, zero preventable maternal mortality, and zero sexual and gender-based violence including harmful practices). Philips is a member of the Coalition for Reproductive Justice in Business, which is established by UNFPA and its partners to advance and mainstream the women and girls’ reproductive health agenda within the private sector to provide adequate maternal health support, access to family planning information and response to gender-based violence in the workplace.
The Partnership for Maternal and Newborn Child Health (PMNCH) continues to be an important platform for Philips in advocating for health and well-being. As the world’s largest alliance for women’s, children’s and adolescents’ health and well-being, the Partnership works across 10 constituency groups and is hosted by the World Health Organization.
In 2023, Philips continued to be a Steering Committee member of the Health Finance Coalition. This coalition consists of leading health donors, investors and technical partners seeking to scale blended finance solutions to achieve SDG3 and Universal Health Coverage in Africa. As part of this coalition, Philips invested USD 10 million in the Transform Health Fund, that will invest in supply chain transformation and innovative care delivery models serving low-income patients. Thanks to the catalytic role Philips played, the Fund was able to achieve its first close at USD 50 million in June 2023.
Philips also partners with Philips Foundation to improve access to care in some of the most underserved communities globally. Refer to Philips Foundation to learn more about the Philips Foundation.
Regarding its environmental responsibility, Philips focuses on making a material impact, which means prioritizing initiatives that deliver tangible value. Our strategy is in line with the UN’s Sustainable Development Goals 12 (Ensure sustainable consumption and production patterns) and 13 (Take urgent action to combat climate change and its impacts).
COP28 marked a historic milestone by hosting its first-ever dedicated Health Day, addressing the pressing global concern about the impact of climate change on people’s health. In collaboration with members of the Alliance for Transformative Action on Climate Change and Health (ATACH), the World Health Organization (WHO) led efforts to promote commitments in building climate-resilient and sustainable low-carbon health systems.
Philips played an active role in advocating for transformative changes within the healthcare sector, as exemplified during our participation in COP28. Our key requests underscored the urgency for the healthcare industry to achieve net-zero emissions within health systems by 2050. Additionally, we called for the establishment of national targets aligned with the Paris Agreement to reduce carbon emissions across the entire healthcare value chain (scope 1, 2, 3) by 2030. Recognizing the importance of climate resilience, we urged the development and release of comprehensive climate resilience plans for continuous operations by 2027.
We are pleased to report a significant outcome from COP28—the adoption of the Dubai Declaration on Climate and Health by 143 countries. This landmark agreement paves the way for a consequential World Health Assembly (WHA) resolution on the intersection of climate and health, scheduled for May 2024. Philips remains steadfast in our commitment to driving positive global change, and the outcomes of COP28 underscore our shared dedication to building a more sustainable and resilient future for the healthcare sector and beyond.
Philips and Vanderbilt University Medical Center (VUMC), home to the top-ranked adult and pediatric hospitals in the Southeastern U.S., announced a collaboration that aims to reduce the health system’s carbon footprint while determining a blueprint to guide industry efforts. Philips and VUMC share a common vision – that systemically addressing climate change is going to take commitment and collaboration across the industry. The project is with the radiology department, where efforts will focus on measuring and addressing energy consumption of VUMC’s diagnostic imaging devices including MR, CT, Ultrasound and X-ray. The two organizations plan to publish their findings with the aim of promoting knowledge exchange and enabling others in the industry to enhance their environmental strategies.
In 2023, to further advance on our journey towards a circular company, Philips and Champalimaud Foundation signed a strategic partnership aimed at halving the carbon footprint resulting from Champalimaud’s use of diagnostic and interventional imaging equipment by 2028. After conducting a baseline assessment of Champalimaud Foundation’s current CO₂ emissions, Philips will work with the organization to update and renew its diagnostic imaging technology capabilities, keeping it up-to-date with Philips’ latest innovations in diagnostic imaging such as CT and MR systems, while also reducing resource demand, increasing the use of recycled materials, and extending equipment lifespans. As a result, Champalimaud Foundation’s patients and staff will be able to enjoy the outcome benefits of advanced diagnostic imaging coupled with improved patient and staff experiences and more sustainable healthcare delivery. Philips will also take back the currently installed Philips equipment and ensure responsible end-of-use management, to avoid waste going to landfill.
As a member of the WEF Alliance of CEO Climate Leaders, Philips has continued to promote supply chain decarbonization in 2023 by helping co-develop a framework for tackling upstream Scope 3 emissions by engaging suppliers and supporting them to decarbonize. By signing up to this framework, Alliance members will use the plan as guidance to scale their action on Scope 3 upstream emissions.
We already source 100% of our electricity from renewable sources, and finance projects in developing regions to compensate unavoidable emissions. Thanks to our focused approach to drive down emissions, we have been carbon-neutral in our operations since 2020. We have been developing more and more products that are EcoDesigned, which includes optimizing the design of our products to make them more energy efficient and circular. To really mitigate climate change we need to speed up our efforts and drive scale beyond our own operations. For the 11th year in a row, Philips received the prestigious ‘A List’ award from global environmental impact non-profit CDP, for our efforts to cut emissions, mitigate climate risks and develop the low-carbon economy.
In 2023, Philips, HEINEKEN, Nobian, and Signify celebrated the opening of Finland’s largest active wind farm that will provide a renewable electricity guarantee for the consortium of companies. The 10-year agreement with Neoen will deliver 330 GWh per year to the consortium – the equivalent electricity needed to power 40,000 households. This renewable electricity will help to avoid over 230,000 tons of CO2 emissions per year. In the first pan-European agreement of its kind, the consortium committed to contracting renewable electricity from the wind farm for the first 10 years through the Virtual Power Purchase Agreement signed in 2020. The electricity is physically delivered to the Finnish grid while the four consortium partners benefit from the Guarantees of Origin. This provides income stability for the renewable project, while guaranteeing clean energy for the consortium members.
Philips promotes the green and sustainable development in the healthcare sector and supports the efforts from the Dutch government to address the link between climate change and health, via participation in the Dutch Global Health Hub. Furthermore, Philips supports the exchange and cooperation between China and the Netherlands in the field of green hospital development.
At Philips, we engage with multiple stakeholders to drive circular practices worldwide. In 2023, Philips continued its strategic partnership with the Ellen MacArthur Foundation (EMF). Together with a group of engaged design leaders in EMF’s ‘Circular Design Leaders’ group, we helped shape a framework – Adaptive Strategy for Circular Design – identifying 6 focus areas to create an organization environment for circular transformation. We have been a partner with PACE (Platform for Accelerating the Circular Economy) since its creation by the World Economic Forum in 2018. PACE is a public-private collaboration platform with the mission to catalyze global leadership from businesses, government and civil society to accelerate the transition to a circular economy Focus is among others on strengthening the connection between climate and circularity and scaling mineral circularity for global resilience. Together with PACE, Circle Economy in the Circular Economy Indicators Coalition (CEIC) and Accenture, we jointly published ‘Corporate circular target-setting guidance’, building on the earlier publication in 2022 on ‘Corporate target-setting for the circular economy’. The guidance seeks to provide businesses with an actionable blueprint for selecting and reporting against impactful circular targets.
Together with other parties, Philips contributed to the Circularity Gap report issued by Circularity Gap Reporting Initiative, providing clarity on the gaps to close on a global scale, and on the necessary contribution and scaling of circularity to systematically address climate change.
Philips participates in the World Business Council for Sustainable Development (WBCSD), actively contributing to the development of the Circular Transition Indicators (CTI). On a national level, Philips is an active leader in the Dutch National Circular Economy Program, supporting with policy advice, execution of the national roadmaps, and measuring progress towards goals.
Philips is proud of its continued engagement as a Strategic Partner of the WEF, the international organization for public-private cooperation committed to improving the state of the world. The Forum engages political, business and other leaders to help shape global, regional and industry agendas.
The year kicked off with the WEF Annual Meeting in Davos, Switzerland, attended by over 2,000 global leaders. Philips joined a number of high-level panels and held bilateral meetings with key business leaders, civil society representatives and public figures. In particular, Philips led discussions around building resilience in health systems, the digital transformation of healthcare, and supply chain decarbonization.
Throughout 2023, Philips continued to work closely with the WEF International Business Council (IBC) to integrate the Stakeholder Capitalism Metrics framework published in 2020 into ESG and sustainability reporting. This framework is a set of common metrics for companies to align their mainstream reporting on performance against ESG indicators and track their contributions towards sustainable value creation and the SDGs on a consistent basis. Philips has advocated for adoption across various platforms like the WEF ESG practitioners’ group and the European Round Table for Industry (ERT) Sustainable Finance group and has included the framework for the third time in this 2023 Annual Report.
In July 2023, WEF published an insight report on the transformative potential of artificial intelligence (AI) in healthcare and the importance of public-private collaboration in driving its global adoption. Philips was featured in the report alongside Apollo Hospitals, Johnson & Johnson, and AstraZeneca, which highlighted high-priority use cases where AI can make a difference, including disease detection, outbreak management and medical breakthroughs.
Furthermore, this year Philips’ CEO Roy Jakobs was appointed co-chair of the US National Academy of Medicine’s Steering Committee to develop an AI Code of Conduct (AICC). To ensure equitable, ethical, safe and responsible use of AI in healthcare. In 2023, the National Academy of Medicine invited a group of leading individuals from healthcare, technology, research and bioethics to launch a three-year project to develop a framework to advance governance in support of the responsible advancement of AI.
The expenses included in this section are classified into four categories based on contribution level and reported for global partnerships, annual events and general contributions, trade associations, and political contributions. We are reporting only on expenses equal to or greater than EUR 40,000 and have grouped these, based on contribution level, into three bandwidths: EUR 250,000 - EUR 750,000, EUR 100,000 - EUR 250,000, EUR 40,000 - EUR 100,000.
Our global partnerships represent long-term collaborations with organizations that share our values and vision. These engagements involve substantial contributions to support initiatives, research, and programs aimed at addressing healthcare challenges and fostering innovation. Please note that many of the earlier-mentioned partnerships do not require expenses; hence, they have not been included in the listing.
Philips Group
Global Partnerships
| EUR 250,000 - EUR 750,000 |
| International Consortium for Health Outcomes Measurement (ICHOM) |
| Ellen MacArthur Foundation (EMF) |
| EUR 100,000 - EUR 250,000 |
| Platform for Accelerating the Circular Economy (PACE) |
| Partnership for Health System Sustainability and Resilience (PHSSR) |
| EUR 40,000 - EUR 100,000 |
| Gaia-X |
| World Stroke Organization (WSO) |
Philips actively engages with annual events and makes general contributions to knowledge exchange, networking, and industry growth. These events provide us with opportunities to engage with key stakeholders, showcase our expertise, contribute to the transformation of healthcare, and advance the decarbonization process in the healthcare industry.
Philips Group
Annual Events and General Contributions
| EUR 250,000 - EUR 750,000 |
| World Economic Forum (WEF) |
| EUR 100,000 - EUR 250,000 |
| World Business Council for Sustainable Development (WBCSD) |
| EUR 40,000 - EUR 100,000 |
| Center for Asia-Pacific Research and Innovation (CAPRI) |
Our memberships in trade associations are essential for staying informed about industry developments and standards. We contribute significantly to these associations to support advocacy efforts, research, and collective industry initiatives that benefit Philips and the healthcare sector.
Philips Group
Trade Associations
| EUR 250,000 - EUR 750,000 |
| Advanced Medical Technology Association (AdvaMed) |
| Medical Imaging & Technology Alliance (MITA) |
| EUR 100,000 - EUR 250,000 |
| Electrical and Electronic Manufacturers' Association (ZVEI) |
| Council for Quality Respiratory Care (CQRC) |
| Consumer Technology Association (CTA) |
| Dutch Employers' Federation (VNO-NCW) |
| European Coordination Committee of the Radiological, Electromedical and Healthcare IT Industry (COCIR) |
| European trade association representing the medical technology industries (MedTech Europe) |
| EUR 40,000 - EUR 100,000 |
| APACMed |
| Japan Electronics and Information Technology Industries Association (Jeita) |
| European Round Table for Industry (ERT) |
| Appliance Industry in Europe (APPLiA) |
The Philips General Business Principles set the standard for acting with integrity at Philips. They govern all our decisions and actions throughout the world and apply equally to our group actions and to our conduct as individuals. Article 2.5 of the General Business Principles states: “We comply with public procurement rules that apply to government projects or contracts. We do not make any contribution, in money or in kind, to political parties or organizations, or to individuals engaged in politics.”
In the United States, in compliance with U.S. federal law, Philips does not make corporate contributions to federal candidates and federal political committees. Additionally, Philips does not make corporate political contributions to any U.S. state and local campaign committees, state and local political committees, state and local political parties, and other state and local 527 political organizations. The company supports the Philips North America LLC Employee Political Action Committee (Philips PAC) that makes contributions to federal, state and local candidates, political committees, political parties, and other 527 political organizations. Philips PAC is funded exclusively by voluntary contributions from U.S. employees who are eligible, in accordance with federal law, to contribute to the Philips PAC. U.S. federal law prohibits reimbursing employees, directly or indirectly, for contributions to Philips PAC.
Please refer to the U.S. Federal Election Commission website for more information pertaining to Philips PAC financial activity.
Chapter 10 ‘Group financial statements’ and Chapter 11 ’Company financial statements’ together contain the statutory financial statements of Koninklijke Philips N.V., the parent company of the Philips group. These statements are subject to adoption by the company’s shareholders at the 2024 Annual General Meeting of Shareholders.
The following sections and chapters form the management report within the meaning of article 2:391 of the Dutch Civil Code:
The sections Strategy and Businesses, Financial performance and Environment, Social and Governance provide an extensive analysis of the developments during the financial year 2023 and the results. These sections also provide information on the business outlook, investments, financing, personnel and research and development.
For ‘Additional information’ within the meaning of article 2:392 of the Dutch Civil Code, please refer to Independent auditor's report on financial statements and the Appropriation of profits.
Please refer to Forward-looking statements and other information for more information about forward-looking statements, third-party market share data, fair value information, and revisions and reclassifications.
The information included in this Annual Report extends beyond our financial results and statements as it also includes information on our Environmental and Social performance, integrating our various resources to create value with sustainable impact for our stakeholders. Please refer specifically to How we create value with sustainable impact, Double Materiality Assessment, Environmental, Social and Governance and ESG statements.
The statements and report below are provided by Roy Jakobs, Abhijit Bhattacharya and Marnix van Ginneken, together constituting the entire Board of Management of Koninklijke Philips N.V., on the date of this Annual Report.
The Board of Management of Koninklijke Philips N.V. hereby declares that, to the best of its knowledge, the Group financial statements and Company financial statements give a true and fair view of the assets, liabilities, financial position and profit or loss of the company and the undertakings included in the consolidation taken as a whole and that the management report referred to in Introduction gives a true and fair view concerning the position as per the balance sheet date, the development and performance of the business during the financial year of the company and the undertakings included in the consolidation taken as a whole, together with a description of the principal risks that they face.
The Board of Management of Koninklijke Philips N.V. (Royal Philips) is responsible for establishing and maintaining an adequate system of internal control over financial reporting (as such term is defined in Rule 13a-15 (f) under the US Securities Exchange Act). Internal control over financial reporting is a process to provide reasonable assurance regarding the reliability of our financial reporting for external purposes in accordance with IFRS as issued by the IASB.
Internal control over financial reporting includes maintaining records that, in reasonable detail, accurately and fairly reflect our transactions; providing reasonable assurance that transactions are recorded as necessary for preparation of our financial statements; providing reasonable assurance that receipts and expenditures of company assets are made in accordance with management authorization; and providing reasonable assurance that unauthorized acquisition, use or disposition of company assets that could have a material effect on our financial statements would be prevented or detected on a timely basis. Because of its inherent limitations, internal control over financial reporting is not intended to provide absolute assurance that a misstatement of our financial statements would be prevented or detected. Also, projections of any evaluation of the effectiveness of internal control over financial reporting to future periods are subject to the risk that the controls may become inadequate because of changes in conditions, or that the degree of compliance with the policies or procedures may deteriorate.
The Board of Management conducted an assessment of Royal Philips' internal control over financial reporting based on the “Internal Control Integrated Framework (2013)” established by the Committee of Sponsoring Organizations of the Treadway Commission (COSO).
Based on the Board of Management’s assessment of the effectiveness of Royal Philips' internal control over financial reporting as of December 31, 2023, it has concluded that, as of December 31, 2023, Royal Philips' internal control over Group financial reporting is considered effective.
The effectiveness of the Royal Philips' internal control over financial reporting as of December 31, 2023, as included in the section Group financial statements, has been audited by Ernst & Young Accountants LLP, an independent registered public accounting firm, as stated in their report which follows hereafter.
There were no changes in our internal control over financial reporting during 2023 that have materially affected, or are reasonably likely to materially affect, our internal control over financial reporting.
Our independent auditor, Ernst & Young Accountants LLP, has issued several reports which have been included in this section Independent auditor's reports.
First, the report set out in section Independent auditor’s report on internal control over financial reporting, is provided in compliance with standards of the Public Company Accounting Oversight Board in the US and includes an opinion on the effectiveness of internal control over financial reporting as of December 31, 2023, based on COSO criteria. Management’s report on internal control over financial reporting is set out in Management’s statements and report.
Second, our independent auditor has issued a report on the 2023 consolidated financial statements and the company financial statements, in accordance with Dutch law, including the Dutch standards on Auditing, of Koninklijke Philips N.V., which is set out in Independent auditor's report on financial statements.
Our independent auditor has also issued a report on the consolidated financial statements 2023 and 2022 in accordance with the standards of the Public Company Accounting Oversight Board in the US, which will be included in the Annual Report on Form 20-F expected to be filed with the US Securities and Exchange Commission on February 20, 2024.
Third, our independent auditor has issued an assurance report following its audit of certain selected ESG related information in this Annual Report, which is set out in Independent auditor's assurance report on the ESG information and the EU Taxonomy information.
To: The Supervisory Board and Shareholders of Koninklijke Philips N.V.
We have audited Koninklijke Philips N.V.’s internal control over financial reporting as of December 31, 2023, based on criteria established in Internal Control — Integrated Framework issued by the Committee of Sponsoring Organizations of the Treadway Commission (2013 framework) (the COSO criteria). In our opinion, Koninklijke Philips N.V. (the Company) maintained, in all material respects, effective internal control over financial reporting as of December 31, 2023, based on the COSO criteria.
We also have audited, in accordance with the standards of the Public Company Accounting Oversight Board (United States) (PCAOB), the consolidated balance sheets of the Company as of December 31, 2023 and 2022, the related consolidated statements of income, comprehensive income, cash flows and changes in equity for each of the three years in the period ended December 31, 2023, and the related notes and our report dated February 20, 2024 expressed an unqualified opinion thereon.
The Company’s management is responsible for maintaining effective internal control over financial reporting, and for its assessment of the effectiveness of internal control over financial reporting included in the accompanying section ‘Management’s report on internal control’, of this Annual Report. Our responsibility is to express an opinion on the Company’s internal control over financial reporting based on our audit. We are a public accounting firm registered with the PCAOB and are required to be independent with respect to the Company in accordance with the U.S. federal securities laws and the applicable rules and regulations of the Securities and Exchange Commission and the PCAOB.
We conducted our audit in accordance with the standards of the PCAOB. Those standards require that we plan and perform the audit to obtain reasonable assurance about whether effective internal control over financial reporting was maintained in all material respects.
Our audit included obtaining an understanding of internal control over financial reporting, assessing the risk that a material weakness exists, testing and evaluating the design and operating effectiveness of internal control based on the assessed risk, and performing such other procedures as we considered necessary in the circumstances. We believe that our audit provides a reasonable basis for our opinion.
A company’s internal control over financial reporting is a process designed to provide reasonable assurance regarding the reliability of financial reporting and the preparation of financial statements for external purposes in accordance with generally accepted accounting principles. A company’s internal control over financial reporting includes those policies and procedures that (1) pertain to the maintenance of records that, in reasonable detail, accurately and fairly reflect the transactions and dispositions of the assets of the company; (2) provide reasonable assurance that transactions are recorded as necessary to permit preparation of financial statements in accordance with generally accepted accounting principles, and that receipts and expenditures of the company are being made only in accordance with authorizations of management and directors of the company; and (3) provide reasonable assurance regarding prevention or timely detection of unauthorized acquisition, use, or disposition of the company’s assets that could have a material effect on the financial statements.
Because of its inherent limitations, internal control over financial reporting may not prevent or detect misstatements. Also, projections of any evaluation of effectiveness to future periods are subject to the risk that controls may become inadequate because of changes in conditions, or that the degree of compliance with the policies or procedures may deteriorate.
Ernst & Young Accountants LLP
Amsterdam, the Netherlands
February 20, 2024
To: the Supervisory Board and Shareholders of Koninklijke Philips N.V.
We have audited the financial statements 2023 of Koninklijke Philips N.V. (Philips, or the Company), based in Eindhoven, the Netherlands. The financial statements comprise the group and company financial statements.
In our opinion:
The group financial statements comprise:
The company financial statements comprise:
We conducted our audit in accordance with Dutch law, including the Dutch Standards on Auditing. Our responsibilities under those standards are further described in the Our responsibilities for the audit of the financial statements section of our report.
We are independent of Koninklijke Philips N.V. in accordance with the EU Regulation on specific requirements regarding statutory audit of public-interest entities, the “Wet toezicht accountantsorganisaties” (Wta, Audit firms supervision act), the “Verordening inzake de onafhankelijkheid van accountants bij assurance-opdrachten” (ViO, Code of Ethics for Professional Accountants, a regulation with respect to independence) and other relevant independence regulations in the Netherlands. Furthermore we have complied with the “Verordening gedrags- en beroepsregels accountants” (VGBA, Dutch Code of Ethics).
We believe the audit evidence we have obtained is sufficient and appropriate to provide a basis for our opinion.
We designed our audit procedures in the context of our audit of the financial statements as a whole and in forming our opinion thereon. The following information in support of our opinion and any findings were addressed in this context, and we do not provide a separate opinion or conclusion on these matters.
Koninklijke Philips N.V. is a health technology company delivering personal health solutions and professional health solutions for healthcare providers and their patients. The group is structured in operating reporting units (hereinafter: components) and we tailored our group audit approach accordingly. We paid specific attention in our audit to a number of areas driven by the operations of the group, as set out in our Key Audit Matters, as well as in our risk assessment.
We determined materiality and identified and assessed the risks of material misstatement of the financial statements, whether due to fraud or error, in order to design audit procedures responsive to those risks and to obtain audit evidence that is sufficient and appropriate to provide a basis for our opinion.
| Materiality | EUR 75 million (2022: EUR 55 million) |
| Benchmark applied | 0.4% of sales (2022: 0.3% of sales). |
| Explanation | We determined materiality based on our understanding of the Company’s business and our perception of the financial information needs of users of the financial statements. We consider sales an important metric for the activities of the Company. The benchmark applied is in line with our 2022 audit. |
We have also taken into account misstatements and/or possible misstatements that in our opinion are material for the users of the financial statements for qualitative reasons.
We agreed with the Supervisory Board that misstatements in excess of EUR 3.75 million, which are identified during the audit, would be reported to them, as well as smaller misstatements that in our view must be reported on qualitative grounds.
Koninklijke Philips N.V. is at the head of a group of entities. The financial information of this group is included in the group financial statements.
Because we are ultimately responsible for the opinion, we are also responsible for directing, supervising and performing the group audit. In this respect we have determined the nature and extent of the audit procedures to be carried out for components. Decisive were the size and/or the risk profile of the components. On this basis, we selected components for which an audit had to be carried out on the complete set of financial information or specific items.
Our group audit primarily focused on significant group entities. Following our assessment of the risk of material misstatement to Koninklijke Philips N.V.’s group financial statements, we have selected 6 components which required an audit of the complete financial information. Furthermore, we selected 32 components requiring audit procedures on specific account balances or specified audit procedures on significant accounts that we considered had the potential for the greatest impact on the group financial statements. We selected 1 component requiring review procedures of the complete financial information. We performed certain audit procedures centrally, related to financial statement account balances such as capitalized development costs, restructuring costs, Health Systems sales and Personal Health sales running on the primary systems, Respironics field action provision and other product warranty provisions, payroll, acquisitions and goodwill. Furthermore, we were involved in certain component team audit procedures related to tax, legal claims, litigation and contingencies. For the remaining components, we performed selected other procedures, including analytical review and test of details to respond to potential risks of material misstatements to the financial statements that we identified.
As a result of our scoping of the complete financial information, specific account balances and the performance of audit procedures at different levels in the organization, our actual coverage varies per financial statement account balance and the depth of our audit procedures per account balance varies depending on our risk assessment.
We have full audit coverage for selected account balances included in the key audit matters stated below.
Component performance materiality was determined using judgment, based on the relative size of the component and our risk assessment.
We hosted audit meetings with component auditors to discuss the group audit, risks, audit approach and instructions. In addition, we sent instructions to component auditors, covering the significant areas to be audited and the information required to be reported to us. Based on our risk assessment, we attended in-person site visits at component locations in the U.S.A., China, and India. These site visits encompassed some, or all, of the following activities: co-developing the significant risk area audit approach, reviewing key local working papers and conclusions, meeting with local and regional management teams and obtaining an understanding of key processes including centralized entity level controls processes. In general, we interacted regularly with the component teams during various stages of the audit through the use of video or teleconferencing facilities. Where deemed appropriate, we attended certain component closing meetings with management, also using video or teleconferencing facilities. We reviewed key working papers of component auditors using the EY electronic audit file platform, screen sharing or by the provision of copies of work papers direct to the group audit team.
By performing the procedures mentioned above at components, together with additional procedures at the central level, we have been able to obtain sufficient and appropriate audit evidence about the group’s financial information to provide an opinion on the group financial statements.
We ensured that the audit teams both at group and at component levels included the appropriate skills and competencies which are needed for the audit of a listed client in the health technology industry. We included specialists in the areas of IT audit, forensics, treasury, and income tax and have made use of our own valuation, share based payments and actuarial experts.
We performed our audit in cooperation with internal audit of Koninklijke Philips N.V., leveraging their in-depth knowledge of Koninklijke Philips N.V. and work performed. We agreed on the joint coordination of the audit planning, the nature and scope of the work to be performed, reporting and documentation. We evaluated and tested the relevant work performed by Internal Audit to satisfy ourselves that the work was adequate for our purposes and established what work had to be performed by our own professionals.
Climate-related risks can impact financial reporting. The Board of Management has summarized Philips’ commitments and obligations in relation to climate, and reported in Chapter 5 Environmental, Social and Governance and Chapter 12 ESG statements on the Environmental, Social and Governance (ESG) how the Company is addressing climate-related and environmental risks.
As part of our audit of the financial statements, we evaluated the extent to which climate-related risks and the Company’s commitments and (constructive) obligations are taken into account in estimates and significant assumptions applied by Koninklijke Philips N.V. Furthermore, we read the management report and considered whether there is any material inconsistency between the non-financial information in Chapter 5 Environmental, Social and Governance and Chapter 12 ESG statements and the financial statements.
Based on the audit procedures performed, we do not deem climate-related risks to have a material impact on the financial reporting judgments, estimates or significant assumptions as of December 31, 2023 and as such we have not identified a key audit matter.
Although we are not responsible for preventing fraud or non-compliance and we cannot be expected to detect non-compliance with all laws and regulations, it is our responsibility to obtain reasonable assurance that the financial statements, taken as a whole, are free from material misstatement, whether caused by fraud or error. The risk of not detecting a material misstatement resulting from fraud is higher than for one resulting from error, as fraud may involve collusion, forgery, intentional omissions, misrepresentations, or the override of internal control.
We identified and assessed the risks of material misstatements of the financial statements due to fraud. During our audit we obtained an understanding of Philips and its environment and the components of the system of internal control, including the risk assessment process and the Board of Management’s process for responding to the risks of fraud and monitoring the system of internal control including how the Supervisory Board exercises oversight, as well as the outcomes.
We refer to Chapter 6 Risk management of the management report for the Board of Management’s fraud risk assessment and section 8.3 of the Supervisory Board report in which the Audit Committee reflects on this fraud risk assessment.
We evaluated the design and relevant aspects of the system of internal control and in particular the fraud risk assessment, as well as the code of conduct, whistle blower procedures and incident registration. We evaluated the design and the implementation and, where considered appropriate, tested the operating effectiveness of internal controls designed to mitigate fraud risks.
As part of our process of identifying fraud risks, we evaluated fraud risk factors with respect to financial reporting fraud, misappropriation of assets and bribery and corruption, in close co-operation with our forensic and legal specialists. We evaluated whether these factors indicate that a risk of material misstatement due to fraud is present.
We incorporated elements of unpredictability in our audit. We also considered the outcome of our other audit procedures and evaluated whether any findings were indicative of fraud or non-compliance.
We addressed the risks related to management override of controls, as this risk is present in all companies. For these risks, we have performed procedures, among others to, evaluate key accounting estimates for management bias that may represent a risk of material misstatement due to fraud, in particular relating to important judgment areas and significant accounting estimates as disclosed in Note 1 General information to the Consolidated financial statements to the group financial statements. We have also used data analysis to identify and address high-risk journal entries and evaluated the business rationale (or lack thereof) of significant extraordinary transactions, including those with related parties. When identifying and assessing fraud risks, we presumed that there are risks of fraud in sales recognition. We refer to our Key Audit Matter related to Revenue recognition – sales-related accruals and installable sales orders for further information.
We considered available information and made inquiries of relevant executives, directors, internal audit, legal, compliance, human resources, regional directors and the Supervisory Board.
The fraud risks we identified, inquiries and other available information did not lead to specific indications for fraud or suspected fraud potentially materially impacting the view of the financial statements.
We performed appropriate audit procedures regarding compliance with the provisions of those laws and regulations that have a direct effect on the determination of material amounts and disclosures in the financial statements. Furthermore, we assessed factors related to the risks of non-compliance with laws and regulations that could reasonably be expected to have a material effect on the financial statements from our general industry experience, through discussions with the Board of Management, reading minutes, inspection of internal audit and compliance reports and performing test of controls, substantive tests of details on classes of transactions, account balances or disclosures.
Given the Company is a global organization, operating in multiple jurisdictions, in our assessment of the risk of non-compliance with laws and regulations, we also considered the potential risk from Philips’ interactions with third-party distributors and governmental agencies. We refer to section 6.6 Compliance risks in the management report. Our audit approach included the following steps: 1) obtain an understanding of the environment and the Company to enable the detection of non-compliance with laws and regulations related to bribery and corruption, 2) obtain an understanding of the internal control environment and the measures for mitigating those risks (by the Company) in the light of applicable anti-corruption laws and regulations and 3) execute controls-based and substantive audit procedures in order to obtain sufficient evidence for the mitigation of the risk of non-compliance with laws and regulations related to bribery and corruption.
We also inspected lawyers’ letters and correspondence with regulatory authorities and remained alert to any indication of (suspected) non-compliance throughout the audit. Finally, we obtained written representations that all known or alleged instances of non-compliance with laws and regulations have been disclosed to us.
We refer to our Key Audit Matter related to the Measurement of provisions and disclosures for legal claims, litigations and contingent liabilities for further information as to our procedures in this regard.
As disclosed in section ‘Basis of preparation’ in Note 1 General information to the Consolidated financial statements to the group financial statements, the financial statements have been prepared on a going concern basis. When preparing the financial statements the Board of Management made a specific assessment of the Company’s ability to continue as a going concern and to continue its operations for the foreseeable future.
We discussed and evaluated the specific assessment with the Board of Management, exercising professional judgment and maintaining professional skepticism.
We considered whether the Board of Management’s going concern assessment, based on our knowledge and understanding obtained through our audit of the financial statements or otherwise, contains all events or conditions that may cast significant doubt on the Company’s ability to continue as a going concern. If we conclude that a material uncertainty exists, we are required to draw attention in our auditor’s report to the related disclosures in the financial statements or, if such disclosures are inadequate, to modify our opinion.
Based on our procedures performed, we did not identify material uncertainties about going concern. Our conclusions are based on the audit evidence obtained up to the date of our auditor’s report. However, future events or conditions may cause a company to cease to continue as a going concern.
Key audit matters are those matters that, in our professional judgment, were of most significance in our audit of the financial statements. We have communicated the key audit matters to the Supervisory Board. The key audit matters are not a comprehensive reflection of all matters discussed. In comparison with previous year, we defined one new key audit matter: Recognition of deferred tax assets in the United States.
| Revenue recognition – Sales-related accruals and installable sales orders | |
|---|---|
| Risk | In the Personal Health businesses, the Company has sales promotion-related agreements with distributors and retailers whereby discounts and rebates are provided based on the quantity of goods sold and promotional and marketing activities performed by distributors and retailers. Estimating these sales-related accruals involves management assumptions based on a combination of historical patterns and future expectations regarding which promotional targets are expected to be met by distributors and retailers. We identified a fraud risk related to the estimation of certain sales-related accruals, specifically rebates that are non-contractual in nature, through inappropriate estimations. Refer to Note 6, Income from operations, section Sales composition and disaggregation.
|
| Our audit approach | Our audit procedures included, amongst others, evaluating the appropriateness of the Company’s revenue recognition policies for sales promotion-related agreements in accordance with IFRS 15 ‘Revenue from Contracts with Customers’ and whether the policies have been applied consistently or whether changes, if any, are appropriate in the circumstances.
|
| Key observations | We consider management’s assumptions related to the sales-related accruals as well as installable sales orders to be reasonable.
|
| Valuation of Goodwill for Cash Generating Unit Sleep & Respiratory Care | |
|---|---|
| Risk | As more fully described in Note 11, Goodwill, goodwill is allocated to groups of cash-generating units (CGUs) and tested for impairment at the business level (one level below segment level), which represents the lowest level at which the goodwill is monitored internally for management purposes. Management applied certain considerations for the CGU Sleep & Respiratory Care (S&RC) during 2023. Specifically, in performing the impairment tests for the CGU S&RC, it was necessary for management to make assumptions regarding the estimated impact of the proposed Respironics consent decree. As of December 31, 2023, the total carrying value of goodwill allocated to CGU S&RC amounted to EUR 687 million.
|
| Our audit approach | Our audit procedures included, amongst others, evaluating the appropriateness of the impairment methodology applied by the Company related to the valuation of goodwill in accordance with IAS 36 ‘Impairment of Assets’ and whether the methodology has been applied consistently or whether changes, if any, are appropriate in the circumstances. We focused specifically on the CGU S&RC considering the potential impact of the proposed Respironics consent decree on S&RC operations.
|
| Key observations | We consider management’s assumptions and estimates made to calculate the recoverable amount to be reasonable.
|
| Measurement and disclosure of the Respironics field action provision related to Sleep & Respiratory Care products | |
|---|---|
| Risk | The Company recognized a provision based on management's best estimate of the costs to replace, repair or refund devices subject to the Respironics field action, initiated in 2021. As more fully described in Note 19, Provisions, the Respironics field action provision amounted to EUR 334 million as of December 31, 2023.
|
| Our audit approach | Our audit procedures included, amongst others, evaluating the appropriateness of the Company’s accounting policies related to the Respironics field action in accordance with IAS 37 ‘Provisions, contingent liabilities and contingent assets’, and whether the accounting policies have been applied consistently or whether changes, if any, are appropriate in the circumstances.
|
| Key observations | We consider the Respironics field action provision as of December 31, 2023 to be within a reasonable range.
|
| Measurement of provisions and disclosures for legal claims, litigations and contingent liabilities | |
|---|---|
| Risk | The Company and certain of its group companies and former group companies are involved as a party in legal proceedings, including regulatory and other governmental proceedings, as well as being investigated by governmental authorities for alleged non-compliance with laws and regulations. As more fully described in Note 19, Provisions and Note 24, Contingencies, this includes legal claims and litigation related to the Respironics field action, and discussions with and information provided to the Securities and Exchange Commission (SEC) and Department of Justice (DoJ) regarding ongoing investigations.
|
| Our audit approach | Our audit procedures included, amongst others, evaluating the appropriateness of the Company’s accounting policies related to provisions and disclosures for legal claims, litigations, and contingent liabilities in accordance with IAS 37 ‘Provisions, contingent liabilities, and contingent assets’, and whether the accounting policies have been applied consistently or whether changes, if any, are appropriate in the circumstances.
|
| Key observations | We consider the Board of Management’s assessment and conclusion on the expected outcome of the above matters reasonable, and the accounting of legal claims and litigation adequate.
|
| Recognition of deferred tax assets in the United States | |
|---|---|
| Risk | As more fully described in Note 8, Income taxes, at December 31, 2023, the Company had net deferred tax assets of EUR 1,676 million which were recognized in respect of entities in countries where there have been tax losses in the current or preceding period, primarily the United States (US).
|
| Our audit approach | Our audit procedures included, amongst others, evaluating the appropriateness of the tax accounting in accordance with IAS 12 ‘Income Taxes’ and whether the accounting policies have been applied consistently or whether changes, if any, are appropriate in the circumstances.
|
| Key observations | We consider management’s assumptions and estimates made in determining the recoverability of the deferred tax assets in the US to be reasonable.
|
The annual report contains other information in addition to the financial statements and our auditor’s report thereon.
Based on the following procedures performed, we conclude that the other information:
We have read the other information. Based on our knowledge and understanding obtained through our audit of the financial statements or otherwise, we have considered whether the other information contains material misstatements. By performing these procedures, we comply with the requirements of Part 9 of Book 2 and Section 2:135b sub-Section 7 of the Dutch Civil Code and the Dutch Standard 720. The scope of the procedures performed is substantially less than the scope of those performed in our audit of the financial statements.
The Board of Management is responsible for the preparation of the other information, including the management report in accordance with Part 9 of Book 2 of the Dutch Civil Code and other information required by Part 9 of Book 2 of the Dutch Civil Code. The Board of Management and the Supervisory Board are responsible for ensuring that the remuneration report is drawn up and published in accordance with sections 2:135b and 2:145 sub-section 2 of the Dutch Civil Code. In accordance with the Dutch Corporate Governance Code, the Supervisory Board renders account of the implementation of the remuneration policy in 2023 in the remuneration report, as prepared by the Remuneration Committee.
Following the appointment by the General Meeting on May 7, 2015, we were engaged by the Supervisory Board as auditor of Koninklijke Philips N.V. on October 22, 2015, as of the audit for the year 2016 and have operated as statutory auditor ever since that date.
We have not provided prohibited non-audit services as referred to in Article 5(1) of the EU Regulation on specific requirements regarding statutory audit of public-interest entities.
Koninklijke Philips N.V. has prepared the annual report in ESEF. The requirements for this are set out in the Delegated Regulation (EU) 2019/815 with regard to regulatory technical standards on the specification of a single electronic reporting format (hereinafter: the RTS on ESEF).
In our opinion, the annual report, prepared in the XHTML format, including the (partially) marked-up group financial statements, as included in the reporting package by Koninklijke Philips N.V., complies in all material respects with the RTS on ESEF.
The Board of Management is responsible for preparing the annual report, including the financial statements, in accordance with the RTS on ESEF, whereby the Board of Management combines the various components into a single reporting package.
Our responsibility is to obtain reasonable assurance for our opinion whether the annual report in this reporting package complies with the RTS on ESEF.
We performed our examination in accordance with Dutch law, including Dutch Standard 3950N ’Assurance-opdrachten inzake het voldoen aan de criteria voor het opstellen van een digitaal verantwoordingsdocument’ (assurance engagements relating to compliance with criteria for digital reporting). Our examination included amongst others:
The Board of Management is responsible for the preparation and fair presentation of the financial statements in accordance with IFRS-EU and Part 9 of Book 2 of the Dutch Civil Code. Furthermore, the Board of Management is responsible for such internal control as the Board of Management determines is necessary to enable the preparation of the financial statements that are free from material misstatement, whether due to fraud or error.
As part of the preparation of the financial statements, the Board of Management is responsible for assessing the Company’s ability to continue as a going concern. Based on the financial reporting frameworks mentioned, the Board of Management should prepare the financial statements using the going concern basis of accounting unless the Board of Management either intends to liquidate the Company or to cease operations or has no realistic alternative but to do so. The Board of Management should disclose events and circumstances that may cast significant doubt on the Company’s ability to continue as a going concern in the financial statements.
The Supervisory Board is responsible for overseeing the Company’s financial reporting process.
Our objective is to plan and perform the audit engagement in a manner that allows us to obtain sufficient and appropriate audit evidence for our opinion.
Our audit has been performed with a high, but not absolute, level of assurance, which means we may not detect all material errors and fraud during our audit.
Misstatements can arise from fraud or error and are considered material if, individually or in the aggregate, they could reasonably be expected to influence the economic decisions of users taken on the basis of these financial statements. The materiality affects the nature, timing and extent of our audit procedures and the evaluation of the effect of identified misstatements on our opinion.
We have exercised professional judgment and have maintained professional skepticism throughout the audit, in accordance with Dutch Standards on Auditing, ethical requirements and independence requirements. The ‘Information in support of our opinion’ section above includes an informative summary of our responsibilities and the work performed as the basis for our opinion.
Our audit further included among others:
We communicate with the Supervisory Board regarding, among other matters, the planned scope and timing of the audit and significant audit findings, including any significant findings in internal control that we identify during our audit. In this respect, we also submit an additional report to the audit committee of the Supervisory Board in accordance with Article 11 of the EU Regulation on specific requirements regarding statutory audit of public-interest entities. The information included in this additional report is consistent with our audit opinion in this auditor’s report.
We provide the Supervisory Board with a statement that we have complied with relevant ethical requirements regarding independence, and to communicate with them all relationships and other matters that may reasonably be thought to bear on our independence, and where applicable, related safeguards.
From the matters communicated with the Supervisory Board, we determine the key audit matters: those matters that were of most significance in the audit of the financial statements. We describe these matters in our auditor’s report unless law or regulation precludes public disclosure about the matter or when, in extremely rare circumstances, not communicating the matter is in the public interest.
Amsterdam, the Netherlands, February 20, 2024
Ernst & Young Accountants LLP
Signed by F.J. Blenderman
To: the Supervisory Board and Shareholders of Koninklijke Philips N.V.
We have performed a reasonable assurance engagement on the ESG information for 2023 of Koninklijke Philips N.V. at Eindhoven. The ESG information is included in section 3.3 “Double Materiality Assessment”, Chapter 5 “Environmental, Social and Governance” (excluding sections 5.4.3 “Risk management and internal control framework ” and 5.4.5 “Remuneration policy”) and Chapter 12 “ESG statements” (excluding section 12.3.4 “EU Taxonomy disclosures”) (hereafter together: the ESG information) of the accompanying annual report.
In our opinion, the ESG information presents fairly, in all material respects:
in accordance with the applicable criteria as included in the section ‘Criteria’.
Furthermore we have performed a limited assurance engagement on the section 12.3.4 “EU Taxonomy disclosures” in the annual report (hereafter: the EU Taxonomy information).
Based on our procedures performed and the assurance information obtained, nothing has come to our attention that causes us to believe that the EU Taxonomy information is not prepared, in all material respects, in accordance with the applicable criteria as included in the section ‘Criteria’.
We have performed our reasonable assurance engagement on the ESG information and our limited assurance engagement on the EU Taxonomy information in accordance with Dutch law, including Dutch standard 3810N, “Assurance-opdrachten inzake duurzaamheidsverslaggeving” (Assurance engagements relating to sustainability reporting), which is a specified Dutch Standard that is based on the International Standard on Assurance Engagements (ISAE) 3000, “Assurance engagements other than audits or reviews of historical financial information”. Our responsibilities in this regard are further described in the section ‘Our responsibilities’ of our report.
We are independent of Koninklijke Philips N.V. in accordance with the Verordening inzake de onafhankelijkheid van accountants bij assurance-opdrachten (ViO, Code of Ethics for Professional Accountants, a regulation with respect to independence). This includes that we do not perform any activities that could result in a conflict of interest with our independent assurance engagement. Furthermore we have complied with the Verordening gedrags- en beroepsregels accountants (VGBA, Dutch Code of Ethics for Professional Accountants).
We believe that the assurance evidence we have obtained is sufficient and appropriate to provide a basis for our opinion and conclusion.
The criteria applied for the preparation of the ESG information are the GRI Sustainability Reporting Standards (GRI Standards) and the criteria supplementally applied as disclosed in section 12.1 “Approach to ESG reporting” of the annual report.
The ESG information is prepared with reference to the GRI Standards. The GRI Standards used are listed in the GRI Content Index as published on website of Koninklijke Philips N.V.
The criteria used for the EU Taxonomy information are the Regulation (EU) 2020/852 as supplemented with Commission Delegated Regulation (EU) 2021/2139, Commission Delegated Regulation (EU) 2021/2178, Commission Delegated Regulation (EU) 2023/2485 and Commission Delegated Regulation (EU) 2023/2486.
The comparability of ESG information and EU Taxonomy information between entities and over time may be affected by the absence of an uniform practice on which to draw, to evaluate and measure this information. This allows for the application of different, but acceptable, measurement techniques.
Consequently, the ESG information and EU Taxonomy information need to be read and understood together with the criteria applied.
The ESG information includes prospective information such as ambitions, strategy, plans, expectations, estimates and risk assessments. Prospective information relates to events and actions that have not yet occurred and may never occur. We do not provide assurance on the assumptions and achievability of this prospective information.
In the ESG information, the calculations to determine the KPIs Lives Improved, Environmental Profit & Loss and scope 3 emissions (Category 1 - Purchased goods and services and Category 11- Use of sold products) (hereinafter: the impact data) are mostly based on assumptions and sources from third parties. The assumptions and sources used are disclosed in section 12.1 “Approach to ESG reporting” of the annual report and further elaborated in the “Methodology for calculating Lives improved”, version 2023 (Lives improved methodology), the “Methodology for calculating the Environmental Profit & Loss Account”, version 2023 (EPL methodology) and the “Methodology for calculating scope 3 emissions”, version 2023 (Scope 3 Accounting methodology), as available on the website of Koninklijke Philips N.V. We have determined that these assumptions and external sources are appropriate, but we have not performed procedures on the content of these assumptions and external sources.
The references to external sources or websites in the ESG information are not part of the ESG information as included in the scope of our assurance engagement. We therefore do not provide assurance on this information.
Our opinion and conclusion are not modified in respect to these matters.
The Board of Management is responsible for the preparation and fair presentation of the ESG information and the EU Taxonomy information in accordance with the criteria as included in the section ‘Criteria’, including the identification of stakeholders and the definition of material matters.
The Board of Management is also responsible for selecting and applying the criteria and for determining that these criteria are suitable for the legitimate information needs of stakeholders, considering applicable law and regulations related to reporting. The choices made by the Board of Management regarding the scope of the ESG information, the EU Taxonomy information and the reporting policy are summarized in the section 12.1 “Approach to ESG reporting” of the annual report.
Furthermore, the Board of Management is responsible for such internal control as it determines is necessary to enable the preparation of the ESG information and the EU Taxonomy information that is free from material misstatement, whether due to fraud or error.
The Supervisory Board is responsible for overseeing the ESG information and the EU Taxonomy reporting process of Koninklijke Philips N.V.
Our responsibility is to plan and perform the assurance engagement in a manner that allows us to obtain sufficient and appropriate assurance evidence for our opinion and conclusion.
Our assurance engagement of the ESG information has been performed with a high, but not absolute, level of assurance, which means we may not have detected all material fraud and errors during our assurance engagement.
Our assurance engagement of the EU Taxonomy information is aimed to obtain a limited level of assurance to determine the plausibility of information. The procedures vary in nature and timing from, and are less in extent, than for a reasonable assurance engagement. The level of assurance obtained in a limited assurance engagement is therefore substantially less than the assurance that is obtained when a reasonable assurance engagement is performed.
We apply the Nadere voorschriften kwaliteitssystemen (NVKS, regulations for quality management systems) and accordingly maintain a comprehensive system of quality management including documented policies and procedures regarding compliance with ethical requirements, professional standards and other relevant legal and regulatory requirements.
For a more detailed description of our responsibilities, we refer to the appendix of this assurance report.
Eindhoven, February 20, 2024
Ernst & Young Accountants LLP
Signed by A.B.E. Laan
| Our assurance engagement included amongst others: | |
| |
Our reasonable assurance engagement of the ESG information included amongst others:
| Our limited assurance engagement of the EU Taxonomy information included amongst others:
|
We communicate with the Supervisory Board regarding, among other matters, the planned scope and timing of the assurance engagement and significant findings, including any significant findings in internal control that we identify during our assurance engagement.
Pursuant to article 34 of the articles of association of the Company, a dividend will first be declared on preference shares out of net income. The remainder of the net income, after any retention by way of reserve with the approval of the Supervisory Board, shall be available for distribution to holders of common shares subject to shareholder approval after year-end. As of December 31, 2023, the issued share capital consists only of common shares. No preference shares have been issued. Article 33 of the articles of association of the company gives the Board of Management the power to determine what portion of the net income shall be retained by way of reserve, subject to the approval of the Supervisory Board.
In this Annual Report Philips presents certain financial measures when discussing Philips’ performance that are not measures of financial performance or liquidity under IFRS (‘non-IFRS’). These non-IFRS measures (also known as non-GAAP or alternative performance measures) are presented because management considers them important supplemental measures of Philips’ performance and believes that they are widely used in the industry in which Philips operates as a means of evaluating a company’s operating performance and liquidity. Philips believes that an understanding of its sales performance, profitability, financial strength and funding requirements is enhanced by reporting the following non-IFRS measures:
Non-IFRS measures do not have standardized meanings under IFRS and not all companies calculate non-IFRS measures in the same manner or on a consistent basis. As a result, these measures may not be comparable to measures used by other companies that have the same or similar names. Accordingly, undue reliance should not be placed on the non-IFRS measures contained in this Annual Report and they should not be considered as substitutes for sales, net income, net cash provided by operating activities or other financial measures computed in accordance with IFRS.
This chapter contains the definitions of the non-IFRS measures used in this Annual Report as well as reconciliations from the most directly comparable IFRS measures. The non-IFRS measures discussed in this Annual Report are cross referenced to this chapter. These non-IFRS measures should not be viewed in isolation or as alternatives to equivalent IFRS measures and should be used in conjunction with the most directly comparable IFRS measures.
The non-IFRS financial measures presented are not measures of financial performance or liquidity under IFRS, but measures used by management to monitor the underlying performance of Philips’ business and operations and, accordingly, they have not been audited or reviewed by Philips’ external auditors.
Additionally, Philips provides forward-looking targets for comparable sales growth, adjusted EBITA margin improvement, free cash flow and organic ROIC, which are non-IFRS financial measures. Philips has not provided a quantitative reconciliation of these targets to the most directly comparable IFRS measures because certain information needed to reconcile these non-IFRS financial measures to the most comparable IFRS financial measures are dependent on specific items or impacts which are not yet determined, are subject to uncertainty and variability in timing and amount due to their nature, are outside of Philips’ control, or cannot be predicted, including items and impacts such as currency exchange rates, acquisitions and disposals, legal and tax gains and losses and pension settlements, charges and costs such as impairments, restructuring and acquisition-related charges, amortization of intangible assets and net capital expenditures. Accordingly, reconciliations of these non-IFRS forward looking financial measures to the most directly comparable IFRS financial measures are not available without unreasonable effort. Such unavailable reconciling items could significantly impact the results of operations and financial condition.
Comparable sales growth represents the period-on-period growth in sales excluding the effects of currency movements and changes in consolidation. As indicated in General information to the Consolidated financial statements, foreign currency sales and costs are translated into Philips’ presentation currency, the euro, at the exchange rates prevailing at the respective transaction dates. As a result of significant foreign currency sales and currency movements during the periods presented, the effects of translating foreign currency sales amounts into euros could have a material impact on the comparability of sales between periods. Therefore, these impacts are excluded when presenting comparable sales in euros by translating the foreign currency sales of the previous period and the current period into euros at the same average exchange rates. In addition, the years presented were affected by a number of acquisitions and divestments, as a result of which various activities were consolidated or deconsolidated. The effect of consolidation changes has also been excluded in arriving at the comparable sales. For the purpose of calculating comparable sales, when a previously consolidated entity is sold or control is lost, relevant sales of that entity for the corresponding prior year period are excluded. Similarly, when an entity is acquired and consolidated, relevant sales of that entity for the current year period are excluded.
Comparable sales growth is presented for the Philips Group, operating segments and geographic area. Philips’ believes that the presentation of comparable sales growth is meaningful for investors to evaluate the performance of Philips’ business activities over time. Comparable sales growth may be subject to limitations as an analytical tool for investors, because comparable sales growth figures are not adjusted for other effects, such as increases or decreases in prices or quantity/volume. In addition, interaction effects between currency movements and changes in consolidation are not taken into account.
Philips Group
Sales growth composition by segment
in %
| nominal growth | consolidation changes | currency effects | comparable growth | |
|---|---|---|---|---|
| 2023 versus 2022 | ||||
| Diagnosis & Treatment | 6.4 | 0.2 | 4.5 | 11.1 |
| Connected Care | (2.5) | 0.3 | 3.3 | 1.1 |
| Personal Health | (0.7) | 0.0 | 3.9 | 3.2 |
| Philips Group | 1.9 | 0.2 | 3.9 | 6.0 |
2022 versus 2021 | ||||
| Diagnosis & Treatment | 5.9 | 0.0 | (6.7) | (0.8) |
| Connected Care | (1.9) | 0.0 | (7.2) | (9.1) |
| Personal Health | 5.7 | 0.0 | (5.7) | 0.1 |
| Philips Group | 3.9 | (0.3) | (6.4) | (2.8) |
2021 versus 2020 | ||||
| Diagnosis & Treatment | 5.9 | (0.1) | 2.5 | 8.3 |
| Connected Care | (14.9) | (6.3) | 2.2 | (19.0) |
| Personal Health | 7.2 | 0.0 | 1.6 | 8.8 |
| Philips Group | (0.9) | (2.5) | 2.3 | (1.2) |
Philips Group
Sales growth composition by geographic area
in %
| nominal growth | consolidation changes | currency effects | comparable growth | |
|---|---|---|---|---|
| 2023 versus 2022 | ||||
| Western Europe | 6.0 | 0.3 | 0.3 | 6.6 |
| North America | (0.3) | 0.2 | 2.7 | 2.5 |
| Other mature geographies | (1.0) | 0.1 | 8.2 | 7.3 |
| Mature geographies | 1.4 | 0.2 | 2.7 | 4.2 |
| Growth geographies | 3.4 | 0.2 | 6.9 | 10.5 |
| Philips Group | 1.9 | 0.2 | 3.9 | 6.0 |
2022 versus 2021 | ||||
| Western Europe | (1.2) | (1.3) | (0.4) | (2.8) |
| North America | 11.9 | 0.2 | (12.4) | (0.3) |
| Other mature geographies | (3.0) | 0.0 | 2.5 | (0.5) |
| Mature geographies | 5.9 | (0.3) | (6.7) | (1.1) |
| Growth geographies | (0.8) | (0.1) | (5.9) | (6.9) |
| Philips Group | 3.9 | (0.3) | (6.4) | (2.8) |
2021 versus 2020 | ||||
| Western Europe | (1.5) | (1.3) | (0.4) | (3.2) |
| North America | (1.5) | (5.5) | 3.6 | (3.4) |
| Other mature geographies | (3.2) | (0.1) | 3.6 | 0.3 |
| Mature geographies | (1.8) | (3.5) | 2.4 | (2.8) |
| Growth geographies | 1.2 | (0.3) | 2.1 | 3.0 |
| Philips Group | (0.9) | (2.5) | 2.3 | (1.2) |
The term Adjusted EBITA is used to evaluate the performance of Philips and its segments. EBITA represents Income from operations excluding amortization and impairment of acquired intangible assets and impairment of goodwill. Adjusted EBITA represents EBITA excluding gains or losses from restructuring costs, acquisition-related charges and other items.
Restructuring costs are defined as the estimated costs of initiated reorganizations, the most significant of which have been approved by the Executive Committee, and which generally involve the realignment of certain parts of the industrial and commercial organization.
Acquisition-related charges are defined as costs that are directly triggered by the acquisition of a company, such as transaction costs, purchase accounting related costs and integration-related expenses.
Other items are defined as any individual item with an income statement impact (loss or gain) that is deemed by management to be both significant and incidental to normal business activity. This includes the following: litigation costs and settlements in favor of (or against) the company, gains (or losses) on sale of businesses or assets, remediation costs, impairment of assets, portfolio realignment charges, environmental charges and other items which are individually above an amount of EUR 20 million in a quarter, or an individual item which is above EUR 40 million across multiple quarters. Refer to Net income, Income from operations (EBIT) and Adjusted EBITA within the Results of operations section of Financial performance.
Philips considers the use of Adjusted EBITA appropriate as Philips uses it as a measure of segment performance and as one of its strategic drivers to increase profitability through re-allocation of its resources towards opportunities offering more consistent and higher returns. This is done with the aim of making the underlying performance of the businesses more transparent.
EBITA excludes amortization and impairment of acquired intangible assets and impairment of goodwill, which primarily relates to brand names, customer relationships and technology, as Philips believes that such amounts are inconsistent in amount and frequency, are significantly impacted by the timing and/or size of acquisitions and do not factor into its decisions on allocation of its resources across segments. Although we exclude amortization and impairment of acquired intangible assets from the Adjusted EBITA measure, Philips believes that it is important for investors to understand that these acquired intangible assets contribute to revenue generation.
Philips believes Adjusted EBITA is useful to evaluate financial performance on a comparable basis over time by factoring out restructuring costs, acquisition-related charges and other incidental items which are not directly related to the operational performance of Philips Group or its segments.
Adjusted EBITA may be subject to limitations as an analytical tool for investors, as it excludes restructuring costs, acquisition-related charges and other incidental items and therefore does not reflect the expense associated with such items, which may be significant and have a significant effect on Philips’ net income.
Adjusted EBITA margin refers to Adjusted EBITA divided by sales expressed as a percentage.
Adjusted EBITA is not a recognized measure of financial performance under IFRS. The reconciliation of Adjusted EBITA to the most directly comparable IFRS measure, Net income, for the years indicated is presented in the following table. Net income is not allocated to segments as certain income and expense line items are monitored on a centralized basis, resulting in them being shown on a Philips Group level only.
Adjusted EBITDA is defined as Income from operations excluding amortization and impairment of intangible assets, impairment of goodwill, depreciation and impairment of property, plant and equipment, restructuring costs, acquisition-related charges and other items.
Philips understands that Adjusted EBITDA is broadly used by analysts, rating agencies and investors in their evaluation of different companies because it excludes certain items that can vary widely across different industries or among companies within the same industry. Philips considers Adjusted EBITDA useful when comparing its performance to other companies in the HealthTech industry. However, Adjusted EBITDA may be subject to limitations as an analytical tool because of the range of items excluded and their significance in a given reporting period. Furthermore, comparisons with other companies may be complicated due to the absence of a standardized meaning and calculation framework. Philips management compensates for the limitations of using Adjusted EBITDA by using this measure to supplement IFRS results to provide a more complete understanding of the factors and trends affecting the business rather than IFRS results alone. In addition to the limitations noted above, Adjusted EBITDA excludes items that may be recurring in nature and should not be disregarded in the evaluation of performance. However, we believe it is useful to exclude such items to provide a supplemental analysis of current results and trends compared to other periods. This is because certain excluded items can vary significantly depending on specific underlying transactions or events. Also, the variability of such items may not relate specifically to ongoing operating results or trends and certain excluded items, while potentially recurring in future periods and may not be indicative of future results. Net income, for the years indicated is included in the following table. Net income is not allocated to segments as certain income and expense line items are monitored on a centralized basis, resulting in them being shown on a Philips Group level only.
Philips Group
Reconciliation of Net income to Adjusted EBITA and Adjusted EBITDA
in millions of EUR
| Philips Group | Diagnosis & Treatment | Connected Care | Personal Health | Other | |
|---|---|---|---|---|---|
| 2023 | |||||
| Net Income | (463) | ||||
| Discontinued operations, net of income taxes | 10 | ||||
| Income taxes | (73) | ||||
| Investments in associates, net of income taxes | 98 | ||||
| Financial expenses | 376 | ||||
| Financial income | (63) | ||||
| Income from operations | (115) | 720 | (1,199) | 552 | (188) |
| Amortization and impairment of acquired intangible assets | 290 | 89 | 178 | 14 | 9 |
| Impairment of goodwill | 8 | 8 | - | ||
| EBITA | 183 | 816 | (1,020) | 567 | (179) |
| Restructuring and acquisition-related charges | 381 | 118 | 115 | 9 | 140 |
| Other items: | 1,358 | 92 | 1,275 | 22 | (32) |
| Respironics litigation provision | 575 | 575 | |||
| Respironics field-action connected to the proposed consent decree | 363 | 363 | |||
| Respironics field-action running remediation costs | 224 | 224 | |||
| Quality remediation actions | 175 | 81 | 94 | ||
| Provision for a legal matter | 31 | 31 | |||
| Investment re-measurement loss | 23 | 23 | |||
| Gain on divestment of business | (35) | (35) | |||
| Remaining items | 2 | 11 | (12) | (1) | 3 |
| Adjusted EBITA | 1,921 | 1,026 | 369 | 597 | (71) |
| Depreciation, amortization and impairment of fixed assets and other intangible assets | 971 | 217 | 267 | 101 | 385 |
| Adding back impairment of fixed assets included in Restructuring and acquisition-related charges and Other items | (47) | (4) | (14) | (30) | |
| Adjusted EBITDA | 2,845 | 1,239 | 623 | 698 | 284 |
Philips Group
Reconciliation of Net income to Adjusted EBITA and Adjusted EBITDA
in millions of EUR
| Philips Group | Diagnosis & Treatment | Connected Care | Personal Health | Other | |
|---|---|---|---|---|---|
| 2022 | |||||
| Net Income | (1,605) | ||||
| Discontinued operations, net of income taxes | (13) | ||||
| Income taxes | (113) | ||||
| Investments in associates, net of income taxes | 2 | ||||
| Financial expenses | 258 | ||||
| Financial income | (58) | ||||
| Income from operations | (1,529) | 538 | (2,347) | 515 | (235) |
| Amortization and impairment of acquired intangible assets | 363 | 115 | 226 | 15 | 8 |
| Impairment of goodwill | 1,357 | 1,357 | |||
| EBITA | 192 | 652 | (764) | 531 | (227) |
| Restructuring and acquisition-related charges | 202 | 3 | 125 | 11 | 62 |
| Other items: | 925 | 133 | 750 | (4) | 46 |
| Respironics field-action connected to the proposed consent decree | 250 | 250 | |||
| Respironics field-action running remediation costs | 210 | 210 | |||
| R&D project impairments | 134 | 73 | 59 | 3 | |
| Portfolio realignment charges | 109 | 109 | |||
| Impairments of assets in S&RC | 39 | 39 | |||
| Provision for public investigations tender irregularities | 60 | 60 | |||
| Quality remediation actions | 59 | 59 | |||
| Remaining items | 63 | - | 24 | (6) | 46 |
| Adjusted EBITA | 1,318 | 788 | 111 | 538 | (119) |
| Depreciation, amortization and impairment of fixed assets and other intangible assets | 1,239 | 302 | 420 | 117 | 400 |
| Adding back impairment of fixed assets included in Restructuring and acquisition-related charges and Other items | (252) | (83) | (136) | (3) | (30) |
| Adjusted EBITDA | 2,305 | 1,008 | 394 | 652 | 250 |
Philips Group
Reconciliation of Net income to Adjusted EBITA and Adjusted EBITDA
in millions of EUR
| Philips Group | Diagnosis & Treatment | Connected Care | Personal Health | Other | |
|---|---|---|---|---|---|
| 2021 | |||||
| Net Income | 3,323 | ||||
| Discontinued operations, net of income taxes | (2,711) | ||||
| Income taxes | (103) | ||||
| Investments in associates, net of income taxes | 4 | ||||
| Financial expenses | 188 | ||||
| Financial income | (149) | ||||
| Income from operations | 553 | 948 | (716) | 576 | (255) |
| Amortization and impairment of acquired intangible assets | 322 | 142 | 158 | 15 | 6 |
| Impairment of goodwill | 15 | 2 | 13 | ||
| EBITA | 890 | 1,092 | (545) | 591 | (248) |
| Restructuring and acquisition-related charges | 95 | (30) | 130 | (1) | (5) |
| Other items: | 1,069 | (35) | 968 | - | 136 |
| Respironics field-action connected to the proposed consent decree | 719 | 719 | |||
| Respironics field-action running remediation costs | 94 | 94 | |||
| Quality remediation actions | 94 | 94 | |||
| Loss on divestment of business | 76 | 76 | |||
| Remaining items | 87 | (35) | 61 | - | 61 |
| Adjusted EBITA | 2,054 | 1,028 | 553 | 590 | (117) |
| Depreciation, amortization and impairment of fixed assets and other intangible assets | 1,001 | 221 | 314 | 116 | 351 |
| Adding back impairment of fixed assets included in Restructuring and acquisition-related charges and Other items | (70) | (4) | (68) | - | 2 |
| Adjusted EBITDA | 2,985 | 1,245 | 799 | 706 | 235 |
The term Adjusted income from continuing operations attributable to shareholders represents income from continuing operations less continuing operations non-controlling interests, amortization and impairment of acquired intangible assets, impairment of goodwill, excluding gains or losses from restructuring costs and acquisition-related charges, other items, adjustments to net finance expenses, adjustments to investments in associates and adjustments to tax expense. Shareholders refers to shareholders of Koninklijke Philips N.V.
Restructuring costs, acquisition-related charges and other items are all defined in the EBITA and Adjusted EBITA section above.
Net finance expenses are defined as either the financial income or expense component of an individual item already identified to be excluded as part of the Adjusted income from continuing operations, fair value movements of equity investments in limited life funds recognized at fair value through profit or loss or a financial income or expense component with an income statement impact (gain or loss) that is deemed by management to be both significant and incidental to normal business activity.
The adjustments to tax expense include the tax impact of the adjustments to income from continuing operations as well as tax only adjusting items, and uses the Weighted Average Statutory Tax Rate plus any recurring tax costs or benefits.
Philips considers the use of Adjusted income from continuing operations attributable to shareholders appropriate as Philips uses it as the basis for the Adjusted income from continuing operations attributable to shareholders per common share (in EUR) - diluted, a non-IFRS measure.
Adjusted income from continuing operations attributable to shareholders may be subject to limitations as an analytical tool for investors, as it excludes certain items and therefore does not reflect the expense associated with such items, which may be significant and have a significant effect on Philips’ net income. Net income, for the years indicated is included in the following table. Net income is not allocated to segments as certain income and expense line items are monitored on a centralized basis, resulting in them being shown on a Philips Group level only.
Adjusted income from continuing operations attributable to shareholders is not a recognized measure of financial performance under IFRS. The reconciliation of Adjusted income from continuing operations attributable to shareholders to the most directly comparable IFRS measure, Net income, for the years indicated is included in the following table.
Adjusted income from continuing operations attributable to shareholders per common share (in EUR) - diluted is calculated by dividing the Adjusted income from continuing operations attributable to shareholders by the diluted weighted average number of shares (after deduction of treasury shares) outstanding during the period, as defined in General information to the Consolidated financial statements, earnings per share section.
Philips considers the use of Adjusted income from continuing operations attributable to shareholders per common share (in EUR) - diluted appropriate as it is a measure that is useful when comparing its performance to other companies in the HealthTech industry. However, it may be subject to limitations as an analytical tool for investors, as it uses Adjusted income from continuing operations attributable to shareholders which has certain items excluded.
Adjusted income from continuing operations attributable to shareholders per common share (in EUR) - diluted is not a recognized measure of financial performance under IFRS. The most directly comparable IFRS measure, income from continuing operations attributable to shareholders per common share (in EUR) - diluted for the years indicated, is included in the following table.
Philips Group
Adjusted income from continuing operations attributable to shareholders1)
in millions of EUR unless otherwise stated
| 2021 | 2022 | 2023 | |
|---|---|---|---|
| Net income | 3,323 | (1,605) | (463) |
| Discontinued operations, net of income taxes | (2,711) | (13) | 10 |
| Income from continuing operations | 612 | (1,618) | (454) |
| Income from continuing operations attributable to non-controlling interests | (4) | (3) | (2) |
| Income from continuing operations attributable to shareholders1) | 608 | (1,622) | (456) |
| Adjustments for: | |||
| Amortization and impairment of acquired intangible assets | 322 | 363 | 290 |
| Impairment of goodwill | 15 | 1,357 | 8 |
| Restructuring costs and acquisition-related charges | 95 | 202 | 381 |
| Other items: | 1,069 | 925 | 1,358 |
| Respironics litigation provision | 575 | ||
| Respironics field-action connected to the proposed consent decree | 719 | 250 | 363 |
| Respironics field-action running remediation costs | 94 | 210 | 224 |
| Quality remediation actions | 94 | 59 | 175 |
| R&D project impairments | 134 | ||
| Portfolio realignment charges | 109 | ||
| Impairment of assets in S&RC | 39 | ||
| Provision for public investigations tender irregularities | 60 | ||
| Provision for a legal matter | 31 | ||
| Investment re-measurement loss | 23 | ||
| Loss (gain) on divestment of business | 76 | (35) | |
| Remaining items | 87 | 63 | 2 |
| Net finance income/expenses | (84) | (4) | 18 |
| Tax impact of adjusted items and tax only adjusting items | (527) | (376) | (450) |
| Adjusted Income from continuing operations attributable to shareholders1) | 1,497 | 845 | 1,148 |
| Earnings per common share: | |||
| Income from continuing operations attributable to shareholders1) per common share (in EUR) - diluted | 0.64 | (1.76) | (0.50) |
| Adjusted income from continuing operations attributable to shareholders1) per common share (in EUR) - diluted | 1.58 | 0.92 | 1.25 |
Free cash flow is defined as net cash flows from operating activities minus net capital expenditures. Net capital expenditures are comprised of the purchase of intangible assets, expenditures on development assets, capital expenditures on property, plant and equipment and proceeds from sales of property, plant and equipment.
Philips discloses free cash flow as a supplemental non-IFRS financial measure, as Philips believes it is a meaningful measure to evaluate the performance of its business activities over time. Philips understands that free cash flow is broadly used by analysts, rating agencies and investors in assessing its performance. Philips also believes that the presentation of free cash flow provides useful information to investors regarding the cash generated by the Philips operations after deducting cash outflows for purchases of intangible assets, capitalization of product development, expenditures on development assets, capital expenditures on property, plant and equipment and proceeds from disposal of property, plant and equipment. Therefore, the measure gives an indication of the long-term cash generating ability of the business. In addition, because free cash flow is not impacted by purchases or sales of businesses and investments, it is generally less volatile than the total of net cash provided by (used for) operating activities and net cash provided by (used for) investing activities.
Free cash flow may be subject to limitations as an analytical tool for investors, as free cash flow is not a measure of cash generated by operations available exclusively for discretionary expenditures and Philips requires funds in addition to those required for capital expenditures for a wide variety of non-discretionary expenditures, such as payments on outstanding debt, dividend payments or other investing and financing activities. In addition, free cash flow does not reflect cash payments that may be required in future for costs already incurred, such as restructuring costs.
Philips Group
Composition of free cash flow
in millions of EUR
| 2021 | 2022 | 2023 | |
|---|---|---|---|
| Net cash flows provided by operating activities | 1,629 | (173) | 2,136 |
| Net capital expenditures: | (729) | (788) | (554) |
| Purchase of intangible assets | (107) | (105) | (96) |
| Expenditures on development assets | (259) | (257) | (203) |
| Capital expenditures on property, plant and equipment | (397) | (444) | (345) |
| Proceeds from disposals of property, plant and equipment | 33 | 18 | 90 |
| Free cash flow | 900 | (961) | 1,582 |
Net debt : group equity ratio is presented to express the financial strength of Philips. Net debt is defined as the sum of long- and short-term debt minus cash and cash equivalents. Group equity is defined as the sum of shareholders’ equity and non-controlling interests. This measure is used by Philips Treasury management and investment analysts to evaluate financial strength and funding requirements. This measure may be subject to limitations because cash and cash equivalents are used for various purposes, not only debt repayment. The net debt calculation deducts all cash and cash equivalents whereas these items are not necessarily available exclusively for debt repayment at any given time.
Philips Group
Composition of net debt to group equity
in millions of EUR unless otherwise stated
| 2021 | 2022 | 2023 | |
|---|---|---|---|
| Long-term debt | 6,473 | 7,270 | 7,035 |
| Short-term debt | 506 | 931 | 654 |
| Total debt | 6,980 | 8,201 | 7,689 |
| Cash and cash equivalents | 2,303 | 1,172 | 1,869 |
| Net debt | 4,676 | 7,028 | 5,820 |
| Shareholders' equity | 14,438 | 13,249 | 12,028 |
| Non-controlling interests | 36 | 34 | 33 |
| Group equity | 14,475 | 13,283 | 12,061 |
| Net debt : group equity ratio | 24:76 | 35:65 | 33:67 |
Organic Return on Invested Capital (ROIC) is defined as organic return which includes income from operations for the year excluding the impact of: Income or Loss from operations of businesses acquired in the five year period prior to the measurement date; certain tax gains and losses determined by management to be material in nature and require separate disclosure and; certain other items; and tax effects of the other adjustments (calculated at group effective tax rate) divided by average of the Net operating capital at the end of each of the five quarters ending on the relevant measurement date excluding the average net operating capital at the end of each of the five quarters ending on the relevant measurement date of the businesses acquired in the five year period prior to the measurement date, expressed as a percentage.
Net operating capital is defined as tangible fixed assets, intangible fixed assets, including goodwill, inventories and receivable balances, minus payable balances and provisions, all as further defined below. Net operating capital is adjusted to exclude assets and liabilities of businesses acquired in the five year period prior to the relevant measurement date, and adjustments determined by management to be necessary for comparability.
Other items are defined as material in nature and require separate disclosure and have the same nature as the items excluded from Adjusted EBITA. In the years 2020-2022 these other items included legal provisions, pension settlements, results of divestments, remediation costs, impairment of assets and portfolio realignment charges. Refer to Net income, Income from operations (EBIT) and Adjusted EBITA within the Results of operations section of Financial performance. Organic ROIC is calculated after taxes.
The term Organic Return on Invested Capital (ROIC) is used by management to evaluate Philips’ efficiency at allocating the capital under its control to profitable investments and how well the company uses capital to generate returns. Philips believes that Organic ROIC provides useful information to investors because it excludes the impact of recently acquired businesses, giving a more accurate representation of how the Philips Business System is leveraged to drive operational excellence and removes irregularity caused by various operating models of recently acquired businesses. Philips also believes that excluding certain items determined by management to be material in nature and requiring separate disclosure enhances comparability across several periods. Organic ROIC may be subject to limitations as an analytical tool for investors, as it excludes Income or Loss from operations of acquired businesses and tax gains and losses and certain other items, which may have a significant effect on ROIC. Organic ROIC is not a recognized measure of financial performance under IFRS.
The most comparable IFRS measure to Organic ROIC is Return on total assets, calculated as Income from operations for the year divided by total assets as of the end of the year. Return on total assets as of the balance sheet date for the years ended December 31, 2020, 2021 and 2022 is included in the following table.
Philips Group
Return on total assets
in millions of EUR unless otherwise stated
| 2021 | 2022 | 2023 | |
|---|---|---|---|
| Income from operations | 553 | (1,529) | (115) |
| Total assets | 30,961 | 30,688 | 29,406 |
| Return on total assets (%) | 1.8% | (5.0)% | (0.4)% |
The reconciliation of Average Net operating capital and the reconciliation of Net income to Organic ROIC for the years ended December 31, 2020, 2021 and 2022 are included in the following tables.
Philips Group
Reconciliation of Average Net operating capital1)
in millions of EUR
| 2021 | 2022 | 2023 | |
|---|---|---|---|
| Tangible fixed assets | 2,716 | 2,715 | 2,553 |
| Intangible assets (including goodwill) | 13,454 | 14,684 | 13,475 |
| Inventories | 3,248 | 3,999 | 3,984 |
| Receivable balances2) | 4,648 | 5,043 | 4,981 |
| Payable balances3) | (6,627) | (7,129) | (6,810) |
| Provisions4) | (2,178) | (2,313) | (2,420) |
| Group Average Net operating capital | 15,261 | 16,999 | 15,763 |
| Net operating capital of businesses acquired | (5,511) | (5,739) | (4,081) |
| Average Net operating capital | 9,750 | 11,260 | 11,681 |
Philips Group
Reconciliation of Net Income to Organic ROIC
in millions of EUR unless otherwise stated
| 2021 | 2022 | 2023 | |
|---|---|---|---|
| Net Income | 3,323 | (1,605) | (463) |
| Discontinued operations, net of income taxes | (2,711) | (13) | 10 |
| Income taxes | (103) | (113) | (73) |
| Investments in associates, net of income taxes | 4 | 2 | 98 |
| Financial expenses | 188 | 258 | 350 |
| Financial income | (149) | (58) | (36) |
| Income from operations | 553 | (1,529) | (115) |
| Loss from operations of businesses acquired | 124 | 178 | 253 |
| Tax gains and losses | (197) | (169) | (140) |
| Goodwill impairment | 15 | 1,357 | 8 |
| Other items: | 872 | 802 | 1,181 |
| Respironics litigation provision | 575 | ||
| Respironics field-action connected to the proposed consent decree | 719 | 250 | 363 |
| Respironics field-action running remediation costs | 94 | 210 | 224 |
| R&D project impairments | 134 | ||
| Portfolio realignment charges | 109 | ||
| Impairment of assets in S&RC | 39 | ||
| Provision for specified legal matters | (17) | 60 | 31 |
| Investment re-measurement loss | 23 | ||
| Loss (gain) on divestment of business | 76 | (35) | |
| Income taxes | 103 | 113 | 73 |
| Tax effects of other adjustments | (33) | (45) | (56) |
| Organic return | 1,437 | 707 | 1,204 |
| Average Net operating capital | 9,750 | 11,260 | 11,681 |
| Organic ROIC (%) | 14.7% | 6.3% | 10.3% |
In addition to monitoring the IFRS and non-IFRS financial measures discussed under Financial performance, Philips’ management also uses the following other key performance indicators to monitor the performance of the business and to manage the business. Comparative results have been restated to reflect the treatment of the Domestic Appliances business as a discontinued operation (for more information, please refer to Discontinued operations and assets classified as held for sale).
Philips Group
Other Key Performance Indicators
| 2021 | 2022 | 2023 | |
|---|---|---|---|
| Lives improved, in billions | 1.67 | 1.81 | 1.88 |
| Operational carbon footprint, in kilotonnes CO2-equivalent | 519 | 438 | 418 |
| Circular revenue | 16.0% | 18.1% | 20.0% |
| Waste to landfill | 0.1% | 0.0% | 0.0% |
| Closing the Loop | 34.0% | 35.3% | 20.5% |
| Comparable order intake | 4% | (3)% | (5)% |
Lives Improved
The purpose of Philips is to improve people’s health and well-being through meaningful innovation and we aim to improve the lives of 2 billion people a year by 2025, including 300 million in underserved communities, rising to 2.5 billion and 400 million respectively by 2030. We use Lives Improved as a measurement of our societal impact. In the course of 2021 we changed the definition of ‘lives improved’ (effective January 2021) to align more closely with our purpose. The new definition includes only products or solutions that contribute to people’s health and well-being, and no longer includes the contribution from our Green Products and Solutions that support a healthy ecosystem. Additionally, as we discontinued our Domestic Appliances business, we have removed the impact of this business from the Lives Improved results. The combined impact of these changes resulted in an overall drop of 223 million lives improved in 2021. We calculate Lives Improved as the number of individual interactions for each product sold (based on market intelligence and statistical data) and multiply by the number of those products delivered in a year (eliminating double counting for multiple different product touches per individual). See Improving people’s lives for more information on Lives Improved.
Operational Carbon Footprint
We aim to minimize our environmental impact and we use the Operational Carbon Footprint as one of the measurements of our impact. We define Operational Carbon Footprint as the total greenhouse gas emissions caused by an organization, event, product or person; expressed in kilotonnes CO2-equivalent. We calculate our Operational Carbon Footprint on a monthly basis and include industrial sites (manufacturing and assembly sites), non-industrial sites (offices, warehouses, IT centers and R&D facilities), business travel (lease and rental cars and airplane travel) and logistics (air, sea and road transport) See Sustainable Operations for more information on our Operational Carbon Footprint.
Circular Revenues
Circular Revenues are revenues from Philips products, services and solutions that contribute to circular practices. Propositions that qualify for circular revenues must comply with the requirements for at least one of the circular revenue categories. These include, among others, products with low weight or containing a minimum threshold of recycled or bio-based plastics, as-a-service models, software running in the cloud, telehealth, upgrades, lifetime extensions, and refurbished equipment or components.
Waste to Landfill
At Philips, as a responsible company, we strive to reduce our environmental impact. We define Waste to Landfill as total waste that is delivered for landfill and exclude one-time-only waste and waste delivered to landfill due to regulatory requirements. We calculate Waste to Landfill in kilotonnes per year. See Sustainable Operations for more information on Waste to Landfill.
Closing the Loop
Closing the loop means we are embedding a policy to responsibly take back all professional medical equipment sold directly to customers as part of a trade-in offer or as a service at customer request. As part of the policy, we will ensure that equipment coming back to us is, where feasible, made available for refurbishment and/or parts recovery, or locally recycled in a certified way to ensure it does not end up in landfill. We monitor the impact of our policies by measuring the amount of equipment that we collect from our customers. We report on this as ‘reclaimed equipment’.
Philips believes that the five other key performance indicators described above (Lives Improved, Operational Carbon Footprint, Circular Revenues, Waste to Landfill and Closing the Loop) provide important information to investors and are important to understanding the long-term performance and prospects of the business. In addition, these other key performance indicators are also used for management compensation purposes. Members of the Board of Management are eligible for grants of performance shares under the Long-Term Incentive (LTI) Plan, and the vesting of the performance shares is subject to performance over a period of 3 years and based on certain criteria, including a 10% weighting for Sustainability Objectives, which Philips defines as the five other key performance indicators described above: Lives Improved, Carbon Footprint, Circular Revenues, Waste to Landfill and Closing the Loop. Philips believes that including these other key performance indicators in our remuneration policy encourages management to act responsibly and sustainably, supporting the company’s overall performance and enhancing the long-term value of the company. See Remuneration of the Board of Management in 2023 for more information on the Philips’ Long-Term Incentive (LTI) Plan.
Philips currently intends to propose a 2024 Remuneration Policy for the Board of Management which would, among other things, provide for the vesting of performance shares subject to performance over a period of 3 years and based on certain criteria, including a 20% weighting for Sustainability Objectives, which would be defined under that plan as: Lives Improved, Carbon Footprint, Circular Revenues and Employee Engagement Score. The 2024 Remuneration Policy is subject to the approval of Philips shareholders at the 2024 AGM. See Remuneration of the Board of Management in 2023, starting on page 115 for more information on the Philips’ Long-Term Incentive (LTI) Plans under the 2020 Remuneration Policy and the currently proposed 2024 Remuneration Policy.
Comparable order intake
Comparable order intake represents the period-on-period growth, expressed as a percentage, in order intake excluding the effects of currency movements and changes in consolidation. Comparable order intake is reported for equipment and software in the Diagnoses & Treatment and Connected Care segments, and is defined as the total contractually committed value of equipment and software to be delivered within a specified timeframe, and is an approximation of expected future revenue growth in the respective businesses. Comparable order intake does not derive from the financial statements and a quantitative reconciliation is thus not provided. In 2023, comparable order book was tracked for businesses that represented approximately 40% of 2023 sales.
Philips has simplified its order intake policy by aligning horizons for all modalities to 18 months to revenue. Order intake for software contracts corresponds to the same 18 months to revenue horizon, meaning that only the next 18 months conversion to revenue under the contract is recognized. Philips believes this policy eliminates major variances in order intake growth and better reflects expected revenue in the short term from order intake booked in the reporting period.
Philips uses comparable order intake as an indicator of business activity and performance. Comparable order intake is not an alternative to revenue and may be subject to limitations as an analytical tool due to differences in amount and timing between booking orders and revenue recognition. Due to divergence in practice, other companies may calculate this or a similar measure (such as order backlog) differently and therefore comparisons between companies may be complicated.
This document contains certain forward-looking statements with respect to the financial condition, results of operations and business of Philips and certain of the plans and objectives of Philips with respect to these items. Examples of forward-looking statements include statements made about our strategy, estimates of sales growth, future Adjusted EBITA*), future restructuring and acquisition-related charges and other costs, future developments in Philips’ organic business and the completion of acquisitions and divestments. Forward-looking statements can be identified generally as those containing words such as “anticipates”, “assumes”, “believes”, “estimates”, “expects”, “should”, “will”, “will likely result”, “forecast”, “outlook”, “projects”, “may” or similar expressions. By their nature, these statements involve risk and uncertainty because they relate to future events and circumstances and there are many factors that could cause actual results and developments to differ materially from those expressed or implied by these statements.
These factors include but are not limited to: Philips’ ability to gain leadership in health informatics in response to developments in the health technology industry; Philips’ ability to keep pace with the changing health technology environment; macroeconomic and geopolitical changes; integration of acquisitions and their delivery on business plans and value creation expectations; securing and maintaining Philips’ intellectual property rights, and unauthorized use of third-party intellectual property rights; ability to meet expectations with respect to ESG-related matters; failure of products and services to meet quality or security standards, adversely affecting patient safety and customer operations; breach of cybersecurity; challenges in simplifying our organization and our ways of working; the resilience of our supply chain; attracting and retaining personnel; challenges in driving operational excellence and speed in bringing innovations to market; compliance with regulations and standards including quality, product safety and (cyber) security; compliance with business conduct rules and regulations including privacy and upcoming ESG disclosure and due diligence requirements; treasury and financing risks; tax risks; reliability of internal controls, financial reporting and management process; global inflation.
As a result, Philips’ actual future results may differ materially from the plans, goals and expectations set forth in such forward-looking statements. For a discussion of factors that could cause future results to differ from such forward-looking statements, see also Risk management.
Statements regarding market share, contained in this document, including those regarding Philips’ competitive position, are based on outside sources such as specialized research institutes, industry and dealer panels in combination with management estimates. Where full year information regarding 2023 is not yet available to Philips, market share statements may also be based on estimates and projections prepared by management and/or based on outside sources of information. Management's estimates of rankings are based on order intake or sales, depending on the business.
In presenting and discussing the Philips Group’s financial position, operating results and cash flows, management uses certain non-IFRS financial measures. These non-IFRS financial measures should not be viewed in isolation as alternatives to the equivalent IFRS measure and should be used in conjunction with the most directly comparable IFRS measures. Non-IFRS financial measures do not have standardized meaning under IFRS and therefore may not be comparable to similar measures presented by other issuers. A reconciliation of these non-IFRS measures to the most directly comparable IFRS measures is contained in Reconciliation of non-IFRS information.
The chapters Group financial statements and Company financial statements contain the statutory financial statements of the company. The introduction to the chapter Group financial statements sets out which parts of this Annual Report form the management report within the meaning of Section 2:391 of the Dutch Civil Code.
Philips Group
Share information at year-end 2023
| Share listings | Euronext Amsterdam, New York Stock Exchange |
| Ticker code | PHIA, PHG |
| No. of shares issued | 914 million |
| No. of shares issued and outstanding | 906 million |
| Market capitalization | EUR 19 billion |
| Industry classification | |
| MSCI: Health Care Equipment | 35101010 |
| ICB: Medical Equipment | 4535 |
| Members of indices | AEX, NYSE, STOXX Europe 600 Healthcare, MSCI Europe Health Care |
The following information is based on a shareholder base analysis carried out for investor relations purposes by an independent provider in December 2023.
Philips Group
Shareholders by region at year-end1)
| 2023 | |
|---|---|
| United States | 40% |
| Netherlands | 16% |
| United Kingdom | 14% |
| Switzerland | 4% |
| Rest of Europe | 9% |
| Retail and Other2) | 16% |
Philips Group
Shareholders by style at year-end1)
| 2023 | |
|---|---|
| Value | 49% |
| Index | 14% |
| Growth | 11% |
| GARP | 11% |
| Retail | 9% |
| Other | 6% |
| Hedge Fund | 1% |
Financial calendar
| Annual General Meeting of Shareholders | |
| Record date 2024 AGM | April 9, 2024 |
| 2024 AGM | May 7, 2024 |
| Quarterly reports1) | |
| First quarter results 2024 | April 29, 2024 |
| Second quarter results 2024 | July 29, 2024 |
| Third quarter results 2024 | October 28, 2024 |
| Fourth quarter results 2024 | February 3, 2025 |
The Agenda and the explanatory notes to the Agenda for the Annual General Meeting of Shareholders on May 7, 2024, will be published on the company’s website.
For the 2024 Annual General Meeting of Shareholders, a record date of April 9, 2024 will apply. Those persons who, on that date, hold shares in the company, and are registered as such in one of the registers designated by the Board of Management for the Annual General Meeting of Shareholders, will be entitled to participate in, and vote at, the meeting.
Shareholders and other interested parties can make inquiries about the Annual Report 2023 to:
Royal Philips
Annual Report Office
Philips Center
P.O. Box 77900
1070 MX Amsterdam, The Netherlands
E-mail: annual.report@philips.com
The Annual Report on Form 20-F is filed electronically with the US Securities and Exchange Commission.
Communications concerning share transfers, share certificates, dividends and change of address should be directed to:
ABN AMRO Bank N.V.
Department Equity Capital Markets/Corporate Broking and Issuer Services HQ7212
Gustav Mahlerlaan 10,
1082 PP Amsterdam, The Netherlands
Telephone: +31-20-628-6070
E-mail: corporate.broking@nl.abnamro.com
Communications concerning share transfers, share certificates, dividends and change of address should be directed to:
Deutsche Bank Trust Company Americas
C/O Equiniti Trust Company LLC
Peck Slip Station, PO Box 2050, New York NY 10272-2050
Telephone (toll-free US): +1-866-706-8374
Telephone (outside of US): +1-718-921-8137
Website: www.equiniti.com
E-mail: adr@equiniti.com
Royal Philips offers a Dividend Reinvestment and Direct Stock Purchase Plan designed for the US market. This program provides existing shareholders and interested investors with an economical and convenient way to purchase and sell Philips New York Registry shares (listed at the New York Stock Exchange) and to reinvest cash dividends. Deutsche Bank (the registrar of Philips NY Registry shares) has been authorized to implement and administer both plans for registered shareholders of and new investors in Philips NY Registry shares. Philips does not administer or sponsor the Program and assumes no obligation or liability for the operation of the plan. For further information on this program and for enrollment forms, contact:
Deutsche Bank Trust Company Americas
C/O Equiniti Trust Company LLC
PO Box 10027, Newark NJ 07101
Telephone (toll free US): +1-866-706-8374
Telephone (outside of US): +1-718-921-8137
Website: www.equiniti.com
E-mail: adr@equiniti.com
Royal Philips is covered by approximately 20 analysts. For a list of our current analysts, please refer to: www.philips.com/a-w/about/investor/stock-info/analyst-coverage.html
Royal Philips
Philips Center
P.O. Box 77900
1070 MX Amsterdam, The Netherlands
Telephone: +31-20-59 77222
Website: www.philips.com/investor
E-mail: investor.relations@philips.com
Leandro Mazzoni
Head of Investor Relations
Telephone: +31-20-59 77222
Dorin Danu
Investor Relations Director
Telephone: +31-20-59 77055
Royal Philips
High Tech Campus 51, 1st floor
5656 AG Eindhoven, The Netherlands
Telephone: +31-40-27 83651
Website: www.philips.com/sustainability
E-mail: philips.sustainability@philips.com
Royal Philips
Philips Center
Amstelplein 2
1096 BC Amsterdam, The Netherlands
E-mail: group.communications@philips.com
For media contacts please refer to:
https://www.philips.com/a-w/about/news/contacts.html
High Tech Campus 52, 5656 AG Eindhoven, The Netherlands
In the context of the Respironics recall, actionable registrations are those that contain the necessary information needed to complete the remediation and are not awaiting further information, including from patient registrants.
Philips embraces the following formal definition of AI (source: European Commission High-Level Expert Group definition AI): Artificial intelligence (AI) systems are software (and possibly also hardware) systems designed by humans that, given a complex goal, act in the physical or digital dimension by perceiving their environment through data acquisition, interpreting the collected structured or unstructured data, reasoning on the knowledge, or processing the information, derived from this data and deciding the best action(s) to take to achieve the given goal.
AI systems can either use symbolic rules or learn a numeric model, and they can also adapt their behavior by analyzing how the environment is affected by their previous actions.
As a scientific discipline, AI includes several approaches and techniques, such as machine learning (of which deep learning and reinforcement learning are specific examples), machine reasoning (which includes planning, scheduling, knowledge representation and reasoning, search, and optimization), and robotics (which includes control, perception, sensors and actuators, as well as the integration of all other techniques into cyber-physical systems).
See also Philips AI Principles.
Brominated flame retardants are a group of chemicals that have an inhibitory effect on the ignition of combustible organic materials. Of the commercialized chemical flame retardants, the brominated variety are most widely used.
In the Philips Operating Model, our three operating segments are made up of six businesses, which are in turn comprised of 18 business units. See also the entry under Segment.
CO2-equivalent or carbon dioxide equivalent is a quantity that describes, for a given mixture and amount of greenhouse gas, the amount of CO2 that would have the same global warming potential (GWP), when measured over a specified timescale (generally 100 years).
A circular economy aims to decouple economic growth from the consumption of natural resources by optimizing their use, eliminating waste and pollution, and circulating products and materials for as long as possible, while giving natural systems the opportunity to regenerate themselves.
Circular Materials Management is a KPI for promoting an increase in the proportion of waste treated using waste management hierarchy levels that are circular: prevention, re-use, and recycling. Circular Materials Management % is the proportion of materials managed circularly in comparison to the total used materials baseline. The total used materials baseline is the total of both circular and linear waste, excluding linear disposal of waste that is required by law. Circular Materials Management includes recycling, re-use, prevention and other recovery (e.g. repurposing). It excludes all linear disposal, which is classified as waste to energy, incineration and landfill.
Circular Revenues are revenues from Philips products, services and solutions that contribute to circular practices. Propositions that qualify for circular revenues must comply with the requirements for at least one of the circular revenue categories. These include, among others, products with low weight or containing a minimum threshold of recycled or bio-based plastics, as-a-service models, software running in the cloud, telehealth, upgrades, lifetime extensions, and refurbished equipment.
Closing the loop means we are embedding a policy to responsibly take back all professional medical equipment sold directly to customers as part of a trade-in offer or as a service at customer request. As part of the policy, we will ensure that equipment coming back to us is, where feasible, made available for refurbishment and/or parts recovery, or locally recycled in a certified way to ensure it does not end up in landfill. We monitor the impact of our policies by measuring the amount of equipment that we collect from our customers. We report on this as ‘reclaimed equipment’.
The dividend yield is the annual dividend payment divided by Philips’ market capitalization. All references to dividend yield are as of December 31 of the previous year.
Philips’ ‘EcoHeroes’ concept aims to drive innovation beyond our EcoDesign requirements, delivering solutions that are demonstrably setting the pace in terms of environmental impact. An EcoHero product meets all EcoDesign requirements applicable to new product introductions and outperforms in at least one of the focal areas of EcoDesign (Energy, Packaging, Substances and Circularity).
The Employee Engagement Index (EEI) is the single measure of the overall level of employee engagement at Philips. It is a combination of perceptions and attitudes related to employee satisfaction, commitment and advocacy.
An energy-using product is a product that uses, generates, transfers or measures energy (electricity, gas, fossil fuel). Examples include boilers, computers, televisions, transformers, industrial fans and industrial furnaces.
In the Philips Operating Model, Philips' businesses are supported by lean Functions. The Functions deliver cost-effective services, ensure legal & regulatory requirements are deployed, and propose Enterprise policies, standards, guidance and infrastructure, as well as providing functional capabilities and expertise (e.g. via Centers of Excellence).
Full-time equivalent is a way to measure a worker’s involvement in a project. An FTE of 1.0 means that the person is equivalent to a full-time worker, while an FTE of 0.5 signals that the worker works half-time.
The Global Reporting Initiative (GRI) is a network-based organization that pioneered the world’s most widely used sustainability reporting framework. GRI is committed to the framework’s continuous improvement and application worldwide. GRI’s core goals include the mainstreaming of disclosure on environmental, social and governance performance.
Green/EcoDesigned Innovation comprises all R&D activities directly contributing to the intended development of Green/EcoDesigned Products.
A Green/EcoDesigned Product must comply with all applicable legal requirements, Philips policies, and all stated EcoDesigned Product requirements in our four focal areas: Energy, Substances, Circularity and Packaging. The aim is to improve the energy efficiency of our products, use less resources and more recycled content, avoid the use of hazardous substances, design for circularity, and make our packaging easier to recycle and re-use.
Green/EcoDesigned Revenues are generated through products that meet the Green/EcoDesigned Products definition.
Growth geographies consists of the grouping 'Growth', which comprises the developing geographies Asia Pacific (excluding Japan, South Korea, Australia and New Zealand), Latin America, Central & Eastern Europe, Middle East & Turkey (excluding Israel) and Africa.
Hazardous substances are generally defined as substances posing imminent and substantial danger to public health and welfare or the environment.
Income from operations as reported on the IFRS consolidated statement of income. The term EBIT (earnings before interest and tax) has the same meaning as Income from operations.
Income from continuing operations as reported on the IFRS consolidated statement of income, which is net income from continuing operations, or net income excluding discontinued operations.
The basic insight of Lean thinking is that if every person is trained to identify wasted time and effort in their own job and to better work together to improve processes by eliminating such waste, the resulting enterprise will deliver more value at less expense.
To calculate how many lives we are improving, market intelligence and statistical data on the number of people touched by the products contributing to the social or ecological dimension over the lifetime of a product are multiplied by the number of those products delivered in a year. After elimination of double counts – multiple different product touches per individual are only counted once – the number of lives improved by our innovative solutions is calculated.
Multi-year contractual agreement that represents a partnership to enable long-term collaboration.
Mature geographies are the highly developed markets constituting three geographic areas: Western Europe, North America, and Other mature (including Japan, South Korea, Israel, Australia and New Zealand).
Net Promoter Score®, or NPS®, measures customer experience and predicts business growth. NPS is calculated by taking the answer to a key question on a 0-10 scale: How likely is it that you would recommend [brand] to a friend or colleague?
Respondents are grouped as follows:
Subtracting the percentage of Detractors from the percentage of Promoters yields the Net Promoter Score, which can range from a low of -100 (if every customer is a Detractor) to a high of 100 (if every customer is a Promoter).
A carbon footprint is the total set of greenhouse gas emissions caused by an organization, event, product or person; usually expressed in kilotonnes CO2-equivalent. Philips' operational carbon footprint is calculated on a monthly basis and includes industrial sites (manufacturing and assembly sites), non-industrial sites (offices, warehouses, IT centers and R&D facilities), business travel (lease and rental cars and airplane travel) and logistics (air, sea and road transport).
References to 'Signify' in this Annual Report relate to Philips' former Lighting segment (prior to deconsolidation as from the end of November 2017 and when reported as discontinued operations), Philips Lighting N.V. (before or after such deconsolidation) or Signify N.V. (after its renaming in May 2018), as the context requires.
Polyvinyl chloride, better known as PVC or vinyl, is an inexpensive plastic so versatile it has become completely pervasive in modern society.
At Philips, we make value-based care principles actionable by addressing the Quadruple Aim – better health outcomes, improved patient experience, improved staff experience, and lower cost of care.
Registration, Evaluation, Authorization and Restriction of Chemicals (REACH;Regulation (EC) No 1907/2006) is a European Union regulation that addresses the production and use (e.g. in products) of chemical substances, and their potential impact on both human health and the environment. This regulation is covered in the Philips Regulated Substances List.
Philips Regulated Substances List (RSL) combines legal, industry, and voluntary Philips requirements regarding chemical substances used in Philips products and their packaging, either on a homogenous material level or present in the product as such. The RSL contains restricted and declarable substances.
The voluntary recall notification in the United States and field safety notice outside the United States for certain sleep and respiratory care products initiated by Philips Respironics in 2021.
The Responsible Business Alliance (formerly known as The Electronic Industry Citizenship Coalition (EICC)) was established in 2004 to promote a common code of conduct for the electronics and information and communications technology (ICT) industry. EICC now includes more than 100 global companies and their suppliers.
The RoHS Directive prohibits all new electrical and electronic equipment placed on the market in the European Economic Area from containing lead, mercury, cadmium, hexavalent chromium, poly-brominated biphenyls (PBB) or polybrominated diphenyl ethers (PBDE)and four phthalates (DEHP, DBP, BBP and DiHP), except in certain specific applications, in concentrations greater than the values decided by the European Commission. These values have been established as 0.01% by weight per homogeneous material for cadmium and 0.1% for the other nine substances. This regulation is covered in the Philips Regulated Substances List.
The Philips Operating Model identifies three operating segments – Diagnosis & Treatment, Connected Care and Personal Care – comprised of six businesses and 18 business units, as well as segment Other. Other includes Innovation & Strategy, IP Royalties, Central Costs, and other small items. See also the entry under Business/Business unit.
A combination of Philips (and 3rd-party) systems, devices, software, consumables and services, configured and delivered in a way to solve customer (segment)-specific needs and challenges.
The Sustainable Development Goals (SDGs) are a collection of 17 global goals set by the United Nations. The broad goals are interrelated though each has its own targets. The SDGs cover a broad range of social and economic development issues. These include poverty, hunger, health, education, climate change, water, sanitation, energy, environment and social justice.
Sustainable Innovation is the Research & Development spend related to the development of new generations of products and solutions that address the United Nations Sustainable Development Goals 3 (Ensure healthy lives and promote well-being for all at all ages) or 12 (Ensure sustainable consumption and production patterns). This includes all Diagnosis & Treatment and Connected Care innovation spend. In addition, innovation spend that contributes to Green Products and healthy living at Personal Health is included. Finally, innovation spend at Other that addresses the SDGs 3 and 12 is included.
Volatile organic compounds (VOCs) are organic chemicals that have a high vapor pressure at ordinary room temperature. Their high vapor pressure results from a low boiling point, which causes large numbers of molecules to evaporate or sublimate from the liquid or solid form of the compound and enter the surrounding air, a trait known as volatility.
Voluntary turnover covers all employees who resigned of their own volition.
The Waste Electrical and Electronic Equipment Directive (WEEE Directive) is the European Community directive on waste electrical and electronic equipment setting collection, recycling and recovery targets for all types of electrical goods. The directive imposes the responsibility for the disposal of waste electrical and electronic equipment on the manufacturers of such equipment.
The reconciliation of the effective tax rate is based on the applicable statutory tax rate, which is a weighted average of all applicable jurisdictions. This weighted average statutory tax rate (WASTR) is the aggregation of the result before tax multiplied by the applicable statutory tax rate without adjustment for losses, divided by the group result before tax.
All rights reserved